. 2022 Sep 6;40(10):111318.
doi: 10.1016/j.celrep.2022.111318.

Functional rewiring of G protein-coupled receptor signaling in human labor

Affiliations

Functional rewiring of G protein-coupled receptor signaling in human labor

Abigail R Walker et al. Cell Rep. .

Abstract

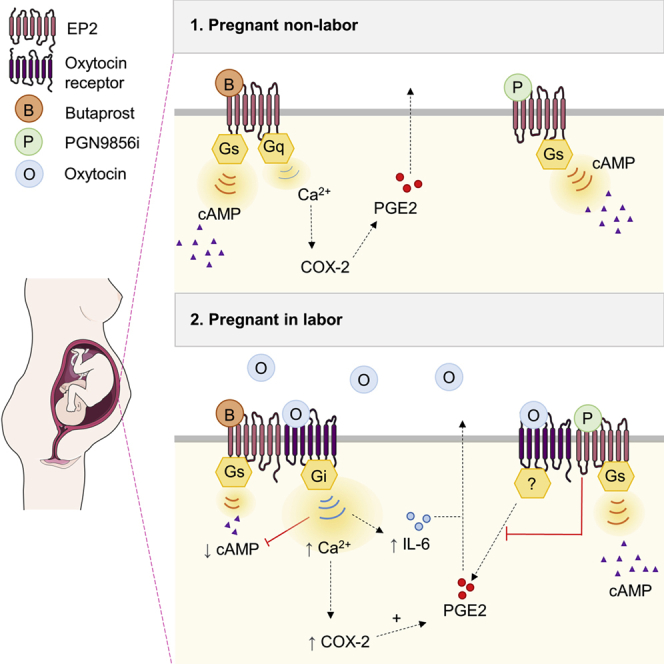
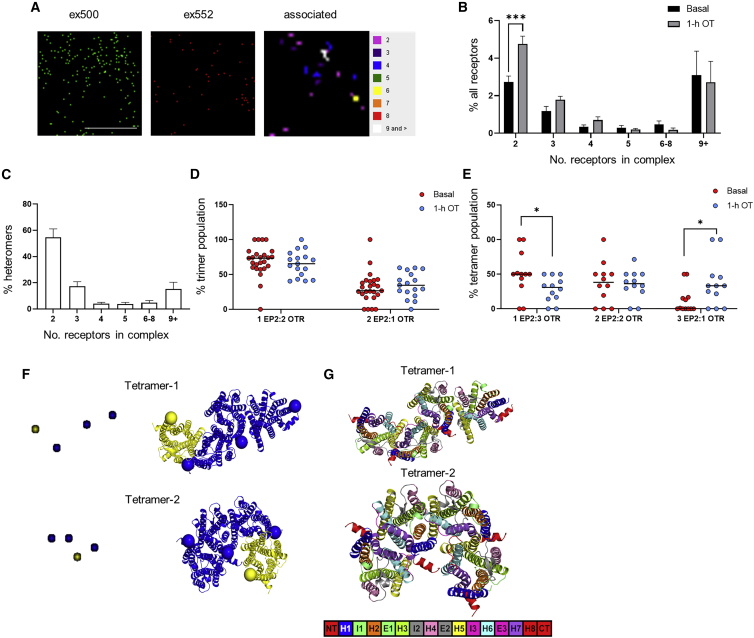
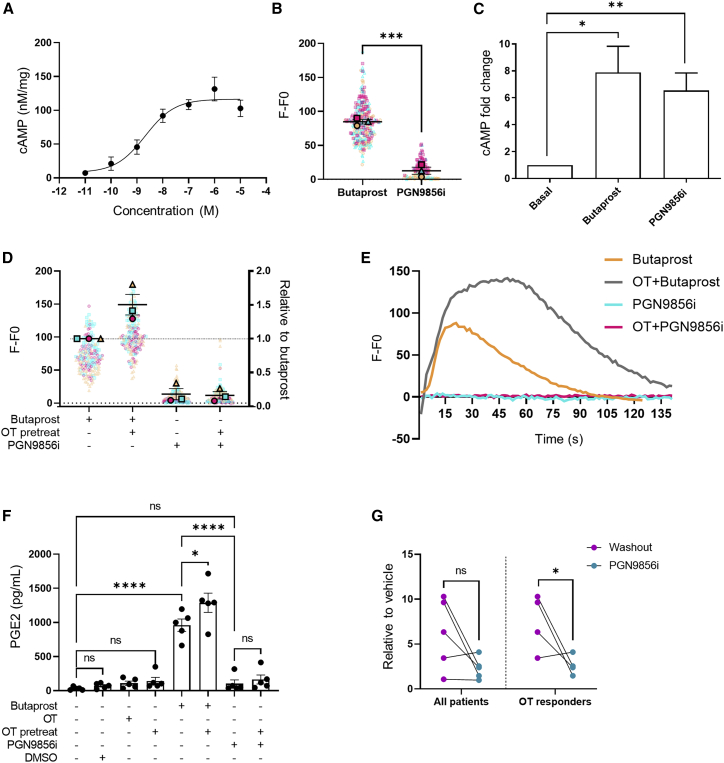
Current strategies to manage preterm labor center around inhibition of uterine myometrial contractions, yet do not improve neonatal outcomes as they do not address activation of inflammation. Here, we identify that during human labor, activated oxytocin receptor (OTR) reprograms the prostaglandin E2 receptor, EP2, in the pregnant myometrium to suppress relaxatory/Gαs-cAMP signaling and promote pro-labor/inflammatory responses via altered coupling of EP2 from Gαq/11 to Gαi/o. The ability of EP2 to signal via Gαi/o is recapitulated with in vitro OT and only following OTR activation, suggesting direct EP2-OTR crosstalk. Super-resolution imaging with computational modeling reveals OT-dependent reorganization of EP2-OTR complexes to favor conformations for Gαi over Gαs activation. A selective EP2 ligand, PGN9856i, activates the relaxatory/Gαs-cAMP pathway but not the pro-labor/inflammatory responses in term-pregnant myometrium, even following OT. Our study reveals a mechanism, and provides a potential therapeutic solution, whereby EP2-OTR functional associations could be exploited to delay preterm labor.

Keywords: CP: Cell biology; EP2; G protein-coupled receptor; crosstalk; heteromer; myometrium; oxytocin; pregnancy; preterm labor.


Conflict of interest statement

Declaration of interests An international patent application for the method of use of PGN9856i in preterm labor described in this manuscript has been filed (PCT/GB2021/051,971) on behalf of A.R.W., P.R.B., and A.C.H. by Imperial College London. The remaining authors declare no competing interests.

Figures

None
Graphical abstract
Figure 1
Figure 1
EP2 signaling in pregnant human myocytes is altered during labor to favor pro-inflammatory pathways Myocytes cultured without passage (P0) were established from term-pregnant human myometrium from the following groups: L−, non-laboring; L + E, early-stage spontaneous labor; L+L, late-stage spontaneous labor; L + IE, early-stage induced labor; L + IL, late-stage induced labor. (A) Intracellular cAMP measurements following stimulation with either butaprost (5 min, 10 μM) or isoproterenol (5 min, 10 μM). Data are shown as mean ± SEM; L− n = 4. All other groups, n = 5. One-way ANOVA with Dunnett’s post-hoc test: ∗∗p < 0.01, ∗∗∗p < 0.001, ∗∗∗∗p < 0.0001. (B) COX-2 protein (70 kDa) levels determined by western blot and normalized to GAPDH (38 kDa) following treatment with butaprost (6 h, 10 μM). Data are shown are fold change over basal, mean ± SEM, n = 5. One-way ANOVA with Dunnett’s post-hoc test: p < 0.05. (C) Representative western blot corresponding to (B). (D) Correlation matrix and correlation coefficients for functional data from all patients in (A)–(C) with RNA-seq-derived normalized expression levels of EP2 (Ptger2), OTR (Oxtr), and Gα subunits GNAS, GNAI/O, and GNAQ/11 quantified via RNA-seq. See also Figure S1.
Figure 2
Figure 2
Oxytocin (OT) priming of non-laboring myocytes reprograms EP2-mediated pro- and anti-labor pathways via a Gαi/o mechanism (A and B) Butaprost (10 μM) (A) and isoproterenol-mediated (10 μM) (B) cAMP response before and after 1 h OT pretreatment (100 nM). Data shown are normalized to butaprost or isoproterenol treatment, mean ± SEM, n = 3. p < 0.05 by one-sample t test. (C) Intracellular Ca2+ release following butaprost (10 μM) stimulation with/without pertussis toxin (PTX; 200 ng/mL) and/or 1 h OT (100 nM) pretreatment. Data are the maximal fluorescent intensity normalized to unstimulated baseline (F-F0) shown for each cell analyzed, overlaid with the mean of the maximum cell intensity per experiment ± SEM. Each cell analyzed is represented and color coded for each biological repeat. Data are shown relative to butaprost response ± SEM. n = 3. (D) Representative fluorescent intensity traces from (C). (E) Butaprost (10 μM, 6 h)-mediated upregulation of COX-2 protein (70 kDa) following with/without PTX and 1 h OT pretreatment, determined by western blot and normalized to GAPDH levels (38 kDa). Data are shown as fold change over basal, mean ± SEM, n = 4. One-sample t test: p < 0.05, ∗∗∗∗p < 0.0001. Unpaired t test: #p < 0.05. (F) Representative western blot for (E). (G) Release of IL-6 following 6 h butaprost (10 μM) stimulation with/without PTX and/or OT pretreatment. Data are shown as mean ± SEM, n = 4. One-way ANOVA with Sidak’s post-hoc test: ∗∗∗∗p < 0.0001. See also Figure S2.
Figure 3
Figure 3
EP2 activates pro-labor pathways in laboring myocytes via a Gαi/o pathway Myocyte cultures (P0) were obtained from term-pregnant, laboring myometrium. (A) Myocytes were loaded with Fluo4-AM and imaged live via confocal microscopy. Butaprost (10 μM)-mediated intracellular Ca2+ release with/without PTX (200 ng/mL) pretreatment. Data are the maximal fluorescent intensity normalized to unstimulated baseline (F-F0) shown for each cell analyzed, overlaid with the mean of the maximum cell intensity per experiment shown relative to the butaprost-only response ± SEM. Variation within the butaprost-only response is also shown. Each cell analyzed is represented and color coded for each biological repeat, n = 5. One sample t test: p < 0.05. (B) Representative fluorescent intensity traces over time from (A). (C) Release of IL-6 in laboring myometrial cells following 6 h butaprost (10 μM) stimulation with/without PTX (200 ng/mL). Data are shown as fold change over basal, including the variation within the basal, mean ± SEM, n = 5. One-sample t test: p < 0.05. Unpaired t test: #p < 0.05. (D) Butaprost (10 μM)-mediated upregulation of COX-2 protein (70 kDa) with/without PTX pretreatment (200 ng/mL) determined by western blot and normalized to levels of GAPDH (38 kDa). Mean ± SEM, n = 4. One way ANOVA with Sidak’s post-hoc test: p < 0.05. (E) Representative western blots for (D).
Figure 4
Figure 4
EP2-dependent Gαi/o signaling requires ligand-activated OTR Intracellular Ca2+ release was measured in wild-type (WT) HEK 293 cells or HEK 293 cells lacking endogenous Gαq/11 proteins (ΔGαq/11). Cells were stimulated with vehicle (DMSO) or butaprost (10 μM) with/without 1 h OT pretreatment and/or PTX pretreatment (200 ng/mL). (A) Cells expressing EP2. Data are the maximal fluorescent intensity normalized to unstimulated baseline (F-F0) shown for each cell analyzed, overlaid with the mean of the maximum cell intensity per experiment ± SEM. Each cell analyzed is represented and color coded for each biological repeat. n = 3 independent experiments. ANOVA with Sidak’s post-hoc test: ∗∗∗p < 0.001. (B) Ca2+ intensity traces from representative cells from (A). (C) Cells co-expressing EP2 and OTR. Maximal fluorescent intensity normalized to unstimulated cells as in (A). (D) Representative Ca2+ intensity from (C). n = 3 independent experiments. ANOVA with Sidak’s post-hoc test: ∗∗∗p < 0.001. See also Figure S3.
Figure 5
Figure 5
EP2-OTR heterotetramer complexes are reorganized following OTR activation (A) Representative PD-PALM super-resolution images of FLAG-EP2 labeled with CAGE 500 (ex500) and HA-OTR labeled with CAGE 552 (ex552). Images are 2 μm2 box; scale bar, 1 μM with heatmap of the number of associated molecules. (B) EP2-OTR heteromers with/without OT (100 nM, 1h) expressed as percentage of all receptors. Mean ± SEM, n = 4 independent experiments of 4–6 cells each. (C) Preformed EP2-OTR complexes as percentage of total heteromers from (B). Mean ± SEM. (D and E) Composition of heterotrimers (D) and heterotetramers (E) stimulated with/without OT. Mean ± SEM, basal n = 7, 2–6 cells each, OT treated n = 4, 3–4 cells each. p < 0.05, ∗∗∗p < 0.001, unpaired, two-tailed Student’s t test. (F) PD-PALM images (left) concerning the most recurrent spatial arrangements of 2 activated OTR (yellow) and EP2 (blue) heterotetramers are shown adjacent to the structural models whose architectures closely align with PD-PALM images. Yellow (OTR) and blue (EP2) spheres are centered on the Cα-carbon atom of the first amino acid. (G) The same structural models as in F are colored according to helices (H), extracellular loops (E), and intracellular loops (I) (see legend bar). Numbers highlight the helices at the interface between OTR and EP2. See also Figures S4 and S5.
Figure 6
Figure 6
PGN9856i does not activate pro-labor pathways of EP2 and is resistant to modulation by activated OTR (A) HEK 293 cells stably expressing FLAG-EP2 were stimulated with PGN9856i (0.01 nM–10 μM, 5 min), and cAMP levels were measured and normalized to protein. Data represent mean ± SEM, n = 3. (B) Intracellular Ca2+ release in HEK 293 cells stably expressing human EP2. Cells were imaged before and following stimulation with either PGN9856i (100 nM) or butaprost (10 μM). Data are the maximal fluorescent intensity normalized to unstimulated baseline (F-F0) shown for each cell analyzed, overlaid with the mean of the maximum cell intensity per experiment ± SEM. Each cell analyzed is represented and color coded for each biological repeat, shown as mean ± SEM. Thirty cells were imaged in duplicate per sample, n = 3. p value calculated by unpaired Student’s t test, ∗∗∗p < 0.001. (C) cAMP levels in non-laboring primary myometrial cells stimulated with either butaprost (10 μM) or PGN9856i (100 nM). Data are shown as fold change over basal, mean ± SEM, n = 7. p < 0.05, one-sample t test. (D) Intracellular Ca2+ levels in non-laboring myometrial cells following butaprost or PGN9856i with/without OT pretreatment (1 h, 100 nM). Data are the maximal fluorescent intensity normalized to unstimulated baseline (F-F0) shown for each cell analyzed, overlaid with the mean of the maximum cell intensity per experiment shown relative to the butaprost-only response ±SEM. Each cell analyzed is represented and color coded for each biological repeat. Mean ± SEM of fold change over butaprost, n = 3. One sample t test: ∗∗p < 0.01. Unpaired t test: ns, p > 0.05. (E) Representative Ca2+ responses from (D). (F) Secreted PGE2 in pregnant non-laboring myometrial cells following 6 h stimulation with either butaprost, PGN9856i, OT, or DMSO with/without OT pretreatment. Mean ± SEM, n = 5. One way ANOVA with Sidak post-hoc test: p < 0.05, ∗∗∗∗p < 0.0001. (G) PGE2 release from data in (F) normalized to vehicle. Left panel represents all patient data (n = 5), and right panel shows data only from patients who responded to OT in terms of increasing PGE2 (n = 4). Data are shown as mean ± SEM. Unpaired t test: p < 0.05. See also Figure S6.

References

    1. Albizu L., Cottet M., Kralikova M., Stoev S., Seyer R., Brabet I., Roux T., Bazin H., Bourrier E., Lamarque L., et al. Time-resolved FRET between GPCR ligands reveals oligomers in native tissues. Nat. Chem. Biol. 2010;6:587–594. doi: 10.1038/nchembio.396. - DOI - PMC - PubMed
    1. Ayoub M.A., Pfleger K.D.G. Recent advances in bioluminescence resonance energy transfer technologies to study GPCR heteromerization. Curr. Opin. Pharmacol. 2010;10:44–52. doi: 10.1016/j.coph.2009.09.012. - DOI - PubMed
    1. Balenga N.A., Martínez-Pinilla E., Kargl J., Schröder R., Peinhaupt M., Platzer W., Bálint Z., Zamarbide M., Dopeso-Reyes I.G., Ricobaraza A., et al. Heteromerization of GPR55 and cannabinoid CB2 receptors modulates signalling. Br. J. Pharmacol. 2014;171:5387–5406. doi: 10.1111/bph.12850. - DOI - PMC - PubMed
    1. Bertrand J.A., Woodward D.F., Sherwood J.M., Wang J.W., Overby D.R. The role of EP 2 receptors in mediating the ultra- lasting intraocular pressure reduction by JV-GL1. Br. J. Ophthalmol. 2020;105:1610–1616. doi: 10.1136/bjophthalmol-2020-317762. - DOI - PMC - PubMed
    1. Buenaventura T., Bitsi S., Laughlin W.E., Burgoyne T., Lyu Z., Oqua A.I., Norman H., McGlone E.R., Klymchenko A.S., Corrêa I.R., Jr., et al. Agonist-induced membrane nanodomain clustering drives GLP-1 receptor responses in pancreatic beta cells. PLoS Biol. 2019;17:e3000097. doi: 10.1371/journal.pbio.3000097. - DOI - PMC - PubMed

Publication types

Substances