. 2022 Oct 11;55(10):1799-1812.e4.
doi: 10.1016/j.immuni.2022.08.006. Epub 2022 Sep 6.

ABCC1 transporter exports the immunostimulatory cyclic dinucleotide cGAMP

Affiliations

ABCC1 transporter exports the immunostimulatory cyclic dinucleotide cGAMP

Joanna H Maltbaek et al. Immunity. .

Abstract

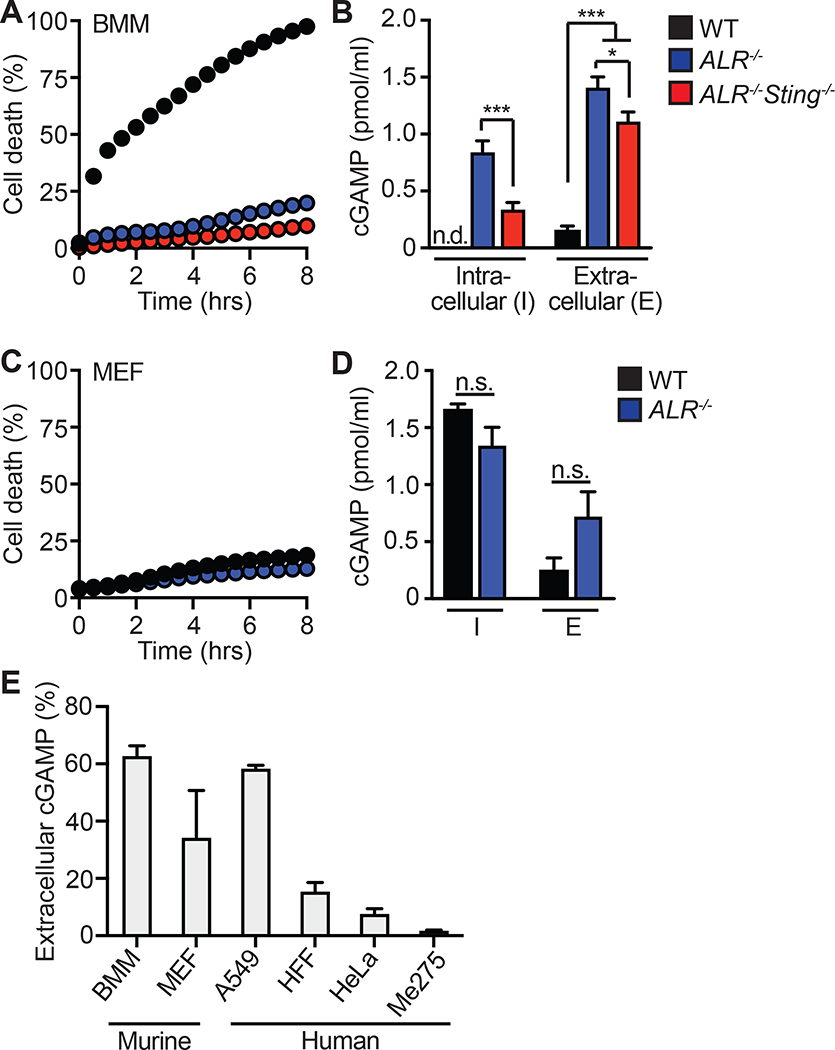
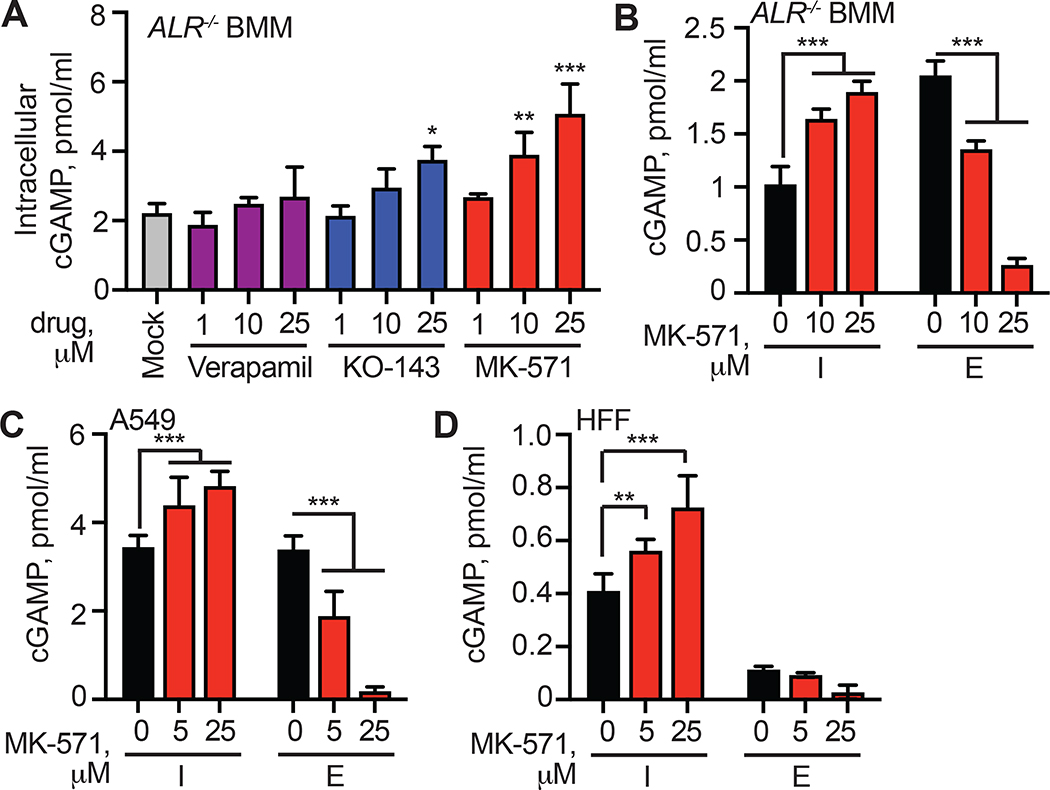
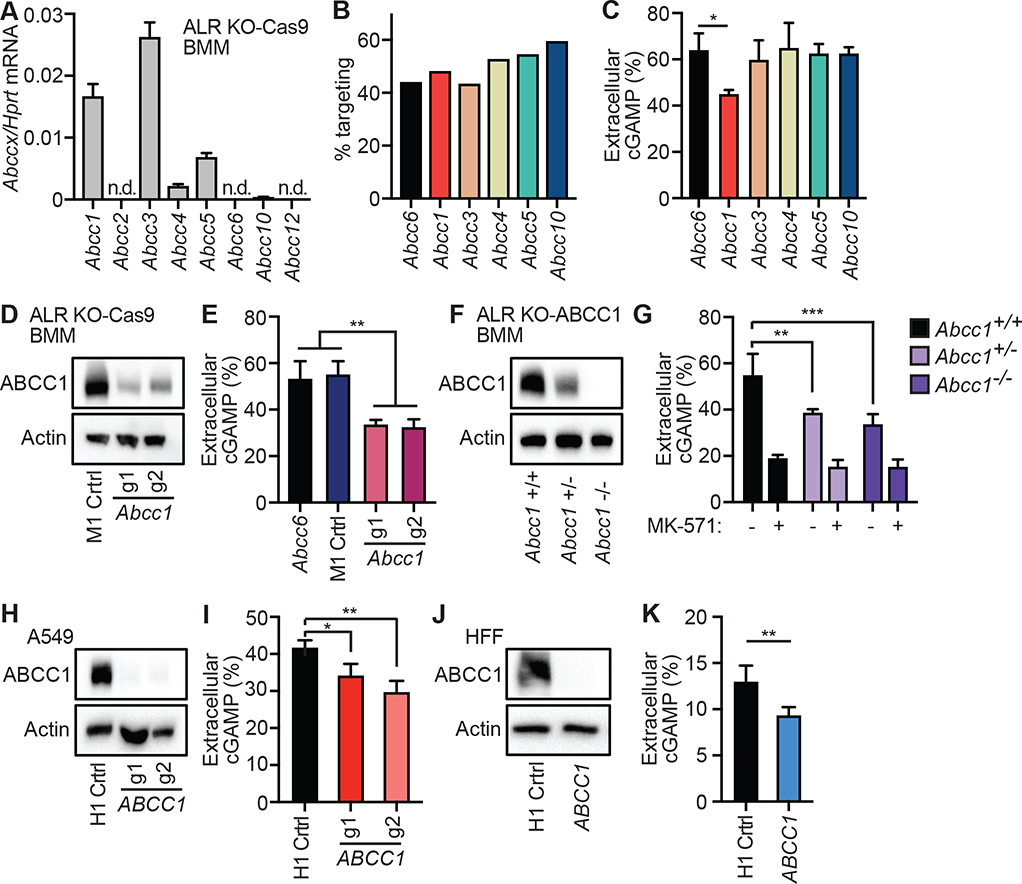
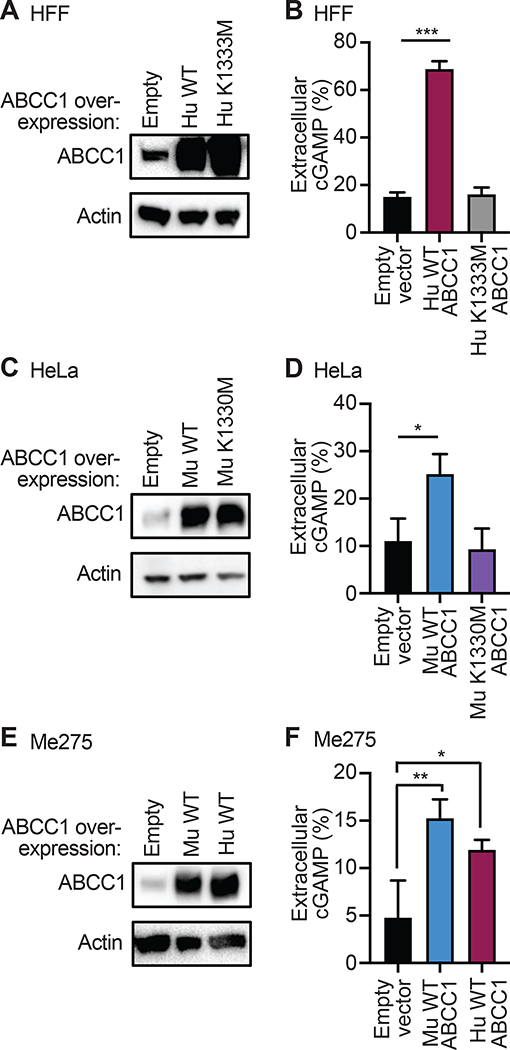
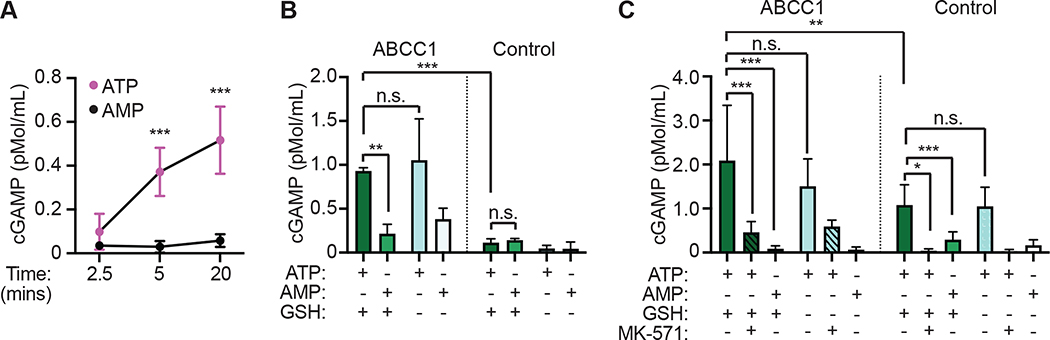
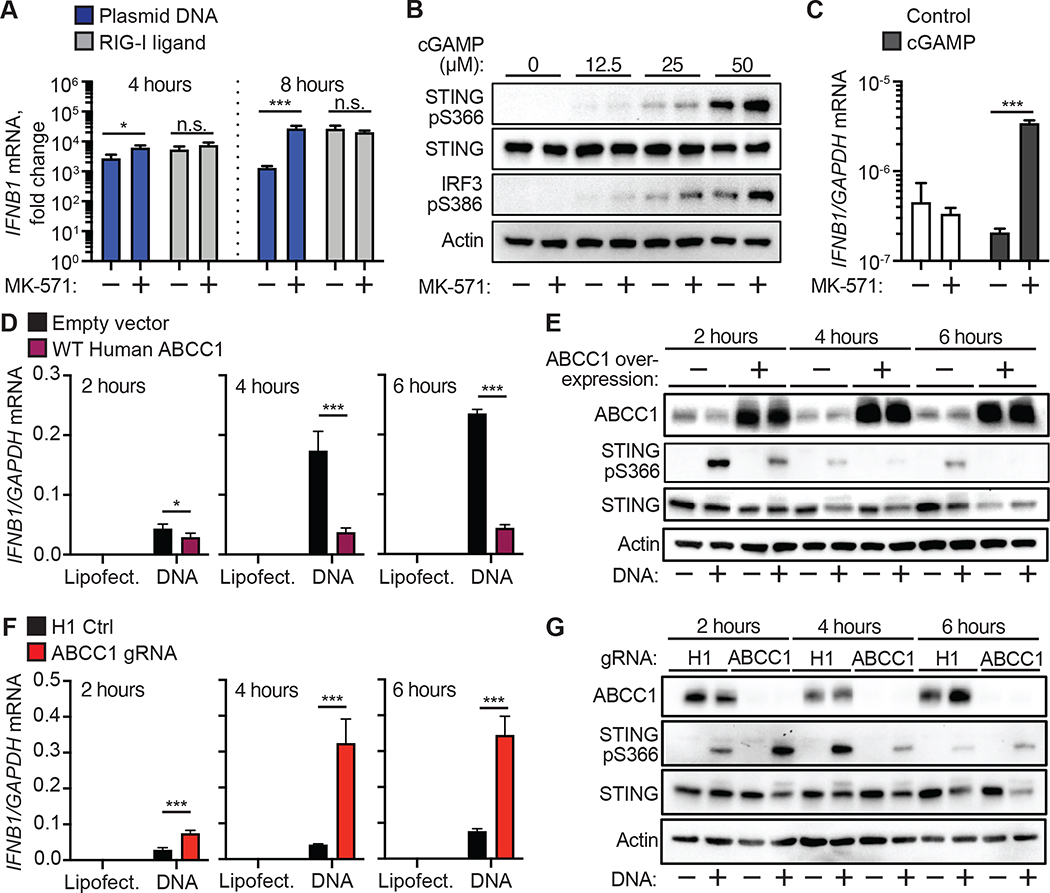
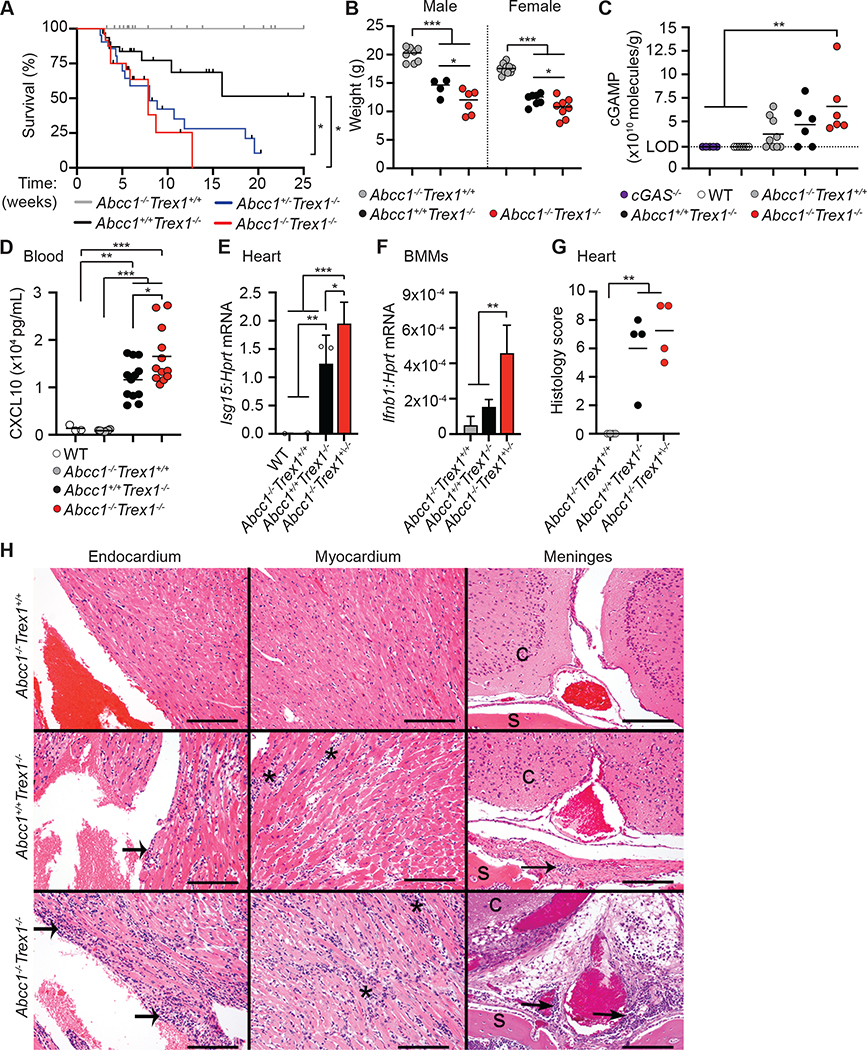
The DNA sensor cyclic GMP-AMP synthase (cGAS) is important for antiviral and anti-tumor immunity. cGAS generates cyclic GMP-AMP (cGAMP), a diffusible cyclic dinucleotide that activates the antiviral response through the adaptor protein stimulator of interferon genes (STING). cGAMP cannot passively cross cell membranes, but recent advances have established a role for extracellular cGAMP as an "immunotransmitter" that can be imported into cells. However, the mechanism by which cGAMP exits cells remains unknown. Here, we identifed ABCC1 as a direct, ATP-dependent cGAMP exporter in mouse and human cells. We show that ABCC1 overexpression enhanced cGAMP export and limited STING signaling and that loss of ABCC1 reduced cGAMP export and potentiated STING signaling. We demonstrate that ABCC1 deficiency exacerbated cGAS-dependent autoimmunity in the Trex1-/- mouse model of Aicardi-Goutières syndrome. Thus, ABCC1-mediated cGAMP export is a key regulatory mechanism that limits cell-intrinsic activation of STING and ameliorates STING-dependent autoimmune disease.

Keywords: ABCC1; Aicardi-Goutières syndrome; MRP1; STING; cGAMP; cGAS; interferons.


Conflict of interest statement

Declaration of interests D.B.S. is a co-founder and shareholder of Danger Bio, LLC and a scientific advisor for Related Sciences, LLC.

Figures

Figure 1.
Figure 1.. cGAMP is exported from live cells following cGAS activation.
(A) Cell death of BMMs from WT, ALR−/−, ALR−/−Sting−/− mice transfected with calf thymus DNA (CT DNA) quantified using an IncuCyte imaging system. (B) cGAMP quantification using ELISA from cell lysates and supernatants in (A) 8 hours after transfection. (C) Cell death of MEFs from WT or ALR−/− mice transfected with calf thymus DNA (CT-DNA) quantified using an IncuCyte imaging system. (D) cGAMP quantification using ELISA from cell lysates and supernatants in (C) 8 hours after transfection. (E) Percent extracellular cGAMP of indicated cell types 8 hours after CT DNA transfection. cGAMP ELISA was used to determine relative extracellular and intracellular concentrations before calculating the percent extracellular. Error bars represent mean ± SD of three biological replicates per group. *p<0.05, ***p<0.001. All data are shown are derived from a single experiment. Comparative results were obtained across three independent experiments. See also Figure S1.
Figure 2.
Figure 2.. MK-571 blocks cGAMP export in mouse and human cells.
(A) ALR−/− BMMs were treated with 1, 10, or 25 μM of indicated inhibitor or mock, followed by CT DNA transfection. 8 hours later, intracellular cGAMP was quantified in cell lysates using ELISA. (B) ALR−/− BMMs were treated with 10 or 25 μM MK-571 or mock, followed by CT DNA transfection. 8 hours later, cell lysates and supernatants were harvested and cGAMP was quantified using ELISA (I: intracellular; E: extracellular). (C, D) The indicated human cell types were treated with MK-571 (0–25 μM) followed by CT DNA transfection. 8 hours later, cell lysates and supernatants were harvested and cGAMP was quantified using ELISA. Statistical analysis was performed using a one-way ANOVA comparing all drug treatments to mock (A) or a two-way ANOVA comparing drug treatments to mock-treated conditions in the intracellular or extracellular compartment (B-D). Tests corrected for multiple comparisons using the Holm-Sidak method. Error bars represent mean ± SD of three biological replicates per group. **p<0.01, ***p<0.001. All data shown are derived from a single representative experiment. Comparative results were obtained across three independent experiments.
Figure 3.
Figure 3.. Identification of ABCC1 as a cGAMP exporter.
(A) Quantification of ABCC family member mRNA transcript expression in ALR−/−Cas9+ BMMs by RT-qPCR. (B) ALR−/−Cas9+ BMMs were transduced with lentiCRISPR encoding the indicated ABCC family-specific gRNAs, selected for 3 days, and then percent genomic targeting was calculated using Sanger sequencing and Tracking of Indels by DEcomposition (TIDE) analysis. (C) Cells from (B) were transfected with CT DNA and then 8 hours later cGAMP was quantified in supernatants and cell lysates using ELISA. (D) ALR−/−Cas9+ BMMs were transduced with lentiCRISPR encoding Abcc1 or M1 control-specific gRNAs as described in (B) followed by immuno blot analysis for ABCC1 protein. (E) Cells from (D) were transfected with CT DNA and then 8 hours later cGAMP was quantified in supernatants and cell lysates using ELISA. (F) BMMs were harvested from ALR−/− BMMs mice that were crossed to different ABCC1 genotypes and then evaluated by immuno blot for ABCC1 protein. (G) Cells from (F) were transfected with CT DNA and then 8 hours later cGAMP was quantified in supernatants and cell lysates using ELISA. (H) A549 cells were transduced with lentiCRISPR encoding ABCC1- or H1 control-specific gRNAs as described in (B) and ABCC1 protein expression was evaluated by immuno blot. (I) Cells from (H) were transfected with CT DNA and then 8 hours later cGAMP was quantified in supernatants and cell lysates using ELISA. (J) HFFs were transduced with lentiCRISPR encoding ABCC1- or H1 control-specific gRNAs as described in (B) and ABCC1 protein was assessed by immuno blot. (K) Cells from (J) were transfected with CT DNA and then 8 hours later cGAMP was quantified in supernatants and cell lysates using ELISA. Statistical analysis was performed using a one-way ANOVA comparing targeted lines to relevant controls and corrected for multiple comparisons using the Holm-Sidak method. Error bars represent mean ± SD of three biological replicates per group. *p<0.05, **p<0.01, ***p<0.001. All data shown are derived from a single representative experiment. Comparative results were obtained across two (A-C, F, G) or three (D, E, H-K) independent experiments. See also Figure S2.
Figure 4.
Figure 4.. ABCC1 is an ATP-dependent cGAMP exporter.
(A) HFFs were transduced with lentivirus encoding human WT or K1333M mutant ABCC1 or control (empty vector) and selected for 5 days in hygromycin. Cells were evaluated for ABCC1 protein expression by immuno blot. (B) Cells from (A) were transfected with CT DNA and then 8 hours later cGAMP was quantified in supernatants and cell lysates using ELISA. (C) HeLa cells were transduced with lentivirus encoding murine WT or K1330M mutant ABCC1 or control (empty vector) and selected for 5 days in hygromycin. Cells were evaluated for ABCC1 protein expression by immuno blot. (D) Cells from (C) were transfected with CT DNA and then 8 hours later cGAMP was quantified in supernatants and cell lysates using ELISA. (E) Me275 cells were transduced with lentivirus encoding human or murine WT ABCC1 or control (empty vector) and selected for 5 days in hygromycin. Cells were evaluated for ABCC1 protein expression by immuno blot. (F) Cells from (E) were transfected with CT DNA and then 8 hours later cGAMP was quantified in supernatants and cell lysates using ELISA. Statistical analysis was performed using a one-way ANOVA comparing WT or mutant ABCC1-overexpression cells to empty vector control (B, D, F) and corrected for multiple comparisons using the Holm-Sidak method. Error bars represent mean ± SD of three biological replicates per group. *p<0.05, **p<0.01, ***p<0.001. All data shown are derived from a single representative experiment. Comparative results were obtained across three independent experiments. See also Figure S3.
Figure 5.
Figure 5.. Identification of a conserved mechanism of direct, ATP-dependent cGAMP export
(A) Time course of cGAMP transport using Sf9 cell-derived vesicles expressing human ABCC1 in the presence of ATP or AMP. (B) 5-minute vesicle transport assays using Sf9 insect cell-derived vesicles expressing human ABCC1 or control vesicles with cGAMP in the presence of ATP or AMP, and with or without glutathione (GSH). (C) 20-minute vesicle transport assays using Sf9 insect cell-derived vesicles expressing human ABCC1 or control vesicles with cGAMP in the presence of ATP or AMP, with or without glutathione (GSH), and with or without MK-571 (25 mM). Statistical analysis was performed using one-way ANOVA comparing within time points (A) or comparing the mean of each group to every other group (B, C), and corrected for multiple comparisons using the Holm-Sidak method. Error bars represent the mean ± SD of 3–8 biological replicates per group. *p<0.05, **p<0.01, ***p<0.001. All data shown are derived from a single experiment. Comparative results were obtained across three (A, B) or two (C) independent experiments.
Figure 6.
Figure 6.. cGAMP export controls cell-intrinsic STING signaling.
(A) Quantification of IFNB1 induction by RT-qPCR in HFFs that were treated with 25 μM MK571 or mock followed by transfection with plasmid DNA or RIG-I ligand for 4 or 8 hrs. (B) HFFs were treated with 25 μM MK-571 or mock, and then cGAMP (0–50 μM) was added to the extracellular media. Immuno blot analysis was performed 4 hours after cGAMP addition for phosphorylated STING, STING, and phosphorylated IRF3. (C) HFFs were treated with 25 μM MK-571 or mock, and then cGAMP (0 or 50 μM) was added to the extracellular media. INFB1 induction was quantified by RT-qPCR 4 hours after cGAMP addition. (D) Quantification of IFNB1 induction by RT-qPCR in HFFs overexpressing ABCC1 or empty vector control following transfection with CT DNA. Cells were harvested at the indicated time points. (E) Immuno blot analysis of cells from (D) for ABCC1, phosphorylated STING, and STING protein expression. (F) Quantification of IFNB1 induction by RT-qPCR in ABCC1- or H1 control-targeted HFFs following transfection with CT DNA. Cells were harvested at the indicated time points. (G) Immuno blot analysis of cells from (F) for ABCC1, phosphorylated STING, and STING protein expression. Statistical analysis was performed using a two-way ANOVA comparing mock or MK-571 treatment within each transfected ligand group (A, C) or comparing control to ABCC1-modulated cells within each transfected ligand group (D, F). All tests were corrected for multiple comparisons using the Holm-Sidak method. Error bars represent mean ± SD of three biological replicates per group. *p<0.05, ***p<0.001. All data shown are derived from a single representative experiment. Comparative results were obtained across three independent experiments.
Figure 7.
Figure 7.. ABCC1 deficiency enhances cGAS-dependent autoimmunity in Trex1−/− mice.
(A) Survival of Abcc1−/−Trex1+/+ (n= 33), Abcc1+/+Trex1−/− (n= 31), Abcc1+/−Trex1−/− (n= 21), and Abcc1−/−Trex1−/− (n= 24) mice. (B) Weights of mice at 35 days of age; Abcc1+/+Trex1−/− (n= 8 M, 10 F), Abcc1+/+Trex1−/− (n= 4 M, 7 F), and Abcc1−/−Trex1−/− (n= 6 M, 8 F). (C) Quantification of intracellular cGAMP recovered from heart tissue by ELISA; Cgas−/− (n= 5), WT (n= 7), Abcc1−/−Trex1+/+ (n= 9), Abcc1+/+Trex1−/− (n= 6), Abcc1−/−Trex1−/− (n= 6). Values are normalized to individual heart weights (LOD = limit of detection at 2.3×10¹⁰ molecules/g). (D) Quantification of Cxcl10 protein in serum measured by ELISA of the indicated genotypes; WT (n= 3), Abcc1−/− (n= 8), Abcc1+/+Trex1−/− (n= 12), Abcc1−/−Trex1−/− (n= 12). (E) Quantification of Isg15 mRNA transcripts by RT-qPCR in heart tissue of the indicated genotypes; n= 3 mice per group. (F) Quantification of Ifnb1 mRNA transcripts by RT-qPCR in BMMs of the indicated genotypes; n= 3 or 4 mice per group. (G) Histological score in heart tissue measured at 40 days of age; n= 4 mice per group. (H) Representative (of 4 of each genotype) H&E-stained heart (endocardium and myocardium) and brain at the level of cerebrum (c) with meninges, periosteum, and skull (s) tissue sections from Abcc1−/−Trex1+/+, Abcc1+/+Trex1−/−, and Abcc1−/−Trex1−/− mice. Abcc1+/+Trex1−/− and Abcc1−/−Trex1−/− mice have inflammation extending along the endocardial surface (wide arrows), which appears more pronounced in Abcc1−/−Trex1−/− mice. Abcc1+/+Trex1−/− and Abcc1−/−Trex1−/− mice both have myocardial inflammation (asterisks) with variably severe myocardial degeneration. Abcc1+/+Trex1−/− and Abcc1−/−Trex1−/− mice have perivascular lymphocytic infiltrates (narrow arrows) in the meninges and periosteum of the skull which is variably severe and not present in all mice, but which is generally minimal in the Abcc1+/+Trex1−/− mice. The scale bars in each panel indicate 100 μm. Statistical analysis for the survival curves was calculated with a log-rank (Mantel-Cox) test (A). Statistical analysis for all other experiments was performed using a one-way ANOVA comparing each group to every other group (C, D), comparing transcripts of each gene between genotypes (E, F), or comparing Abcc1−/−Trex1+/+ to Abcc1+/+Trex1−/− and Abcc1−/−Trex1−/− mice in (G). All ANOVA tests were corrected for multiple comparisons using the Holm-Sidak method. Error bars represent mean ± SD. The ROUT method was used to detect potential outliers and no outliers were detected across the data shown. *p<0.05, **p<0.01, ***p<0.001.

Comment in

  • Taking the STING out.
    Kim Y, Pillai A. Kim Y, et al. Sci Immunol. 2022 Nov 11;7(77):eadf5127. doi: 10.1126/sciimmunol.adf5127. Epub 2022 Nov 4. Sci Immunol. 2022. PMID: 36332010

References

    1. Ablasser A, Schmid-Burgk JL, Hemmerling I, Horvath GL, Schmidt T, Latz E, and Hornung V (2013). Cell intrinsic immunity spreads to bystander cells via the intercellular transfer of cGAMP. Nature 503, 530–534. - PMC - PubMed
    1. Allen JD, van Loevezijn A, Lakhai JM, van der Valk M, van Tellingen O, Reid G, Schellens JH, Koomen GJ, and Schinkel AH (2002). Potent and specific inhibition of the breast cancer resistance protein multidrug transporter in vitro and in mouse intestine by a novel analogue of fumitremorgin C. Mol Cancer Ther 1, 417–425. - PubMed
    1. Barrington RD, Needs PW, Williamson G, and Kroon PA (2015). MK571 inhibits phase-2 conjugation of flavonols by Caco-2/TC7 cells, but does not specifically inhibit their apical efflux. Biochem Pharmacol 95, 193–200. - PMC - PubMed
    1. Bridgeman A, Maelfait J, Davenne T, Partridge T, Peng Y, Mayer A, Dong T, Kaever V, Borrow P, and Rehwinkel J (2015). Viruses transfer the antiviral second messenger cGAMP between cells. Science 349, 1228–1232. - PMC - PubMed
    1. Brinkman EK, Chen T, Amendola M, and van Steensel B (2014). Easy quantitative assessment of genome editing by sequence trace decomposition. Nucleic Acids Res 42, e168. - PMC - PubMed

Publication types

MeSH terms

Substances