. 2022 Oct;610(7933):722-730.
doi: 10.1038/s41586-022-05266-z. Epub 2022 Sep 7.

Gut-brain circuits for fat preference

Affiliations

Gut-brain circuits for fat preference

Mengtong Li et al. Nature. 2022 Oct.

Abstract

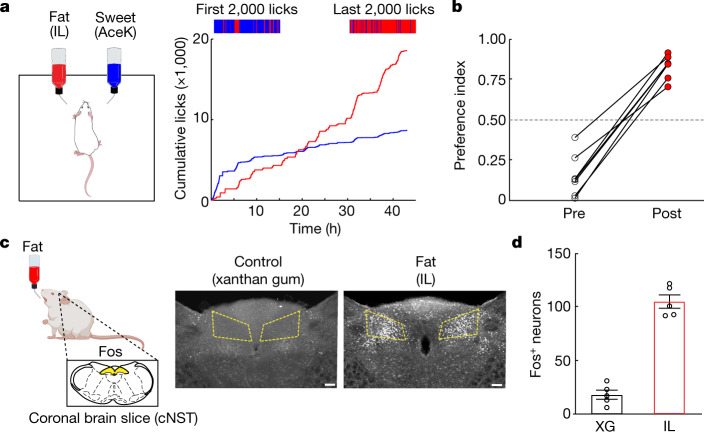
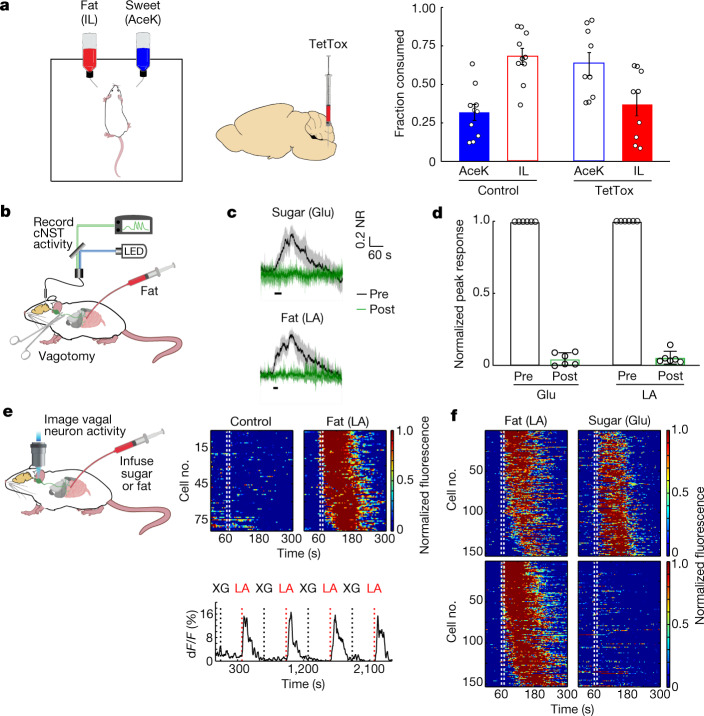
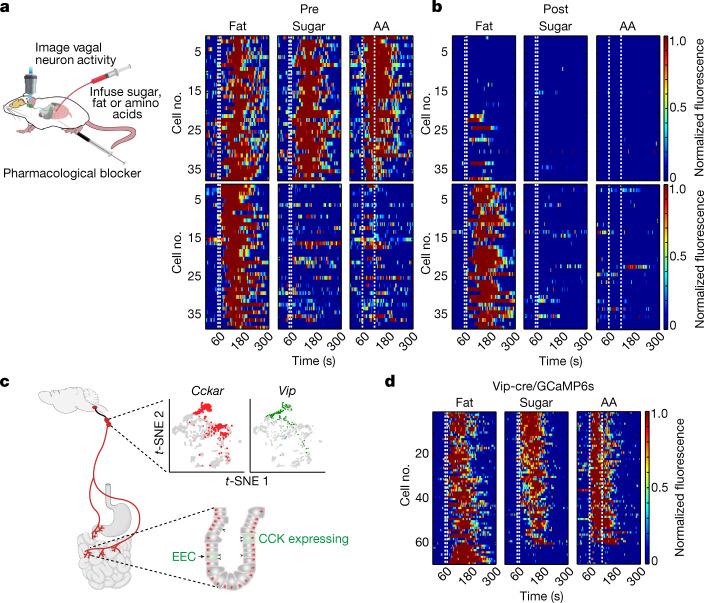
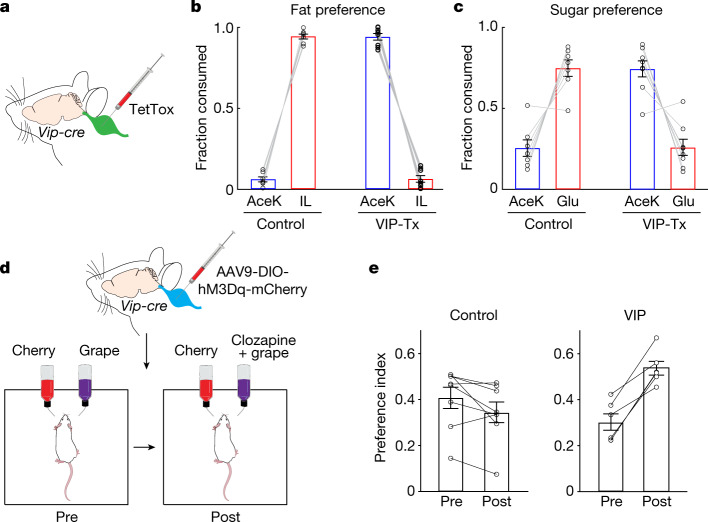
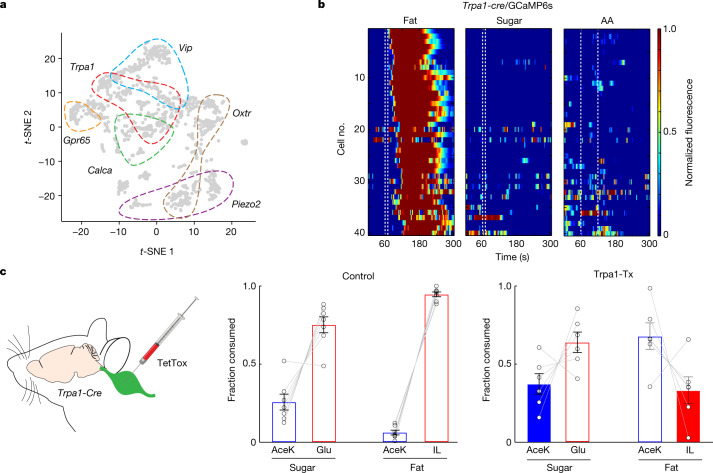
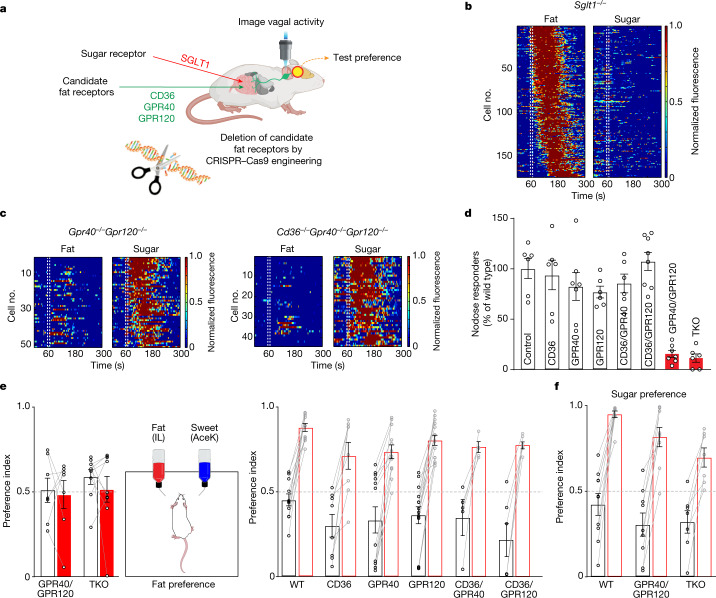
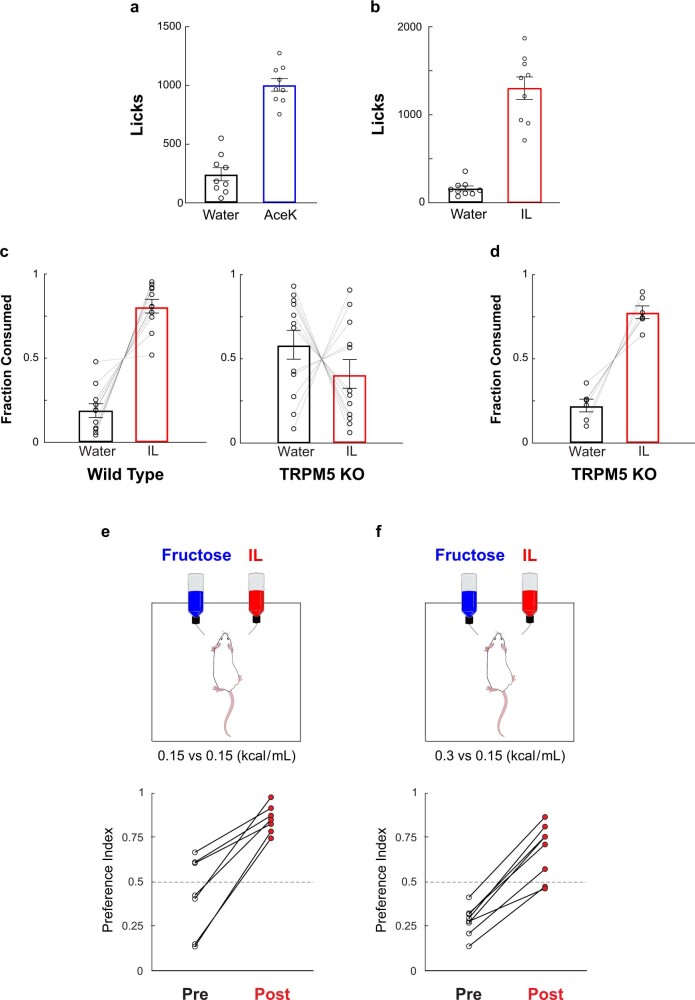
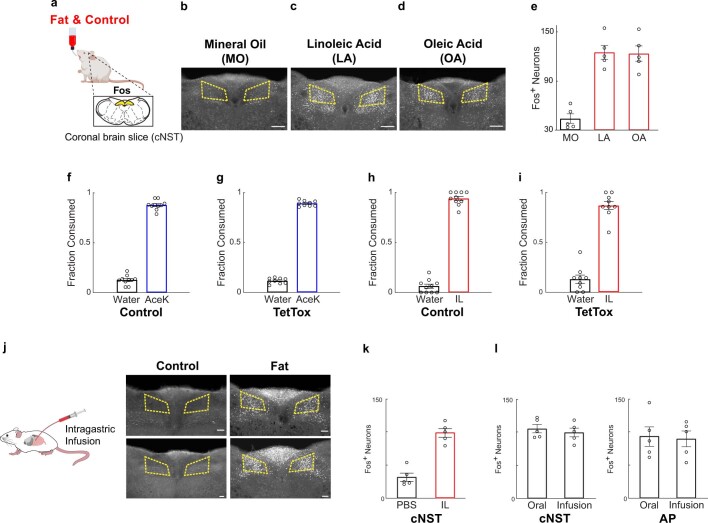
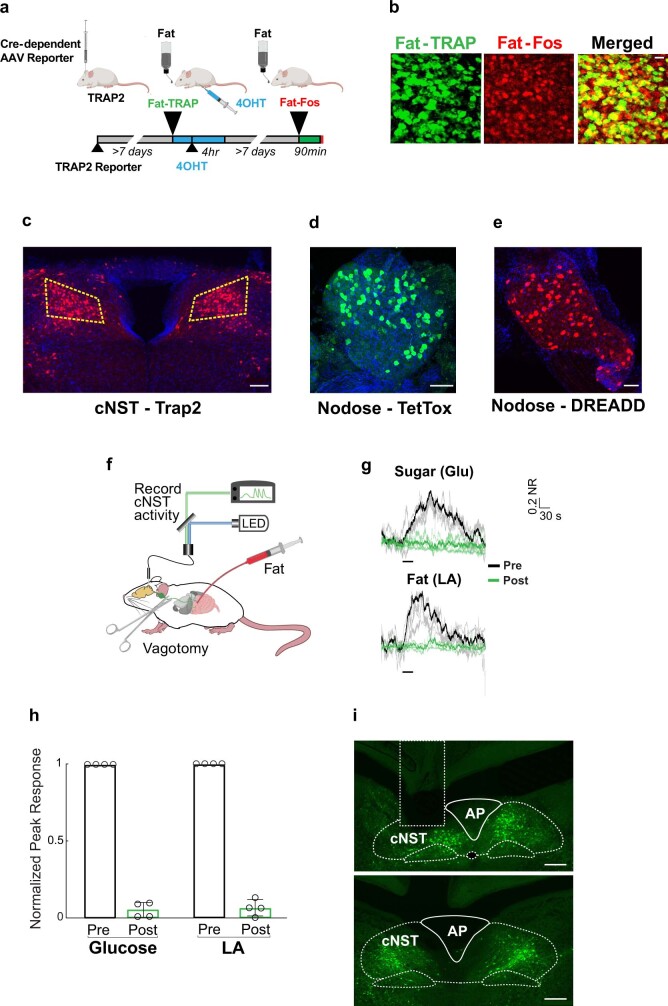
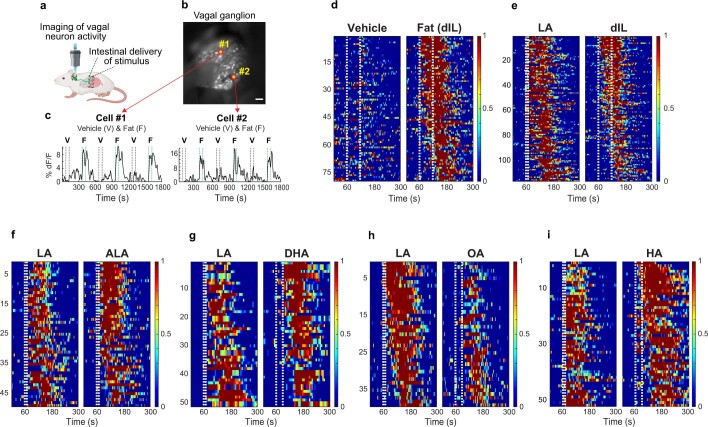
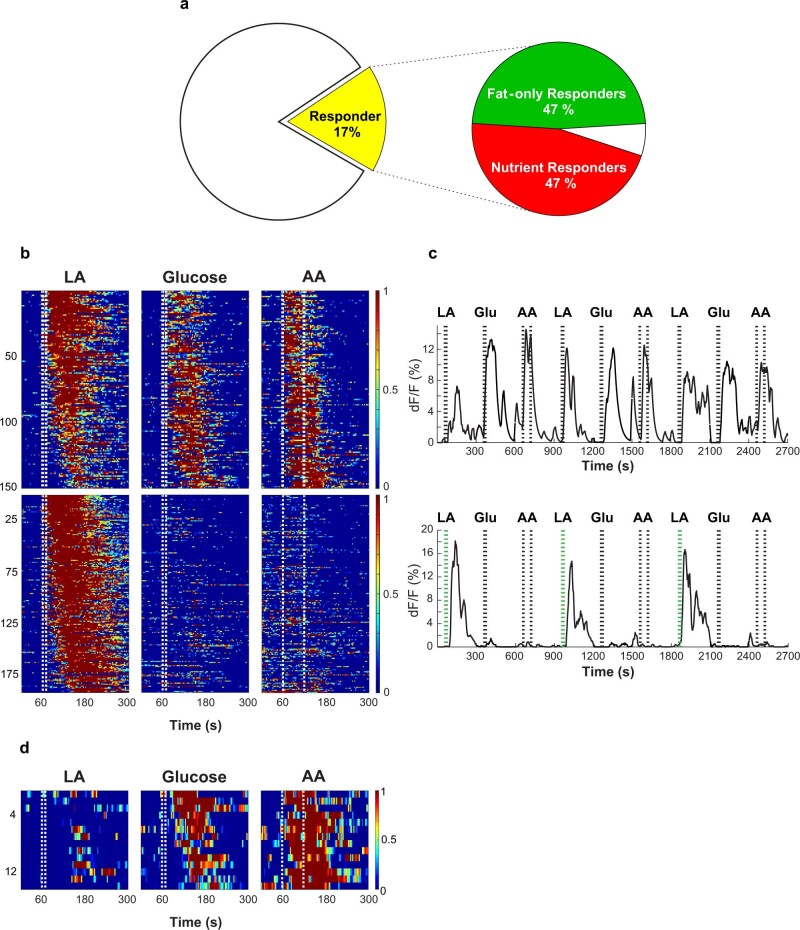
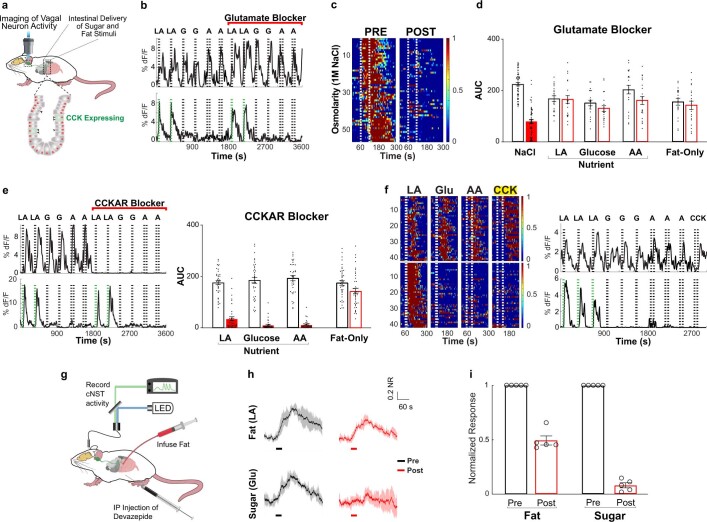
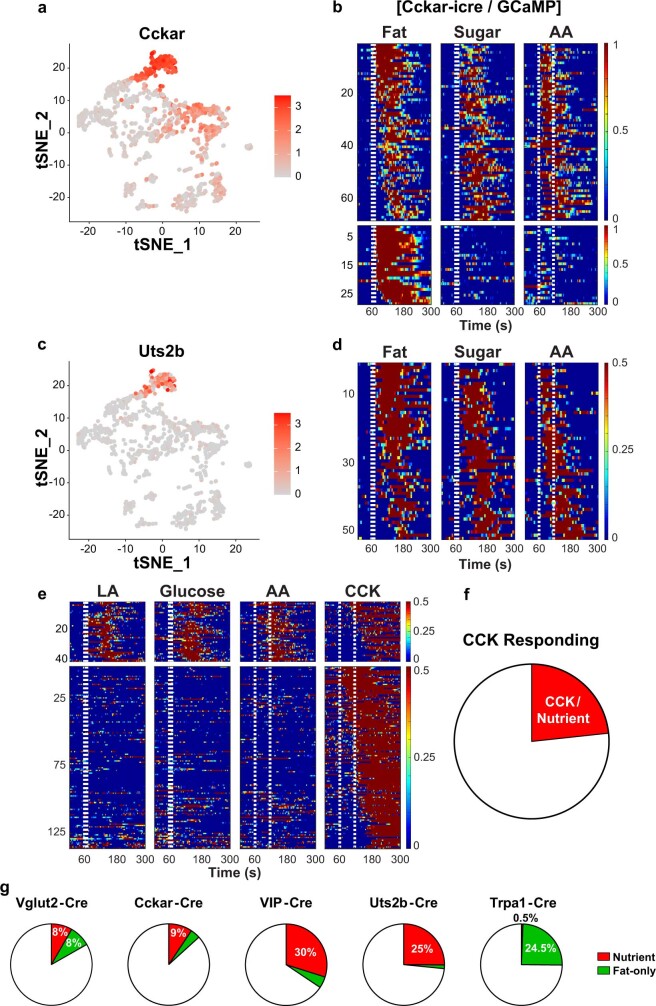
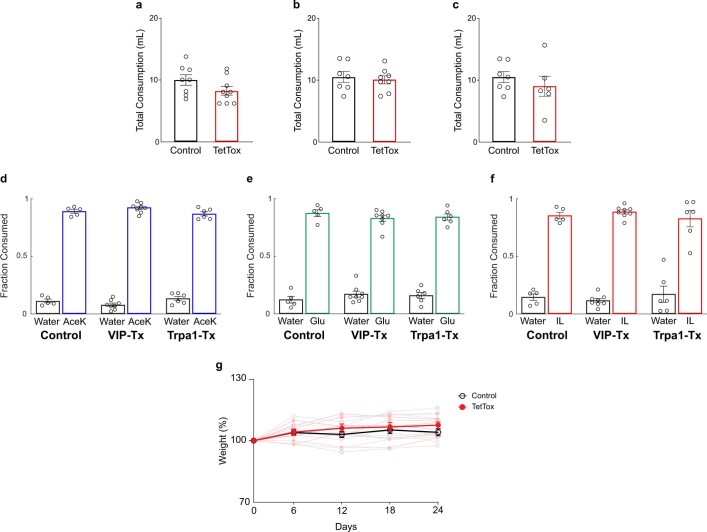
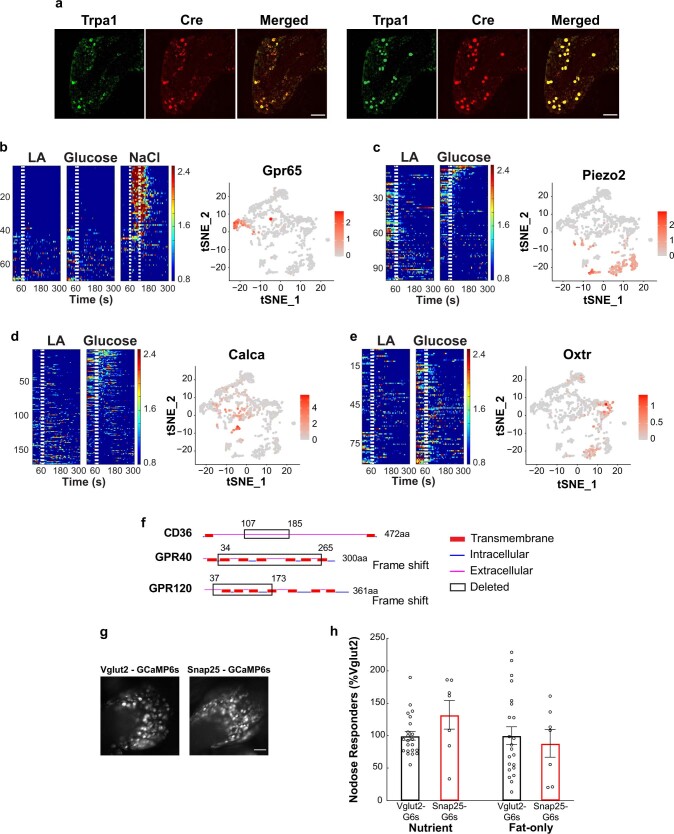
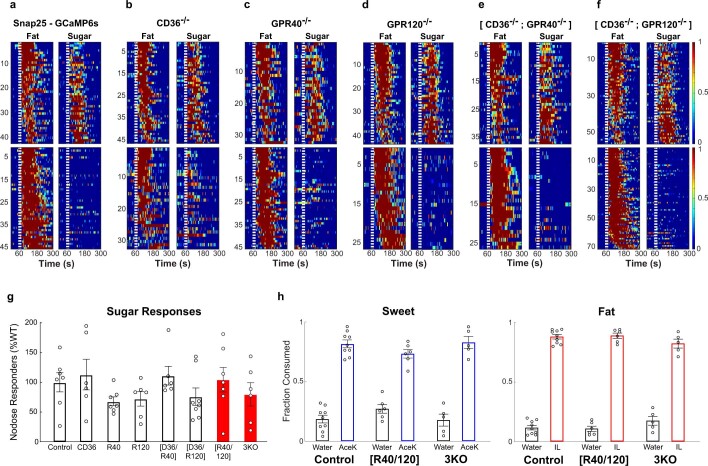
The perception of fat evokes strong appetitive and consummatory responses1. Here we show that fat stimuli can induce behavioural attraction even in the absence of a functional taste system2,3. We demonstrate that fat acts after ingestion via the gut-brain axis to drive preference for fat. Using single-cell data, we identified the vagal neurons responding to intestinal delivery of fat, and showed that genetic silencing of this gut-to-brain circuit abolished the development of fat preference. Next, we compared the gut-to-brain pathways driving preference for fat versus sugar4, and uncovered two parallel systems, one functioning as a general sensor of essential nutrients, responding to intestinal stimulation with sugar, fat and amino acids, whereas the other is activated only by fat stimuli. Finally, we engineered mice lacking candidate receptors to detect the presence of intestinal fat, and validated their role as the mediators of gut-to-brain fat-evoked responses. Together, these findings reveal distinct cells and receptors that use the gut-brain axis as a fundamental conduit for the development of fat preference.


Conflict of interest statement

C.S.Z. is a scientific co-founder and advisor of Kallyope. The other authors declare no competing interests.

Figures

Fig. 1
Fig. 1. The development of fat preference.
a, Left, cartoon illustrating the behavioural arena; mice were allowed to choose between a fat emulsion (1.5% Intralipid (IL)) and an artificial sweetener (3 mM AceK). Preference was tracked by electronic lick counters in each port. Right, cumulative licks for each bottle over the 48 h session. The colour bars at the top show lick rasters for fat (red) and sweet (blue) from the first and last 2,000 licks of the behavioural test. Note that by 24 h the mice begin to drink almost exclusively from the fat bottle (red trace). b, Preference plots for fat versus sweet. In these experiments, mice began the preference test preferring sweet (preference index < 0.5), but in all cases they switched their preference to fat (n = 7 mice, two-tailed paired t-test, P = 1.9 × 10−5) The dashed line indicates the equal preference level (50%). c, Schematic showing stimulation of Fos induction by fat ingestion. Strong Fos labelling is observed in the cNST (highlighted yellow) upon ingestion of 20% IL but not by the control stimulus (0.3% xanthan gum (XG)). Scale bars, 100 µm. d, Quantification of Fos-positive neurons. The equivalent area of the cNST (200 µm × 200 µm; bregma −7.5 mm) was processed, and positive neurons were counted for the different stimuli. Two-sided Mann–Whitney U-test between XG and IL (n = 5 mice), P = 7.9 × 10−3. Data are mean ± s.e.m.
Fig. 2
Fig. 2. Fat preference is mediated by the gut–brain axis.
a, Left, schematic for silencing fat-stimulated cNST neurons. A TetTox virus was targeted bilaterally to the cNST of TRAP2 mice for silencing. Right, the fraction of AceK versus IL consumption after the 48 h preference test, in control (n = 10) versus TetTox mice (n = 9). Two-sided Mann–Whitney U-test for fat, P = 1.4 × 10−3 (total volume consumed: control, 9.9 ± 2.3 ml; TetTox, 8.3 ± 2.1 ml). Control mice developed a strong preference for IL versus sweetener. By contrast, mice in which fat-activated cNST neurons have been silenced do not show a preference for fat over sweetener. Data are mean ± s.e.m. b, Fibre photometry was used to monitor activity in cNST neurons in response to intestinal delivery of fat. c, Neural responses following 10 s intestinal delivery of fat (10% linoleic acid (LA)) or control sugar (500 mM glucose (Glu)). The solid trace is the mean and the shaded area represents s.e.m. Responses after bilateral vagotomy are shown in green. Note total loss of responses following bilateral vagotomy. n = 6 mice. NR, normalized response. d, Quantification of neural responses pre- and post-vagotomy. Two-tailed paired t-test, P = 4.6 × 10−8 (sugar), P = 4.9 × 10−8 (fat). Data are mean ± s.e.m. e, Imaging of calcium responses in vagal neurons as stimuli are delivered to the intestines. Heat maps depict z-score-normalized fluorescence traces from vagal neurons identified as fat responders (n = 84 out of 515 cells from 8 ganglia). Each row represents the average activity of a single cell to four trials. Stimulus window (10 s) is indicated by dotted white lines. Note the strong responses to intestinal delivery of fat (10% LA) but not to control stimuli (0.1% XG plus 0.05% Tween 80). Shown below are sample traces of responses to alternating 10 s pulses of control (XG) and fat stimuli (LA). f, Heat maps depict z-score-normalized responses to interleaved 10 s stimuli of fat (10% LA) and sugar (500 mM Glu). Each row represents the average activity of a different neuron during three exposures to the stimulus. Top, 151 neurons that responded to intestinal application of both fat and glucose. Bottom, a separate pool of 153 neurons that responded only to fat. n = 22 vagal ganglia; 1,813 neurons were imaged.
Fig. 3
Fig. 3. Nutrients engage gut-to-vagal CCK-mediated signalling.
a, Imaging of calcium responses in vagal sensory neurons while delivering fat (10% LA), sugar (500 mM Glu) or amino acid (250 mM amino acid mixture) (AA) stimuli to the intestines (Methods). Heat maps depict z-score-normalized fluorescence traces of sugar/nutrient responders (top) and fat-only responders (bottom) from 641 neurons of 8 mice, before application of CCKAR blocker (pre). The stimulus window (10 s for fat or sugar, 60 s for amino acids) is indicated by dashed white lines. b, To inhibit CCK signalling, we applied devazepide (4 mg kg−1, 200 μl), a CCKAR antagonist (post) (Methods). Top, note that blocking CCKAR receptor activation abolishes sugar-, fat- and amino acid-evoked activity in nearly all the nutrient responders (compare with a, top). Bottom, by contrast, the CCKAR blocker had no effect on the fat-evoked activity in the fat-only responders (compare with a, bottom). See Extended Data Fig. 6 for results using glutamate receptor blockers. c, Cartoon of the gut-to-brain sugar/nutrient-sensing vagal axis. Bottom right, an expanded view of CCK-expressing EECs in the intestines. Top right, two-dimensional t-distributed stochastic neighbour embedding (t-SNE) plot of the transcriptome of mouse vagal nodose neurons. Clusters expressing Cckar are shown in red and clusters expressing Vip are shown in green (Methods). d, Calcium responses in vagal ganglia of mice expressing GCaMP6s in VIP neurons during infusion of fat, sugar or amino acids stimuli into the intestines. Heat maps show z-score-normalized fluorescence traces. Approximately 30% of VIP vagal neurons responded to nutrient stimuli (n = 60 out of 203 neurons from 9 ganglia), but only a small fraction (~4%) responded to fat. Stimuli: 10% LA, 500 mM Glu or 250 mM amino acid mixture.
Fig. 4
Fig. 4. VIP vagal neurons convey sugar/nutrient preference.
a, Silencing VIP neurons in the vagal ganglia by bilateral injection of AAV-DIO-TetTox into the nodose in Vip-cre mice. b,c, Fat and sugar preference tests for control mice and mice with silenced VIP-expressing vagal neurons (Vip-Tx). b, Control mice develop strong preference for fat during a standard 48 h fat-versus-sweetener test (n = 7). By contrast, silencing of VIP vagal neurons abolishes the development of fat preference (n = 8, Vip-Tx mice). Two-sided Mann–Whitney U-test, control versus Vip-Tx fat consumption, P = 3 × 10−4. c, Silencing of VIP vagal neurons also abolishes the development of sugar preference. Control (n = 7) versus silenced mice (n = 8). Two-sided Mann–Whitney U-test, control versus Vip-Tx sugar consumption, P = 6 × 10−4. Data are mean ± s.e.m. d, Strategy for chemogenetic activation of VIP vagal neurons. An excitatory DREADD receptor (via AAV-DIO-hM3Dq) was targeted bilaterally to the nodose of Vip-cre mice. The mice were then tested for their basal preference to cherry or grape flavour (pre). The mice were conditioned and retested using the less-preferred flavour plus the DREADD agonist clozapine (post) (Methods). e, Left, control mice (not expressing DREADD) presented with clozapine (5 mg l−1) in the less-preferred flavour do not switch their preference and maintain their basal, original flavour choice (n = 8 mice; two-tailed paired t-test, P = 0.061). Right, after associating clozapine-mediated activation of VIP vagal neurons with the less-preferred flavour, all the mice expressing DREADD switched their preference (n = 6 mice; two-tailed paired t-test, P = 9.6 × 10−4). Preference index values are mean ± s.e.m.
Fig. 5
Fig. 5. TRPA1 vagal neurons mediate fat-specific preference.
a, Single-cell RNA-seq atlas of nodose ganglia, showing vagal clusters for VIP (blue), Trpa1 (red), Gpr65 (orange), Calca (green), Oxtr (brown) and Piezo2 (purple). b, The vagal cluster expressing TRPA1 (Trpa1-GCaMP6s) responded selectively to intestinal delivery of fat (10% LA), but not sugar (500 mM Glu) or amino acid (250 mM amino acids mixture) stimuli. The heat maps show z-score-normalized fluorescence traces. Of 163 imaged neurons from 5 ganglia, approximately 24% responded to fat. See Extended Data Fig. 9 for imaging results for the other vagal clusters. c, Left, strategy for silencing of TRPA1 neurons in the vagal ganglia by bilateral injection of AAV-DIO-TetTox into the nodose of Trpa1-cre mice. Fat and sugar preference tests on control mice (middle) and mice with silenced TRPA1-expressing vagal neurons (Trpa1-Tx) (right). Control mice develop strong preference for fat and sugar after 48 h (n = 7). By contrast, silencing of TRPA1 vagal neurons abolishes the development of fat but not sugar preference (n = 6, right). Two-sided Mann–Whitney U-test, control versus Trpa1-Tx for sugar, P = 0.23; control versus Trpa1-Tx for fat, P = 1.1 × 10−3. Data are mean ± s.e.m.
Fig. 6
Fig. 6. Intestinal GPR40 and GPR120 fat receptors activate the gut–brain axis.
a, We engineered knockout mice for three candidate fat receptors in the gut, and generated mice with every combination of these knockouts. We then recorded vagal responses to intestinal delivery of fat (10% LA) and sugar (500 mM Glu), and tested them for the development of fat and sugar preference. b, Heat maps depict z-score-normalized fluorescence traces from vagal neurons of SGLT1-knockout mice in response to intestinal delivery of fat (10% LA) and sugar (500 mM Glu). As previously shown, SGLT1 functions as the gut-to-brain sugar receptor, and no vagal neurons responded to sugar in the knockout mice. However, responses to fat were unaffected (n = 174 out of 903 imaged neurons from 10 ganglia). Sglt1 is also known as Slc5a1. c, Heat maps illustrating the selective loss of fat responses in GPR40/GPR120 double-knockout (n = 51 out of 428 imaged neurons from 6 ganglia) and CD36/GPR40/GPR120 triple knockout (n = 44 out of 326 imaged neurons from 6 ganglia) mice. Note the normal responses to intestinal delivery of sugar in these knockout mice. See Extended Data Fig. 10 for imaging results for the other knockout lines. d, Bar graphs comparing vagal neurons responding to intestinal delivery of fat (10% LA) in control mice versus the various receptor knockouts (see Methods). Vagal responses were substantially affected only in the GPR40/GPR120 double-knockout (GPR40/GPR120, n = 7, P = 5 × 10−6) and in the triple knockout (TKO) (n = 6, P = 4 × 10−6) mice. Data are mean ± s.e.m.; statistics are shown in Methods. e, Knockout mice were tested for the development of fat preference. GPR40/GPR120 double knockouts (n = 7 mice, P = 0.81) and CD36/GPR40/GPR120 triple knockouts (n = 9 mice, P = 0.46) did not develop a preference for fat. White bars show initial preference and red bars show preference at the end of the 48 h test. All other combinations of knockouts developed a behavioural preference for fat, similar to control wild-type (WT) mice. Statistics are shown in Methods. Data are mean ± s.e.m. f, As expected, GPR40/GPR120 knockouts still develop preference for sugar. Wild type: n = 10 mice, P = 2.9 × 10−5; GPR40/GPR120: n = 9 mice, P = 8.0 × 10−5; TKO: n = 7 mice, P = 1.9 × 10−3. Data are mean ± s.e.m. Statistics are shown in Methods.
Extended Data Fig. 1
Extended Data Fig. 1. Development of post-ingestive fat preference is independent of immediate attraction to fat and caloric content.
a, b, Immediate attraction to sweet and fat. Graphs of lick counts from brief-access (30 min) two-bottle tests. a, Artificial sweetener (3 mM AceK) versus water, n = 9 mice, two-tailed paired t-test, P = 2x10⁻⁶; b, Fat (1.5% Intralipid, IL) versus water, n = 9 mice, two-tailed paired t-test, P = 2x10⁻⁵. Values are mean ± s.e.m. Note strong innate attraction to sweet and fat stimuli. c, Immediate attraction to fat is abolished in TRPM5 knock-out animals. Shown are results from 30 min two-bottle test of fat (1.5% Intralipid, IL) versus water in wild type mice (left panel, n= 11 mice) versus TRPM5 knockout mice (right panel, n= 12 mice). TRPM5 knock-out animals are blind to the taste of fat. Two-sided Mann–Whitney U-test wild type versus TRPM5 knockout fat consumption: P= 1.6x10⁻³. Note that there is no innate attraction to either bottle, with the animals randomly choosing to consume from either one. d, In contrast, in a 48 h two-bottle fat preference test, TRPM5 KO animals still developed strong post-ingestive preference to fat (n = 6 mice, two-tailed paired t-test, P = 7.4x10⁻⁴). e, Development of fat preference is independent of caloric content. To test the effect of calories, we examined preference between a caloric sugar (fructose) versus fat. Importantly, we used a sugar (fructose) that does not activate SGLT1, and therefore does not trigger post-ingestive preference, thus we can isolate the effect of calories without the confound of having two preference-triggering stimuli (i.e. glucose versus fat). Cartoon on the top illustrates the behavioral arena; mice were allowed to choose between fructose (0.15 kcal/ml) and fat (IL at 0.15 kcal/ml). f, Similar test, but fructose at twice (0.3 kcal/ml) the caloric content of IL. By the end of the 48 h preference test, all the mice switched their preference for fat. e, paired t-test, P = 8x10⁻⁴, n = 7; f, paired t-test, P = 1x10⁻⁵, n = 7. Note that while at the higher fructose concentration (panel f) all of the animals began the test with much stronger attraction to the (sweeter) fructose bottle, all still switched their preference to fat, independent of caloric content.
Extended Data Fig. 2
Extended Data Fig. 2. Fat activates cNST neurons.
a–d, Strong Fos labelling is observed in neurons of the cNST (Bregma −7.5 mm) in response to ingestion of fat stimuli (panels c-d), but not in control animals (10% mineral oil, panel b). Stimulus: 10% linoleic acid (LA), 10% oleic acid (OA). Scale bars, 200 µm. e, Quantification of Fos-positive neurons. ANOVA with Tukey’s HSD test against mineral oil (MO, n = 5 mice): P = 3.4x10⁻⁵ for linoleic acid (LA, n = 5 mice), P = 3.9x10⁻⁵ for oleic acid (OA, n = 5 mice). Values are mean ± s.e.m. f–i, TetTox silencing of fat-TRAP cNST neurons does not impair immediate attraction to sweet (3 mM AceK; f, g) or fat (1.5% IL; h, i). Two-tailed paired t-tests: sweet versus water, wild type, n = 10, P = 1.1x10⁻⁷; TetTox n = 9, P = 1.1x10⁻⁶. For fat versus water, wild type, n = 10, P = 6.8x10⁻⁵; TetTox, n = 9, P = 1.7x10⁻⁵. Values are mean ± s.e.m. j-k, Intragastric infusion with fat activates cNST neurons. j, Direct intragastric infusion of fat (IL) but not control (PBS) robustly activates the cNST. Scale bars, 100 µm. k, Quantification of Fos-positive neurons in animals infused with control and IL stimuli, Two-sided Mann–Whitney U-test between control and Intralipid (n = 5 mice), P = 8x10⁻³. l, We note that we often observe variable labeling in the area postrema (see Fig. 1c and panel jhere), but such labeling is independent of oral versus intragastric infusion. The bar graphs show the quantification of Fos+ neurons in the area postrema (AP) and cNST (Fig. 1d) in response to free licking of IL (90 min) versus intragastric infusion (n = 5 mice). cFos in cNST: oral 105 ± 6, infusion 99 ± 6, cFos in AP: oral 93 ± 15, infusion 90 ± 12. The equivalent area of the cNST (bregma − 7.5 mm) was processed and counted for the different experiments. Two tailed unpaired t-test, cNST: P = 0.54; AP: P = 0.86. Values are mean ± s.e.m.
Extended Data Fig. 3
Extended Data Fig. 3. Quantification of cNST and nodose labeling.
a, Genetic TRAPing of cNST neurons with fat stimuli (see Methods) is efficient and reliable. Note that animals must not be food deprived to prevent labeling unrelated circuits (Methods). We labelled the fat-induced TRAP2 neurons by infection with an AAV carrying a Cre-dependent fluorescent reporter (shown in green), and then performed a second cycle of fat stimulation followed by Fos antibody labelling (shown in red; see Methods). b, By comparing the number of neurons expressing the fluorescent reporter to the number neurons labelled by Fos antibodies, we determined that 90.7 ± 0.6% of Fat-Fos neurons were also TRAPed with the fat stimuli (n = 6). Scale bar, 20 μm. c, For experiments targeting AAV- FLEX-TetTox, or AAV-DIO-mCherry (or GFP) to the cNST we used fat-stimulated TRAP2 animals (see Methods). By comparing the number of neurons expressing AAV after TRAPing and infection, to the number of cNST neurons labeled after crossing similarly TRAped animals to Ai9 reporter mice, we estimate the infection of TRAPed neurons to be >90%: TRAP-AAV: 68 ± 1 neurons; Trap-Ai9: 71 ± 1 neurons (n = 8). Scale bar, 100 μm. The equivalent area of the cNST (bregma − 7.5 mm) was processed and counted for the separate experiments. Values are mean ± s.e.m. d, Shown is a whole mount image of a nodose ganglia from Vip-Cre animals infected with AAV- FLEX-TetTox virus (see Methods). Average number of labeled neurons from Vip-TetTox was 48 ± 13 neurons (n = 4), and the average of nodose neurons labeled with AAV- FLEX-TetTox virus in the Trpa1-Cre animals was 62 ± 23 neurons (n = 6; not shown). These numbers compare favorably (~50%) to the total number of VIP and Trpa1 neurons detected by crossing the Cre animals to reporter Ai9 mice: VIP ~100 neurons; Trpa1 ~120 neurons (data not shown). Scale bar, 100 μm. e, Shown is a whole mount image of nodose ganglia from Vip-Cre animals infected with AAV- DIO-hM3Dq (activator DREADD,). VIP-DREADD labeling efficiency: 43 ± 4% (43 ± 4/100.5), n = 9. Scale bar, 100 μm. f-i, cNST-activation in response to intestinal delivery of fat and sugar is mediated via vagal signaling. AAV carrying a Cre-dependent GCaMP6s was targeted to the cNST of Penk-Cre animals. f, Fiber photometry was used to monitor cNST activity in response to intestinal delivery of sugar and fat stimuli (see also Fig. 2b–d); to minimize any labeling in the AP and ensure the signals originate in cNST neurons, we used AAV targeting of GCaMP6s to the cNST (see panel I below). g, Neural responses following intestinal delivery of fat (10% linoleic acid, LA) or sugar (500 mM glucose, Glu). The light traces denote normalized three-trial averages from individual animals, and the dark trace is the average of all trials. The responses after bilateral vagotomy are shown in green. Black bars below traces indicate the time and duration of stimuli; n = 4 mice. NR, normalized response. Note robust, time-locked responses of cNST neurons to intestinal delivery of fat and sugar. Importantly, responses are abolished after bilateral vagotomy. h, Quantification of neural responses before and after vagotomy. Two-tailed paired t-test, P = 3.8x10⁻⁵ (sugar), P = 5x10⁻⁵ (fat). Data are mean ± s.e.m. i, Sample brains of two different injected animals demonstrating expression of GCaMP6s restricted to the cNST, with minimal expression in the AP; the top brain also demarks the location of the recording fiber (dashed rectangle). Scale bars, 200 μm.
Extended Data Fig. 4
Extended Data Fig. 4. Various dietary fatty acids activate vagal neurons.
a-b, Schematic of vagal calcium imaging while simultaneously delivering stimuli into the intestines (see Methods for details). The picture shows a representative view of a vagal nodose ganglion of Vglut-Cre; Ai96 in an imaging session. Two fat responders (denoted #1 and #2) are highlighted, and their responses shown in panel c. c, Sample traces of vagal responses to intestinal stimulation with alternating pulses of vehicle or fat (pre-digested IL; see Methods for details). Note time-locked, reliable responses to fat, but not to vehicle control. Stimulus window (60 s) is marked by dotted white lines. Note that since IL is a complex mix, it must be pre-digested in vitro by incubation with lipases prior to using in imaging experiments (versus ingestion, where endogenous lipases in the stomach naturally digest IL). d, Heat maps depict z-score-normalized fluorescence traces from vagal neurons that responded to pre-digested (dIL, n = 79/463 neurons from 8 ganglia). Each row represents the average activity of a single cell to three trials. Stimulus window is shown by dotted white lines. e–i, Responses of vagal neurons to intestinal delivery of a range of fatty acids. e, Heat maps show z-score-normalized fluorescence traces of vagal neurons to intestinal delivery of 10% LA (10 s) and digested Intralipid (dIL); n = 116/634 neurons from 7 ganglia; note that the same neurons responded to both stimuli. f, 10% LA (10 s) and 10% alpha-linolenic acid (ALA), n = 49/322 neurons from 3 ganglia; g, 10% LA (10 s) and 10% docosahexaenoic acid (DHA), n = 51/348 neurons from 5 ganglia; h, 10% LA (10 s) and 10% oleic acid (OA), n = 39/418 neurons from 6 ganglia; i, 10% LA (10 s) and 10% hexanoic acid (HA), n = 52/495 neurons from 6 ganglia.
Extended Data Fig. 5
Extended Data Fig. 5. Distinct populations of vagal neurons respond to intestinal delivery of nutrients and fat.
a, Pie chart illustrating the fraction of fat and sugar responders in the nodose ganglia of Vglut2-GCaMP6s animals. The data is from 1813 neurons from 22 ganglia (red, n = 323 cells, 17%). Right, within the responding neurons, 151 (47%) responded to both sugar and fat (“nutrient responders”), while 153 (47%) responded only to fat but not to sugar stimuli (“fat-only responders”). b, Sugar/nutrient versus fat-only vagal neurons: Heat maps depicting z-score-normalized vagal responses to intestinal delivery of fat (10% linoleic acid, LA), sugar (500 mM glucose) and amino acids (250 mM amino acid mixture, AA; see Methods). Each row represents the average activity of a single cell to 3 trials. Stimulus window is shown by dotted white lines. Upper panels show 150 neurons that responded to intestinal application of sugar, fat and amino acids (“sugar/nutrient responders”); bottom panels show 192 neurons that responded only to fat. n = 22 ganglia, 1884 imaged neurons. c, Representative traces from a “sugar/nutrient responder” (top) and a “fat-only responder” (bottom). Shown are responses to intestinal stimulation with 9 interleaved pulses of fat (10% LA, 10 s, green dotted line), sugar (500 mM Glu, 10 s) and amino acids (250 mM AA, 60 s). d, Heat maps of the small subset of vagal neurons that responded to sugar and amino acids but not to fat (n = 14/1884 neurons from 22 nodose ganglia). On average, less than 1 neuron was detected per ganglia. We note that when using high concentrations of glucose stimuli (>250 mM) for long stimulation times (60 s) one can detect strong vagal responses, but these have been shown not to be sugar-preference responses,.
Extended Data Fig. 6
Extended Data Fig. 6. CCK signalling not glutamate mediates sugar/nutrient responses.
a, Cartoon of vagal calcium imaging while simultaneously delivering sugar and fat stimuli into the intestines. The bottom inset illustrates CCK-expressing enteroendocrine cells (EECs) in the intestines. b, A recent study reported that the gut-to-vagal sugar preference signal is carried by glutamate as a transmitter. However, this conclusion was based on three indirect assays and measurements. First, the use of in vitro organoids with dissociated vagal neurons, where all native connectivity between potential EECs and vagal neurons is lost. Second, by using whole nerve recordings from thousands of random vagal fibres, which do not afford the identification of the functionally relevant vagal signal (i.e. recognizing the sugar-preference signals from any other activity). Third, by using very long sugar stimuli (1 min) under conditions known to activate large populations of vagal neurons that mask the response of sugar/nutrient preference neurons,, (note also that the whole vagal nerve responses, unlike sugar/nutrient responses, never decayed after termination of the sugar stimulus). Consequently, we directly examined the role of glutamate signalling by imaging the responses of the relevant sugar-preference vagal neurons to intestinal sugar stimuli before and after addition of a mixture of AP3 and KA glutamate receptor antagonists. Indeed, our results demonstrated that pharmacological inhibition of glutamate-based signalling has no effect on this gut-to-vagal sugar/nutrient sensing circuit. Shown are representative traces of vagal neuron responses to intestinal infusions of fat, sugar and amino acids before and after treatment with ionotropic/metabotropic glutamate receptor antagonists (2 mg/kg AP3 with 300 μg/kg kynurenic acid, see Methods). Top traces show sugar/fat/amino acid responding vagal neurons, bottom traces show fat-only responders. c, In contrast, pharmacological inhibition of glutamate-based signalling abolished all osmolarity responses. Heat maps depicting z-score-normalized vagal responses to intestinal osmolarity stimuli (60 s of 1 M NaCl),, before and after treatment with ionotropic/metabotropic glutamate receptor antagonists (2 mg/kg AP3 with 300 μg/kg kynurenic acid). d, Quantification of the responses to 1 M NaCl, 10% LA, 500 mM Glucose, and 250 mM AA mixture before (black bars) and after blockers (red bars). 1 M NaCl, n = 56 neurons, P = 1x10⁻¹⁰. For nutrient responders: LA, n = 21, P = 0.16; Glucose, n = 21, P = 0.85; AA, n = 21, P = 0.07. For fat-only responders, n = 19, P = 0.54 by two-tailed paired t-tests. All values are mean ± s.e.m. AUC: average area under curve (see Methods). e, Left, Representative traces of vagal neuron responses to intestinal infusions of fat, sugar and amino acids before and after treatment with cholecystokinin A receptor (CCKAR) blocker (4 mg/kg devazepide, see Methods). Note robust, reliable responses to fat (10% LA) and sugar (500 mM Glucose) prior to addition of CCKAR antagonist. However, all responses are loss after addition of antagonist (top panel). By contrast, fat-only responses are unaffected (bottom panel). Right panel, quantification of responses before (open bars) and after (red bars) CCKAR antagonist (data from Fig. 3a, b). For nutrient responders: LA, n = 37 neurons, P = 1x10⁻⁹; Glucose, n = 37, P = 1x10⁻⁹; AA, n = 37, P = 1x10⁻⁹. For fat-only responders, n = 38, P = 0.11 by two-tailed paired t-tests. All values are mean ± s.e.m. f, Sugar/nutrient but not fat-only responders utilise CCK signalling. Left, Heat maps depicting z-score-normalized fluorescence traces from vagal neurons identified as sugar/nutrient responders (upper panels, n = 41 neurons); note responses to sugar, fat and amino acid stimuli. The lower heat-map shows the fat-only neurons (n = 41 neurons). After stimulating with CCK (1 μg/ml), all sugar/nutrient responders were activated, but not the fat-only vagal neurons. Right, Representative traces of 2 sample neurons to pulses of 10% linoleic acid (LA), 500 mM glucose (G), 250 mM amino acids (A), and CCK. Stimulus windows are indicated by dotted lines. g-h, CCK-dependent (sugar and fat) and CCK-independent (fat-only) intestinal gut-to-brain fat-preference pathways co-contribute to fat signals in the cNST. Shown are photometric recordings of cNST neurons in Penk-Cre animals in response to intestinal fat-evoked activation of both fat-stimulated vagal pathways (black traces and bars). Shown in red are the same responses after inhibiting signaling via the CCK-dependent vagal pathway (see panel a- f). i, cNST responses to intestinal fat stimulation are reduced to ~50% after removing CCK-dependent signaling, demonstrating the separate contributions of the two fat-preference circuits. As expected, sugar-evoked responses are completely abolished after inhibiting signaling via the CCK-dependent pathway. n = 5, P = 2.4x10⁻⁶ by two-tailed paired t-test. All values are mean ± s.e.m. See text and methods for details. We note that in gain-of-function experiments, with DREADD being overexpressed in vagal neurons, activation of a single pathway is sufficient to create new preferences (see for example Fig. 4).
Extended Data Fig. 7
Extended Data Fig. 7. Sugar/fat/amino acid sensing vagal neurons.
a, Shown is a tSNE plot of the transcriptome of mouse vagal nodose neurons (original data set taken from reference); CCKAR expression is represented on a grey-to-red scale. b, CCKAR-expressing neurons respond to intestinal stimulation with nutrients. An engineered Cckar-iCre was used to drive GCaMP6s expression in CCKAR vagal neurons (see Methods). We analysed 724 imaged neurons from 12 ganglia. Shown are heat maps depicting z-score-normalized fluorescence traces of the CCKAR-expressing neurons responding to intestinal delivery of fat (10 % linoleic acid), sugar (500 mM glucose) or amino acids (250 mM amino acid mixture). Stimulus window is shown by dotted white lines. c-d, tSNE plot of the transcriptome of mouse vagal nodose neurons; urotensin 2B (Uts2b) expression is represented on a grey-to-red scale. d, Shown are responses of vagal Uts2b-expressing neurons (Uts2b-GCaMP6s) to intestinal delivery of fat (10 % linoleic acid), sugar (500 mM glucose) or amino acids (250 mM amino acid mixture). The heat maps depict z-score-normalised fluorescence traces of sugar/nutrient responders (n = 52/207 neurons from 7 ganglia). Stimulus window is shown by dotted white lines. Note that only 3 of the 52 neurons responded only to fat (shown at the top of the heat maps). e, Sugar/nutrient responders are a unique subset of CCKAR-expressing vagal neurons. Heat maps showing z-score-normalized fluorescence traces from vagal neurons that respond to CCK and nutrient stimuli (see Extended Data Fig. 6f). While all of the neurons that responded to intestinal stimulation with sugar, fat and amino acids (i.e. the sugar/nutrient sensors) also responded to CCK, the vast majority of vagal neurons that respond to CCK do not respond to nutrient stimuli (bottom heat maps, n = 136 neurons). This is expected since only a small fraction would be mediating sugar/nutrient preference, versus other roles of CCK signaling. Stimuli: 10% linoleic acid (LA), 10 s; 500 mM glucose, 10 s; 250 mM amino acids (AA), 60 s; 1 μg/ml CCK, 60 s. f, the pie chart is based on data from 12 ganglia. Since vagal neurons that only respond to fat stimuli are not activated by CCK, they are not part of this analysis (see Extended Data Fig. 6f, bottom panels). g, Pie charts depicting the fraction of sugar/nutrient (red) and fat-only (green) responders in animals driving GCaMP6s reporter from various driver lines: Vglut2-Cre, Cckar-Cre, Vip-Cre, Uts2b-Cre, and Trpa1-Cre animals. VIP/Uts2b define the sugar/nutrient responders while TrpA1 mark the fat-only responders.
Extended Data Fig. 8
Extended Data Fig. 8. Drinking and eating in Tet-Tox silenced animals.
a, Shown are graphs for consumption (AceK and IL) in two-bottle 48 h preference assay for control and cNST-silenced animals (n ≥ 8 mice), P = 0.151 (from Fig. 2a). b, Consumption in two-bottle 48 h preference assay for control and Vip-silenced mice (n ≥ 7 mice), P = 0.69 (from Fig. 4b). c, Consumption in two-bottle 48 h preference assay for control and Trpa1-silenced mice (n ≥ 6 mice), P = 0.44 (from Fig. 5c). Values are mean ± s.e.m. d–f, Animals with genetically silenced sugar/nutrient preference vagal neurons (VIP), or fat-only vagal neurons (Trpa1) still exhibit normal innate attraction to sweetener (d), sugar (e), and fat stimuli (f). Shown are graphs for 30 min two-bottle tests for control mice, and for mice with silenced VIP-expressing vagal neurons (VIP-Tx) and mice with silenced Trpa1-expressing vagal neurons (Trpa1-Tx). d, AceK versus water in VIP-Tx (n = 8) and Trpa1-Tx (n = 6) animals is not significantly different from controls. ANOVA with Tukey’s test: VIP-Tx, P = 0.36, Trpa1-Tx, P = 0.66. e, Glucose versus water in VIP-Tx (n = 8) and TrpA1-Tx (n = 6) is not significantly different from control animals. ANOVA with Tukey’s test: VIP-Tx, P = 0.45, Trpa1-Tx, P = 0.67. f, IL versus water in VIP-Tx (n = 8) and TrpA1-Tx (n = 6) is not significantly different from control animals. ANOVA with Tukey’s test: VIP-Tx, P = 0.87, Trpa1-Tx, P = 0.91. Values are mean ± s.e.m. Tastants: AceK (3 mM), Glucose (200 mM), IL (1.5%). g, The graph shows body weight measurements from Vip-Cre animals injected with AAV-Flex-TetTox in both nodose ganglia, from the time the animals were infected until the time behavioral preference tests were performed (days 24–26.); data is presented as percent change, with weight at time zero defined as 100%. Thin lines represent individual animals; dark lines represent the average body weight of TetTox (n = 7 mice, red) and control (n = 10 mice, black) animals. No significant differences were detected, two-way ANOVA, P = 0.37.
Extended Data Fig. 9
Extended Data Fig. 9. Gpr65, Piezo2, Calca, and Oxtr vagal neurons do not sense fat or sugar.
a, Validation of Trpa1-Cre mice. Double In situ hybridization labeling for the endogenous Trpa1 gene (green) and for Cre-recombinase (red) in the nodose of Trpa1-Cre knock-in mice (see Methods). Shown is a frozen section demonstrating the strong overlap (n = 3 mice). The left 3 panels show the in-situ results, and the right 3 panels show an illustration of the labeling results. Scale bars, 100 μm. b–e, The panels show tSNE plots of the nodose transcriptome highlighting the 4 clusters, and heat maps of responses to intestinal delivery of fat and sugar from various vagal clusters using the corresponding Cre driver lines. a, GPR65 vagal neurons are known to indiscriminately respond to a wide range of long stimuli at high concentrations, including salt, fructose, mannose, and glucose, and considered osmolarity responders,,. The heat maps show z-score-normalized fluorescence traces from all imaged vagal neurons in response to intestinal infusions of fat (10% linoleic acid, LA, 10 s), sugar (500 mM glucose, 10 s) or high osmolarity salt (1 M NaCl) for 60s in Gpr65-Cre;Ai96 animals. Each row represents the average activity of a single cell to three trials. Stimulus window is shown by dotted white lines. n = 69 neurons from 3 ganglia. c–e, Calcium imaging of vagal responses in Piezo2-Cre;Ai96, Calca-Cre;Ai96, and Oxtr-Cre;Ai96 animals. The heat maps showing z-score-normalized fluorescence traces of all imaged neurons in response to intestinal infusion of fat or sugar. c, Piezo2: n = 99 neurons from 4 ganglia; d, Calca: n = 168 neurons from 5 ganglia; e, Oxtr: n = 89 neurons from 6 ganglia. No significant responses were detected for any of the lines. f, Generation of fat receptor knockouts. Schematic illustrating the structural domains of the murine wild type CD36, GPR40, and GPR120 protein sequences, with the deletions denoted by the black boxes. For CD36 KO, we engineered a 626 nucleotide (nt) deletion removing residues 107 to 185, which forms part of the hydrophobic binding pocket of CD36. For GPR40 KO, we engineered a 695 nt deletion that removed more than 75% of the protein. For GPR120, we introduced a 412 nt deletion removing 136 residues, and introducing a nonsense frameshift disrupting functional translation of the remaining two-thirds of the protein. See Methods for details. g, Representative views of GCaMP6s expressing neurons in vagal nodose imaging sessions using Vglut2-Cre; Ai96 animals (left) or Snap25-GCaMP6s animals (right). Scale bar, 100 µm. Similar results were obtained from multiple animals. h, Comparisons of the fraction of sugar/nutrient responders (left) or fat-only responders (right), between Vglut2-Cre; Ai96 (Vglut2-G6s, black, n = 22 ganglia) and Snap25-GCaMP6s animals (Snap25-G6s, red, n = 7 ganglia). No significant differences were found in vagal responses to intestinal delivery of fat or sugar between the Vglut2-G6s and Snap25-G6s genetic drivers (Two-sided Mann–Whitney U-test, P = 0.29 for sugar/nutrient responders, P = 0.83 for fat-only responders). All values are mean ± s.e.m.
Extended Data Fig. 10
Extended Data Fig. 10. Functional imaging of vagal responses in fat receptor knockouts.
a-f, Functional imaging of vagal neurons in response to intestinal delivery of fat (10% linoleic acid) and sugar (500 mM glucose) in Snap25-GCaMP6s mice harbouring various combinations of fat receptor deletions (see text for details). Heat maps show sugar/nutrient responders (top panels), and fat-only responders (bottom panels). a, control (n = 7 ganglia); b, CD36 KO (n = 6 ganglia); c, GPR40 KO (n = 7 ganglia); d, GPR120 KO (n = 6 ganglia); e, CD36 & GPR40 double KO (n = 6 ganglia); f, CD36 & GPR120 double KO (n = 8 ganglia). See Fig. 6c for GPR40 & GPR120 double KO and triple KO heat maps. g, Comparison of vagal responses to intestinal sugar stimuli in all fat receptor knockouts (see Fig. 6 for fat responses). ANOVA with Tukey’s HSD test to WT (n = 7): CD36 KO (n = 6 mice), P = 0.99; GPR40 KO (R40, n = 7 mice), P = 0.87; GPR120 KO (R120, n = 6 mice), P = 0.94; CD36/GPR40 double KO (CD36/R40, n = 6 mice), P = 0.99; CD36/GPR120 double KO, (CD36/R120, n = 8 mice), P = 0.96; GPR40/GPR120 double KO (R40/120, n = 7 mice), P = 0.99; CD36/GPR40/GPR120 triple KO (3KO, n = 6 mice), P = 0.99. Values are mean ± s.e.m. h, Fat receptor knockout animals that cannot transmit the gut-brain signal (GPR40/GPR120 double knockouts, and the triple knockout) still exhibit normal innate attraction to fat stimuli. Shown are brief-access (30 min) two-bottle tests for artificial sweetener (3 mM AceK) versus water (left panel), and fat (1.5% Intralipid, IL) versus water (right panel). ANOVA with Tukey’s test compared to wild type sweet consumption (n = 9): GPR40/GPR120 double KO (R40/R120): n = 6, P = 0.96; CD36/GPR40/GPR120 triple KO (D36/R40/R120): n = 5, P = 0.26. ANOVA with Tukey’s test compared to wild type fat consumption, R40/R120: n = 6, P = 0.25; n = 5, D36/R40/R120: P = 0.98. Two-tailed paired t-test. Values are mean ± s.e.m.

Comment in

  • Gut-brain axis key to fat preference.
    Ray K. Ray K. Nat Rev Gastroenterol Hepatol. 2022 Nov;19(11):687. doi: 10.1038/s41575-022-00693-9. Nat Rev Gastroenterol Hepatol. 2022. PMID: 36168048 No abstract available.

References

    1. Berthoud HR, Morrison CD, Ackroff K, Sclafani A. Learning of food preferences: mechanisms and implications for obesity & metabolic diseases. Int. J. Obes. 2021;45:2156–2168. - PMC - PubMed
    1. Zhang Y, et al. Coding of sweet, bitter, and umami tastes: different receptor cells sharing similar signaling pathways. Cell. 2003;112:293–301. - PubMed
    1. Sclafani A, Ackroff K. Fat preference deficits and experience-induced recovery in global taste-deficient Trpm5 and Calhm1 knockout mice. Physiol. Behav. 2022;246:113695. - PMC - PubMed
    1. Tan HE, et al. The gut–brain axis mediates sugar preference. Nature. 2020;580:511–516. - PMC - PubMed
    1. Food Balances (2010–)https://www.fao.org/faostat/en/#data/FBS (Food and Agriculture Organization of the United Nations, 2020).

Publication types