. 2022 Oct;610(7933):752-760.
doi: 10.1038/s41586-022-05309-5. Epub 2022 Sep 7.

Novel antigen-presenting cell imparts Treg-dependent tolerance to gut microbiota

Affiliations

Novel antigen-presenting cell imparts Treg-dependent tolerance to gut microbiota

Blossom Akagbosu et al. Nature. 2022 Oct.

Abstract

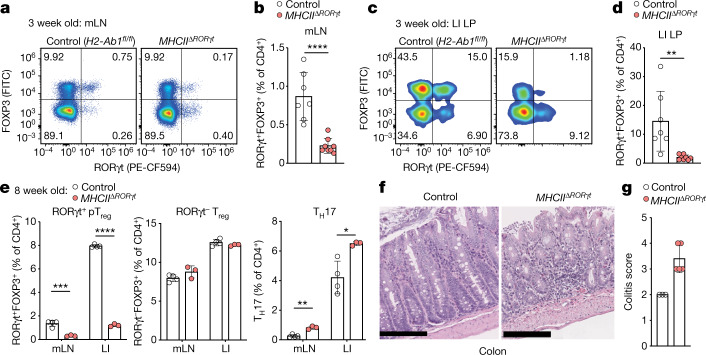
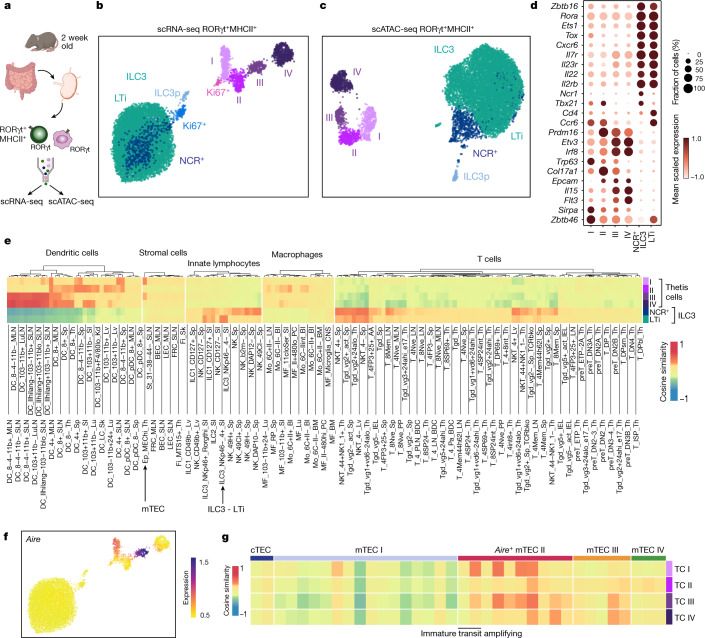
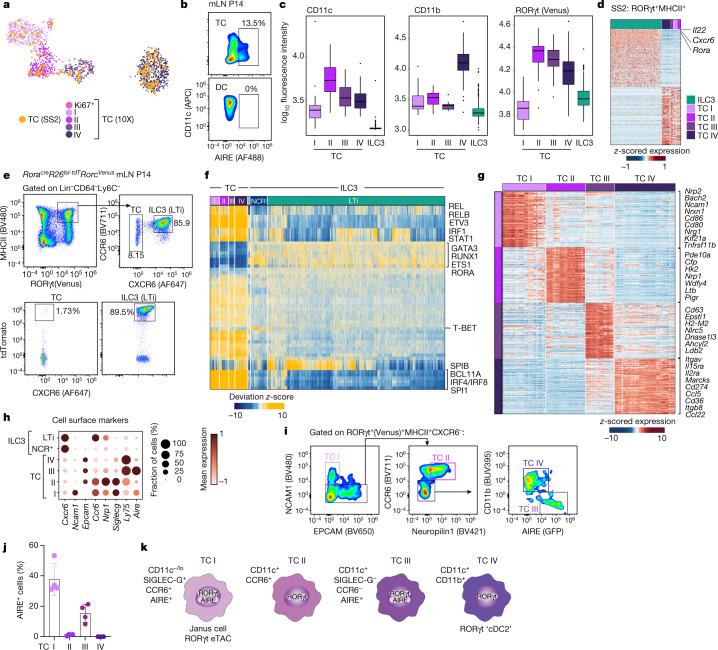
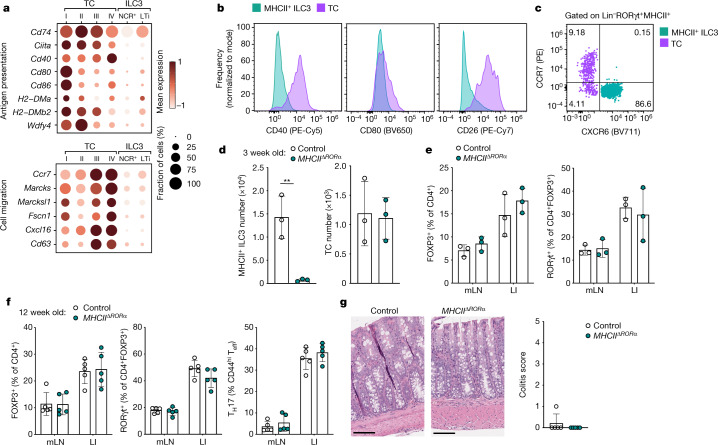
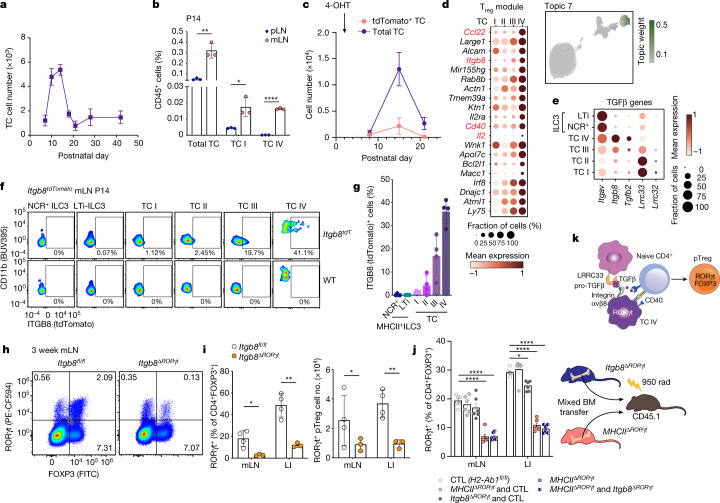
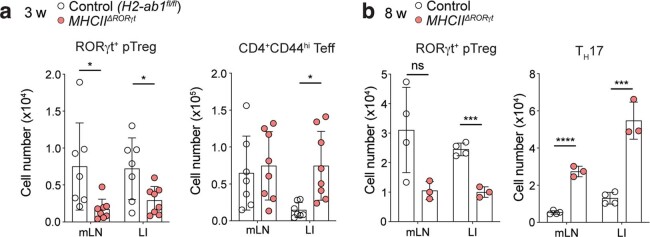
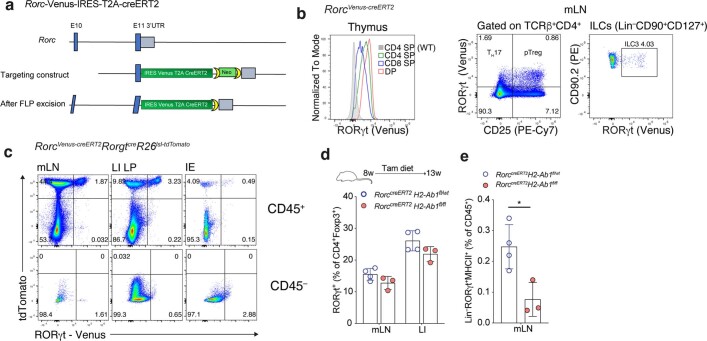
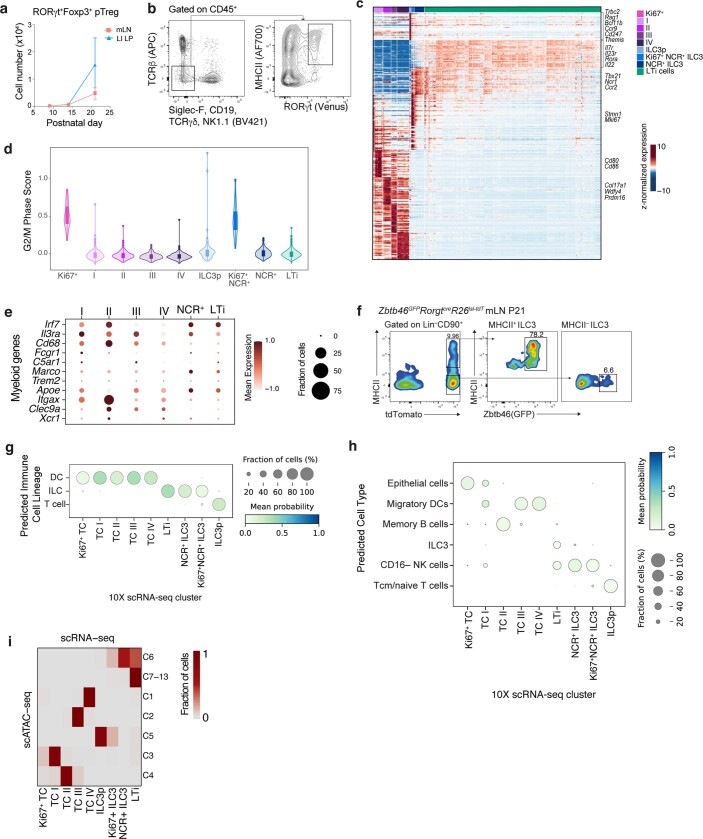
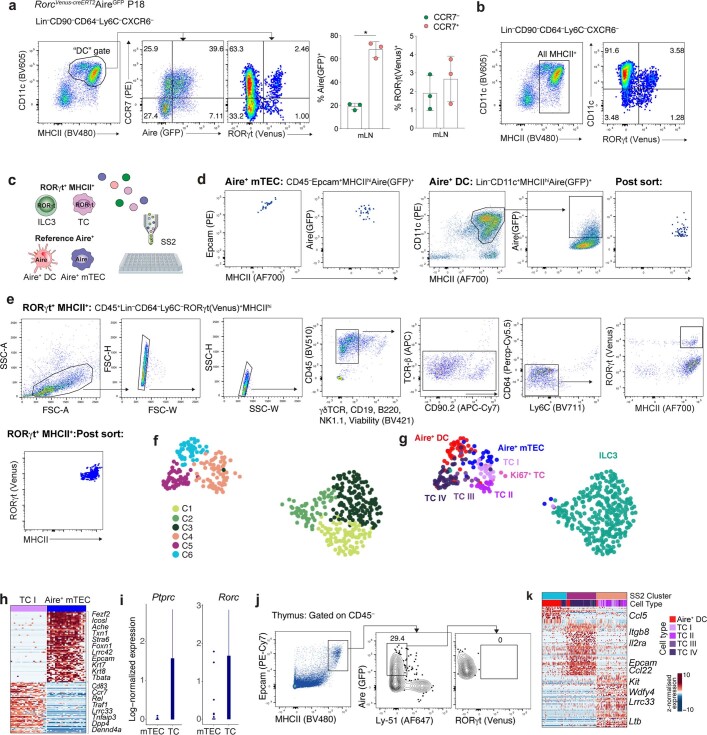
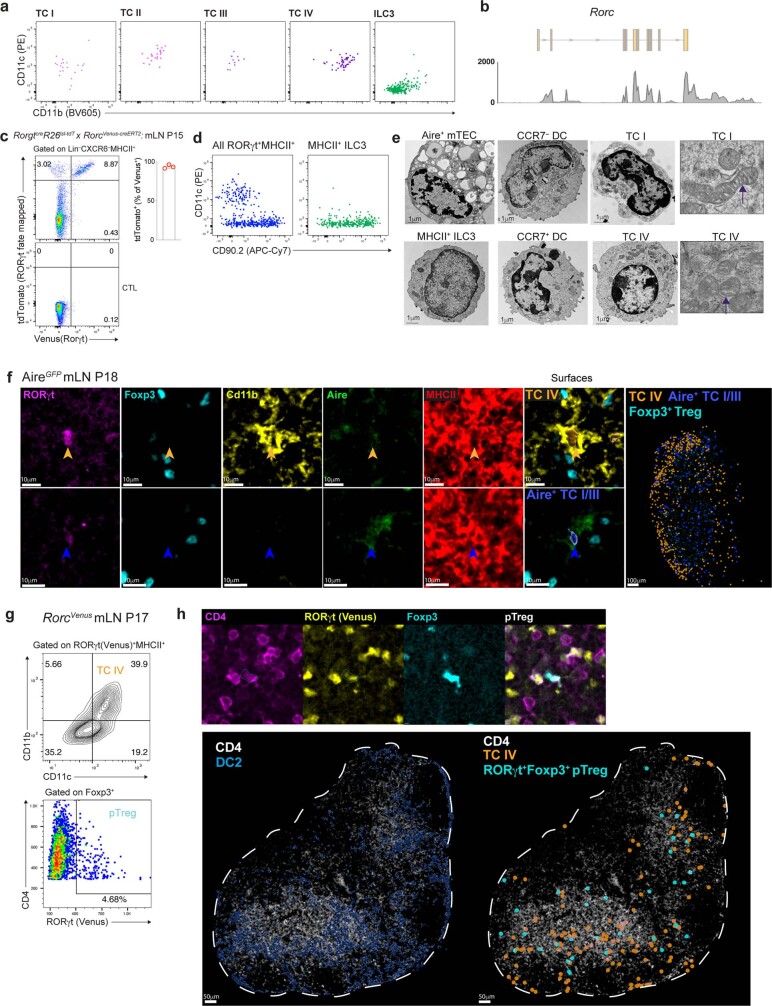
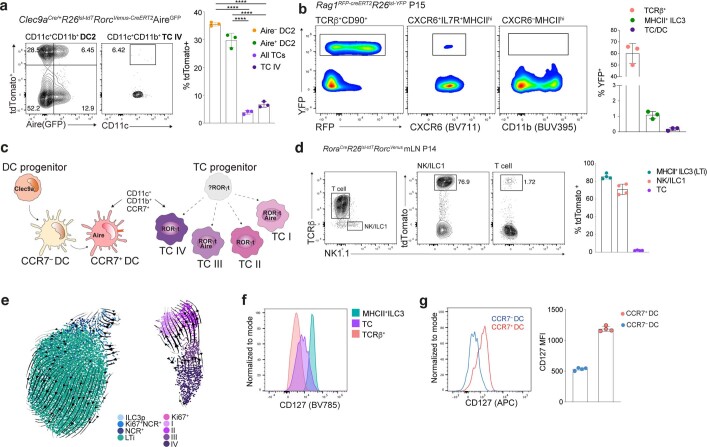
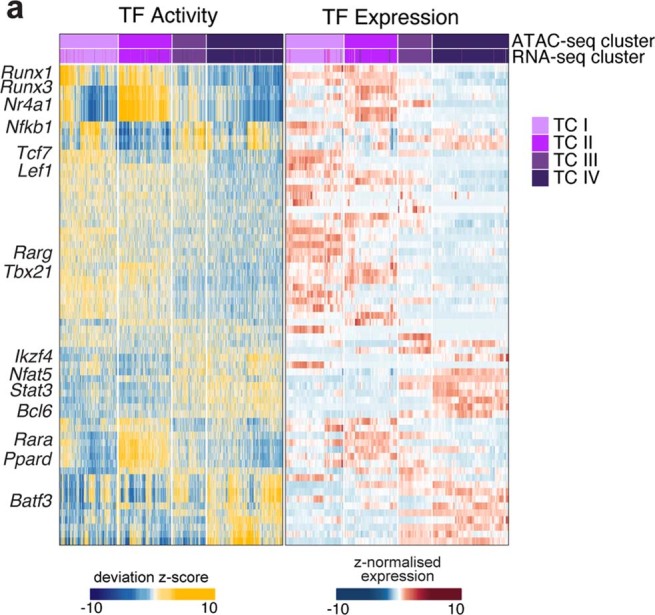
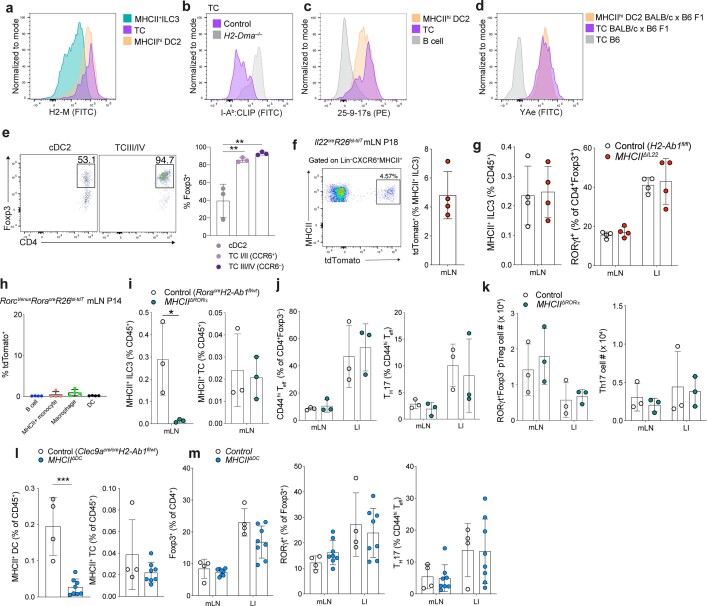
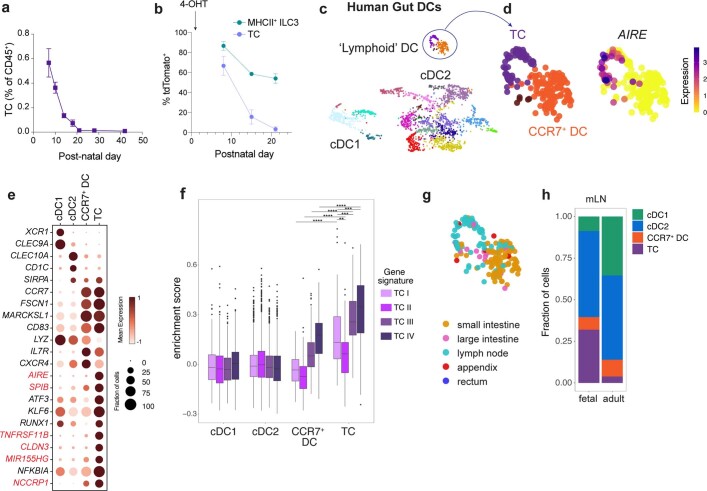
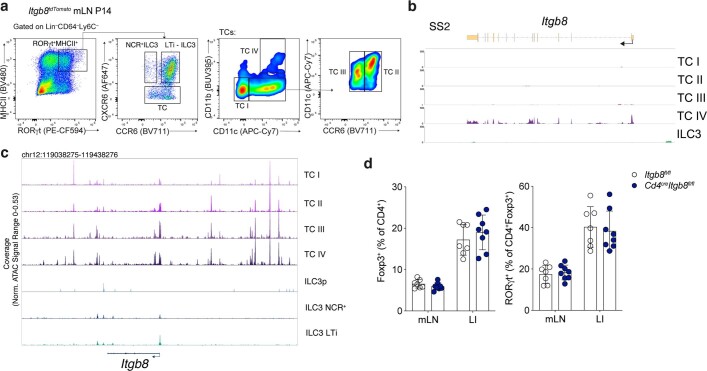
Establishing and maintaining tolerance to self-antigens or innocuous foreign antigens is vital for the preservation of organismal health. Within the thymus, medullary thymic epithelial cells (mTECs) expressing autoimmune regulator (AIRE) have a critical role in self-tolerance through deletion of autoreactive T cells and promotion of thymic regulatory T (Treg) cell development1-4. Within weeks of birth, a separate wave of Treg cell differentiation occurs in the periphery upon exposure to antigens derived from the diet and commensal microbiota5-8, yet the cell types responsible for the generation of peripheral Treg (pTreg) cells have not been identified. Here we describe the identification of a class of RORγt+ antigen-presenting cells called Thetis cells, with transcriptional features of both mTECs and dendritic cells, comprising four major sub-groups (TC I-TC IV). We uncover a developmental wave of Thetis cells within intestinal lymph nodes during a critical window in early life, coinciding with the wave of pTreg cell differentiation. Whereas TC I and TC III expressed the signature mTEC nuclear factor AIRE, TC IV lacked AIRE expression and was enriched for molecules required for pTreg generation, including the TGF-β-activating integrin αvβ8. Loss of either major histocompatibility complex class II (MHCII) or ITGB8 by Thetis cells led to a profound impairment in intestinal pTreg differentiation, with ensuing colitis. By contrast, MHCII expression by RORγt+ group 3 innate lymphoid cells (ILC3) and classical dendritic cells was neither sufficient nor required for pTreg generation, further implicating TC IV as the tolerogenic RORγt+ antigen-presenting cell with an essential function in early life. Our studies reveal parallel pathways for the establishment of tolerance to self and foreign antigens in the thymus and periphery, respectively, marked by the involvement of shared cellular and transcriptional programmes.


Conflict of interest statement

M.v.d.B. has received research support and stock options from Seres Therapeutics and stock options from Notch Therapeutics and Pluto Therapeutics; he has received royalties from Wolters Kluwer; has consulted, received honorarium from or participated in advisory boards for Seres Therapeutics, WindMIL Therapeutics, Rheos Medicines, Merck & Co., Magenta Therapeutics, Frazier Healthcare Partners, Nektar Therapeutics, Notch Therapeutics, Forty Seven, Priothera, Ceramedix, Lygenesis, Pluto Therapeutics, GlaskoSmithKline, Da Volterra, Vor BioPharma, Novartis (spouse), Synthekine (spouse) and Beigene (spouse); he has intellectual property licensed to Seres Therapeutics and Juno Therapeutics; and holds a fiduciary role on the Foundation Board of DKMS (a nonprofit organization). A.Y.R. is a member of the scientific advisory board and has equity in Surface Oncology and RAPT Therapeutics, and holds intellectual property licensed to Takeda, which is not related to the content of this study.

Figures

Fig. 1
Fig. 1. RORγt+ APCs promote pTreg differentiation and intestinal tolerance during early life.
ad, Flow cytometry of RORγt and FOXP3-expressing CD4+ T cell subsets (a,c) and summary graphs (b,d) for frequencies of pTreg (RORγt+FOXP3+) cells in mLN (a,b) and large intestine lamina propria (LI LP) (c,d) of 3-week-old MHCIIΔRORγt (n = 7) and control (H2-Ab1fl/fl) (n = 8) mice. e, Eight-week-old MHCIIΔRORγt (n = 4) and control (n = 3) mice were analysed for frequencies of pTreg (RORγt+FOXP3+) cells, RORγt Treg cells and TH17 (FOXP3RORγt+) cells among CD4+ T cells in indicated tissues. f, Representative haematoxylin and eosin (H&E)-stained sections of colon from MHCIIΔRORγt and control mice at 12 weeks of age. Scale bars, 200 μm. g, Histological colitis score in 12-week-old MHCIIΔRORγt (n = 5) and control (n = 3) mice. Data are mean ± s.e.m. Each symbol represents an individual mouse. Data in a are pooled from two independent experiments. Data in e are representative of three independent experiments. Two-tailed unpaired t-test. *P < 0.05, **P < 0.01, ***P < 0.001 and ***P < 0.0001. Source data
Fig. 2
Fig. 2. Identification of a novel RORγt+ APC lineage.
a, Schematic of paired scRNA-seq and scATAC-seq of LinRORγt+MHCII+ cells from the mLN of 2-week-old RorcVenus-creERT2 mice (pooled from 16 biological replicates). b,c, Uniform manifold approximation and projection (UMAP) visualization of 10,145 cells profiled by scRNA-seq (b) or scATAC-seq (c), coloured by cluster annotation. d, Dot plot showing the expression of canonical ILC3 or cluster I–IV marker genes e, Similarity between cell types identified in b and ImmGen bulk microarray profiles for immune and stromal cells. Cell lineages in which any individual cell type exhibited a cosine similarity greater than 0.25 were included in the visualization. f, scRNA-seq UMAP overlaid with imputed expression of Aire. g, Similarity between Thetis cell subsets in b and thymic epithelial subsets from publicly available single-cell transcriptomic data (cTEC; cortical thymic epithelial cell).
Fig. 3
Fig. 3. Transcriptional, epigenetic and ontological features of Thetis cell subsets.
a, UMAP visualization of integrated 10X Genomics and Smart-seq2 (SS2) scRNA-seq analysis for RORγt+MHCII+ Thetis cells (TC), coloured by SMART-seq2 Thetis cell transcriptome or 10X cluster annotation. b, Intracellular expression of AIRE protein by Thetis cells and dendritic cells. c, Index-sorting summary graphs for CD11c, CD11b cell-surface protein and RORγt (Venus) fluorescence intensity. d, Heat map showing expression of top differentially expressed genes (DEGs) between Thetis cells and MHCII+ ILC3s, profiled by SMART-seq2, identifying Rora as an ILC3–Thetis cell-distinguishing gene. e, Representative flow cytometry analysis of tdTomato expression in MHCII+ILC3 and Thetis cells isolated from mLN of RorcVenusRoracreRosa26lsl-tdTomato fate-mapped mice at P14 (n = 4). f, Heat map reporting scaled chromVAR deviation transcription factor motif scores (left) and corresponding transcription factor gene expression values (right) for top transcription factor gene–motif pairs in Thetis cells in scATAC-seq data. g, Heat map showing scaled, imputed expression of top 125 DEGs (one versus the rest, fold change (FC) > 1.5, adjusted P < 0.01) for each Thetis cell cluster. h, Dot plot showing expression of selected cell-surface markers that are differentially expressed between Thetis cell subsets. i, Gating strategy for identification of Thetis cell subsets. j, Intracellular expression of AIRE protein by Thetis cell subsets; each symbol represents an individual mouse (n = 4). k, summary of TC I–TC IV phenotypes. Plots in i are representative of n = 6 mice from 3 independent experiments. Data in b,e,j are representative of 3 independent experiments. Box plots in c indicate median (centre line) and interquartile range (hinges), whiskers represent minimum and maximum values, and dots represent outliers. Source data
Fig. 4
Fig. 4. Antigen presentation by ILC3s is not required for intestinal pTreg differentiation.
a, Dot plot showing expression of genes related to antigen presentation, T cell priming and cell migration across Thetis cell and MHCII+ ILC3 clusters (Fig. 2b). b, Representative flow cytometry of mLN ILC3s (CXCR6+RORγt+MHCII+) and Thetis cells (CXCR6RORγt+MHCII+) from P18 RorcVenus-creERT2AireGFP mice (n = 3), showing expression of indicated chemokine receptors, co-stimulatory and immune-regulatory molecules. d,e, Immune cell composition of 3-week-old MHCIIΔRORα (n = 3) and RoracreH2-Ab1fl/wt (n = 3) mice. d, Number of MHCII+ ILC3s and Thetis cells in mLN. e, Frequency of total Treg (FOXP3+) and RORγt+ pTreg cells. f, Frequency of total Treg (FOXP3+), RORγt+ pTreg cells and TH17 cells in mLN and large intestine lamina propria (LI) of 12-week-old MHCIIΔRORα (n = 5) and RoracreH2-Ab1fl/wt (n = 5) mice. g, Representative histological analysis of H&E-stained sections of the colon of mice in f (left) and summary histological colitis score (right). Scale bars, 200 μm. Data in bf are representative of two or three independent experiments. Data are mean ± s.e.m. Each symbol represents an individual mouse. Two-tailed unpaired t-test. Source data
Fig. 5
Fig. 5. A developmental wave of Thetis cells promotes early life pTreg differentiation in an ITGB8-dependent manner.
a, Number of Thetis cells in mLN from P7 to week 6 (n = 3–8 individual mice per timepoint). b, Frequency of Thetis cells in pLN and mLN of RorcVenus-creERT2AireGFP mice at P14 (n = 3 mice per group). c, Total number of tdTomato and tdTomato+ Thetis cells isolated from mLN of RorcVenus-creERT2Rosa26lsl-tdTomatoAireGFP mice at indicated time intervals following administration of 4-OHT at P1 (n = 4 mice per timepoint). d, Topic modelling of 10X scRNA-seq Thetis cell transcriptomes. The UMAP is coloured by the weight of topic 7 in each cell. e, Dot plot showing the expression of TGFβ pathway genes in Thetis cells and ILC3s. f,g, Representative flow cytometry (f) and summary graphs (g) of ITGB8 (tdTomato) expression in Thetis cell and ILC3 subsets in mLN of Itgb8tdTomato (n = 4) or littermate wild-type (WT) mice. h,i, Representative flow cytometry of RORγt- and FOXP3-expressing T cell subsets (h) and summary graphs for frequencies and numbers (i) of pTreg (RORγt+FOXP3+) cells in mLN and large intestine lamina propria (LI) of 3-week-old Itgb8ΔRORγt (n = 3) and Itgb8fl/fl (n = 4) mice. j, Frequency of RORγt+ pTreg cells among CD4+FOXP3+ cells in mLN and large intestine lamina propria of mixed bone marrow (BM) chimeras, analysed 6 weeks after reconstitution (n = 6 mice per group). k, Schematic of pTreg induction by Thetis cells. Data in b,c are representative of two independent experiments. Data in f,g,j are pooled from two (j) or three (f,g) independent experiments. Data in h,i are representative of 4 independent experiments. Data are mean ± s.e.m. Two-tailed unpaired t-test. Source data
Extended Data Fig. 1
Extended Data Fig. 1. Analysis of pTreg cell generation in mice harboring MHC class II-deficient RORγt+ APCs.
a, Quantification of total pTreg (RORγt+Foxp3+) and CD4+ Teff (Foxp3CD44hi) cells in the mesenteric lymph nodes (mLN) and large intestine lamina propria (LI) of 3-week-old MHCIIΔRORγt and control (H2-Ab1fl/fl) mice (n = 7 or 8 mice per group). b, pTreg (RORγt+Foxp3+) and TH17 (Foxp3CD44hiRORγt+) cells in mLN and LI of 8-week-old MHCIIΔRORγt (n = 4) and control (n = 3) mice. Data in a pooled from two independent experiments. Data in b representative of three independent experiments. Error bars: means ± s.e.m. Statistics were calculated by unpaired two-sided t-test; *P < 0.05; ***P < 0.01, ****P < 0.0001. Source data
Extended Data Fig. 2
Extended Data Fig. 2. Temporal ablation of MHC Class II on RORγt+ APCs.
a, Targeting strategy for the Rorc locus. b, Flow cytometry of Venus expression in thymocytes (left) or mLN TCRβ+CD4+ T cells (middle) and LinCD90+CD127+ innate lymphoid cells (ILC; right) isolated from adult mice. c, Flow cytometry of mLN, LI and intestinal epithelial (IE) CD45+ and CD45 cells in P16 Rorc reporter RORγt fate-mapper (RorcVenus-creERT2RorgtcreRosa26lsl-tdTomato) mice. Representative of n = 3 mice. d-e, Frequency of pTreg cells amongst CD4+Foxp3+ cells in mLN and LI (d) or frequency of RORγt+ APCs (Lin–RORγt(Venus)+MHCII+) (e) in mLN of RorcVenus-creERT2H2-Ab1fl/fl (n = 4) or RorcVenus-creERT2H2-Ab1fl/wt (n = 3) mice maintained on tamoxifen diet from 8–13 weeks of age. Each symbol represents an individual mouse. Data in bd representative of two independent experiments. Error bars: means ± s.e.m.; *P < 0.05; unpaired two-sided t-test. Source data
Extended Data Fig. 3
Extended Data Fig. 3. Identification of a novel RORγt+ APC lineage.
a, RORγt+Foxp3+ pTreg cell numbers in mLN and LI of RorcVenus-creERT2 mice at indicated postnatal ages (n = 3–4 mice per time-point). b, Cell sorting scheme for Lin(Siglec-F, TCRβ, TCRγδ, CD19, NK1.1)RORγt(Venus)+MHCII+ cells. c, Heatmap reporting scaled, imputed expression of top differentially expressed genes for each scRNA-seq cluster (one vs the rest, FC > 1.5, P < 0.01). d, Expression score of cell-cycle genes for each scRNA-seq cluster. e, Dot plot showing expression of myeloid genes. f, Flow cytometry of Zbtb46 (GFP) expression in ILC3 subsets from mLN of 3-week-old Zbtb46GFPRorgtcreR26lsl-tdTomato mice. Representative of n = 4 mice from two independent experiments. g-h, CellTypist derived cell labels for cell clusters from Fig. 2g, using a broad classification (g) or finer cell type annotation (h). i, Correspondence between cell labels for scATAC-seq and scRNA-seq. Source data
Extended Data Fig. 4
Extended Data Fig. 4. Distinguishing features of Thetis cells, mTECs and dendritic cells.
a-b, Flow cytometric analysis of LinCD64Ly6CCD11c+MHCII+ cells (a) and Lin CD64Ly6CCXCR6MHCII+ cells (b) encompassing dendritic cells (DCs) and Thetis cells (TCs) in mLN of RorccreERT2-VenusAireGFP mice at P18. c, Schematic of single cell transcriptome profiling of RORγt+MHCII+ cells from mLN of P21 RorcVenus-creERT2 mice encompassing TCs and MHCII+ ILC3s, alongside reference mLN Aire+MHCIIhi (CCR7+) DCs and thymic Aire+ mTECs from P21 AireGFP mice. d, Flow cytometry analysis of index sorted Aire+ mTECs or mLN Aire+ DCs isolated from 3-week-old AireGFP mice and (e) mLN LinRORγt+MHCII+ cells from 3-week-old RorcVenus-creERT2 mice. f-g, UMAP visualization of 481 cells colored by (f) PhenoGraph cluster or (g) reference cell-type or RORγt+MHCII+ cell-type as assigned by mapping RORγt+MHCII+ SS2 cells to 10X scRNA-seq clusters (Fig. 2b). h, Heatmap reporting scaled expression values for top differentially expressed genes (FC > 1.5, adj. P < 0.01) between Aire+ mTEC and TC I. i, Bar graph showing log-normalized expression of Ptprc and Rorc genes in Aire+ mTECs and TCs. j, Flow cytometry of RORγt expression in Aire+ mTECs isolated from P18 RorcVenus-creERT2AireGFP mice. k, Heatmap reporting scaled expression values for top differentially expressed genes (FC > 1.5, adj. P < 0.01) between indicated SS2 clusters (f). Data in a,b are representative of > 3 independent experiments. Data in j representative of n = 5 mice from two independent experiments. Source data
Extended Data Fig. 5
Extended Data Fig. 5. Phenotypic characterization of Thetis cells.
a, Flow cytometry of index sorted mLN RORγt+MHCII+ cells for DC markers, CD11c and CD11b. b, Coverage track for smart-seq2 single cell sequencing reads mapping to the Rorc locus, demonstrating expression of the Rorgt isoform by TCs. c, Flow cytometry of LinCXCR6MHCII+ cells from mLN of RorgtCreR26lsl-tdTomatoRorcVenus-CreERT2 mice and summary graph of frequency of tdTomato+ cells amongst LinCXCR6Venus(YFP)+ cells (n = 3 mice). d, Index sorting flow cytometric analysis of all RORγt+MHCII+ cells (left panel) and cells identified as ILC3 (right panel). e, Electron microscopy of CCR7 DCs, CCR7+ DCs, Aire+ mTECs, TC I, TC IV and MHCII+ ILC3 cells. Far right panel: arrows indicate distinctive mitochondrial cristae in TCs. f, Representative immunofluorescence imaging of TC and Treg markers in mLN sections from 2-week-old AireGFP mice. Arrowheads indicate Aire+ TC I/III or Cd11b+ TC IV. Images are representative of two independent experiments with similar results. g-h, Immunofluorescence analysis of mLN from P17 RorcVenus mice. Representative histo-cytometry plot for identification of RORγt+Foxp3+ pTreg cells and RORγt+MHCII+CD11c+CD11b+ TC IV (g) and representative immunofluorescence imaging demonstrating distribution of indicated cell types (h). n = 3 mice, 2 lymph nodes per mouse. Data in c are representative of 2 independent experiments. Source data
Extended Data Fig. 6
Extended Data Fig. 6. Thetis cells are ontogenically distinct from dendritic cells and ILC3s.
a, tdTomato labeling in cDC and TC from mLN of DC fate-mapping RORγt and Aire double reporter (Clec9aCre/+R26lsl-tdTomatoRorcVenus-creERT2AireGFP) mice at P18. b, Flow cytometry analysis of TCRβ+, MHCII+ ILC3, and CXCR6MHCII+ cells encompassing TCs and DCs, from mLN of RAG1 fate-mapped (Rag1creERT2R26lsl-YFP) mice (n = 3) at P15 following 4-OHT treatment on P3, 5 and 7. c, Schematic of DC and TC ontogeny demonstrating distinct and overlapping transcriptional regulators and cell surface markers. d, Flow cytometry analysis of indicated immune cell subsets from mLN of RORα fate-mapped RorcVenus mice and summary bar graph for tdTomato labeling. e, UMAP of RORγt+MHCII+ cells (Fig. 2b) with scVelo-projected velocities, shown as streamlines. f, IL7R (CD127) expression (representative of n = 4 mice) on ILC3s and TCs. g, Expression of IL7R by DC subsets. Each dot represents an individual mouse, (n = 4). Data in a,b,d,f,g are representative of 2-3 independent experiments. Source data
Extended Data Fig. 7
Extended Data Fig. 7. Characterization of Thetis cell subsets.
a, Heatmap reporting transcription factor (TF) motif activity score (left panel) or TF gene expression (right panel) for top TF-motif and gene expression pairs in scATAC/RNA-seq data (Fig. 1b).
Extended Data Fig. 8
Extended Data Fig. 8. Antigen presentation by ILC3s or dendritic cells is not required for extra-thymic intestinal pTreg differentiation.
ad, Flow cytometry of mLN from P14 RorcVenus-creERT2 (a,c) or H2-Dma–/– and littermate wild-type mice (b) or BALB/c x B6 F1 RorcVenus-creERT2 mice (d). demonstrating expression of indicated antigen processing and presenting molecules. MHCII+ ILC3s: (LinCXCR6+RORγt+MHCII+, TCs: (LinCXCR6RORγt+MHCII+ and DC2s: (LinRORγtCD11c+MHCIIhiCD11b+. Representative of n = 4 mice. e, frequency of Foxp3+ T cells amongst CD4+ T cells following co-culture of naïve CD4+ C7 T cells with indicated TC or DC subset. f, tdTomato labeling in MHCII+ILC3 (LinCXCR6+MHCII+) from mLN of IL22 fate-mapping (Il22Cre/+R26lsl-tdtomato) mice at P18. Representative flow cytometry and summary bar graph, n = 4 mice. g, Frequency of MHCII+ ILC3s and RORγt+ pTreg amongst CD4+Foxp3+ cells in indicated tissues from 3-week-old MHCIIΔIL22 (n = 4) and control (H2-Ab1fl/fl) (n = 4) mice. h, tdTomato expression by MHCII+ cell types in mLN of RorcVenusRoracreR26lsl-tdTomato fate-mapped mice at P14; n = 4 mice. i-j, Immune cell composition of 3-week-old MHCIIΔRORα (n = 3) and RoracreH2-Ab1fl/wt (n = 3) mice. (i) Frequency of MHCII+ ILC3s and TCs in mLN. (j), Frequency of CD4+Foxp3CD44hi Teff and RORγt+ Th17 cells, (k) Total number of RORγt+Foxp3+ pTreg and RORγt+ Th17 cells. l-m, Immune cell composition in mLN of 3-week-old MHCIIΔDC (n = 4) and control (Clec9acreH2-Ab1fl/wt) (n = 8) mice from 2 independent experiments. Frequency of MHCII expressing DCs or TCs within mLN (l). Frequency of total Foxp3+ Treg cells, pTreg cells amongst CD4+Foxp3+ cells, and Th17 cells in mLN and LI (m). Data in a-k are representative of 2-3 independent experiments, data in l,m are pooled from 2 independent experiments. Error bars: means ± s.e.m. ***P < 0.01, ****P < 0.0001; unpaired two-sided t-test. Source data
Extended Data Fig. 9
Extended Data Fig. 9. Thetis cells are enriched in early life and conserved across mouse and human.
a, Frequency of TCs within mLN from postnatal day 7 to 6-weeks-of age (n = 3–8 mice per timepoint). b, Percentage of tdTomato+ TCs and MHCII+ ILC3s isolated from mLN of RorcVenus-creERT2R26lsl-tdTomatoAireGFP mice at indicated time intervals following administration of 4-OHT on P1 (n = 4 mice per timepoint). c, Human gut atlas single cell transcriptomes. Cells annotated as DCs were reclustered with PhenoGraph and visualized with UMAP. d, UMAP of ‘lymphoid’ DC clusters colored by PhenoGraph cluster or unimputed expression of AIRE. e, Dot plot showing select genes differentially expressed between indicated cell subsets. f, Enrichment of TC subset signature genes within indicated human APC subsets. g, UMAP colored by tissue of origin. h, Proportion of indicated DC/TC subsets within mLN samples in fetal vs adult samples. Clusters annotated as cDC2 or cDC1 were grouped for analysis. Data in b are representative of two independent experiments. Box plots (f) indicate the median (center lines) and interquartile range (hinges), and whiskers represent min and max, dots represent outliers. ****P < 0.0001, ***P < 0.001, **P < 0.01; Mann Whitney U test (f). Source data
Extended Data Fig. 10
Extended Data Fig. 10. Thetis cells promote intestinal pTreg differentiation in an Itgb8-dependent manner.
a, Gating strategy for identification of ILC3 and TC subsets in mLN of Itgb8tdTomato mice at P14 (representative of n = 4 mice, three independent experiments). b, Itgb8 transcript levels in TC and ILC3 subsets profiled by Smart-seq 2. c, Chromatin accessibility at the Itgb8 locus and Itgb8 transcript levels in TC and ILC3 subsets (cells as in Fig 1c). d. Frequency of total Foxp3+ Treg cells and percentage of RORγt+ pTreg cells in mLN and LI of Itgb8ΔCd4 (n = 8) or Itgb8fl/fl mice (n = 7). Data pooled from two (d) or 3 (a) independent experiments. Error bars: means ± s.e.m. NS, not significant; unpaired two-sided t-test. Source data

Comment in

References

    1. Anderson MS, et al. Projection of an immunological self shadow within the thymus by the AIRE protein. Science. 2002;298:1395–1401. - PubMed
    1. Yang S, Fujikado N, Kolodin D, Benoist C, Mathis D. Regulatory T cells generated early in life play a distinct role in maintaining self-tolerance. Science. 2015;348:589–594. - PMC - PubMed
    1. Perry JSA, et al. Distinct contributions of Aire and antigen-presenting-cell subsets to the generation of self-tolerance in the thymus. Immunity. 2014;41:414–426. - PMC - PubMed
    1. Malchow S, et al. Aire enforces immune tolerance by directing autoreactive T cells into the regulatory T cell lineage. Immunity. 2016;44:1102–1113. - PMC - PubMed
    1. Ohnmacht C, et al. The microbiota regulates type 2 immunity through RORγt+ T cells. Science. 2015;349:989–993. - PubMed

Publication types

MeSH terms

Substances