. 2022 Sep 7;13(1):5268.
doi: 10.1038/s41467-022-32962-1.

Integrated cohort of esophageal squamous cell cancer reveals genomic features underlying clinical characteristics

Affiliations

Integrated cohort of esophageal squamous cell cancer reveals genomic features underlying clinical characteristics

Minghao Li et al. Nat Commun. .

Abstract

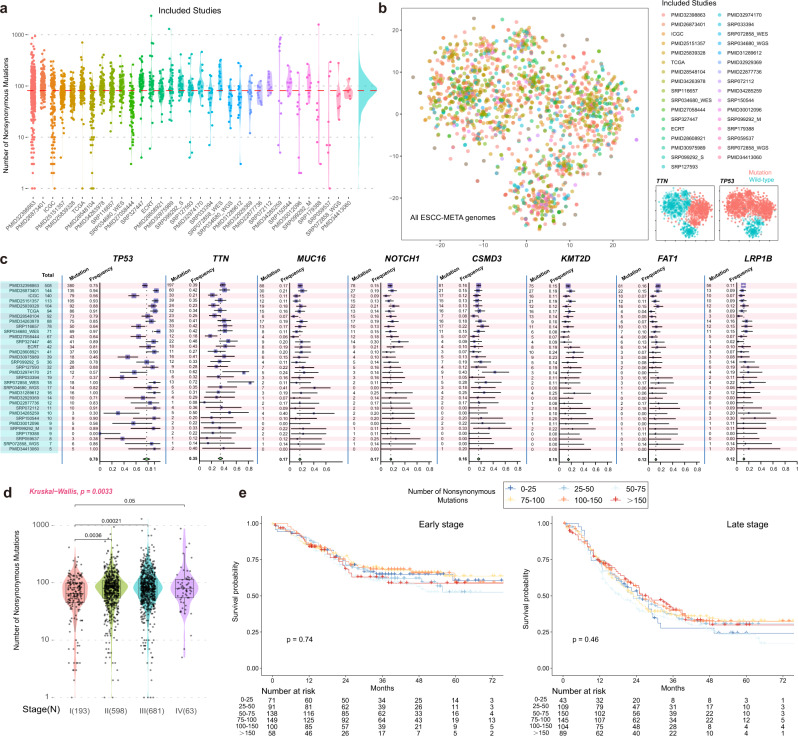
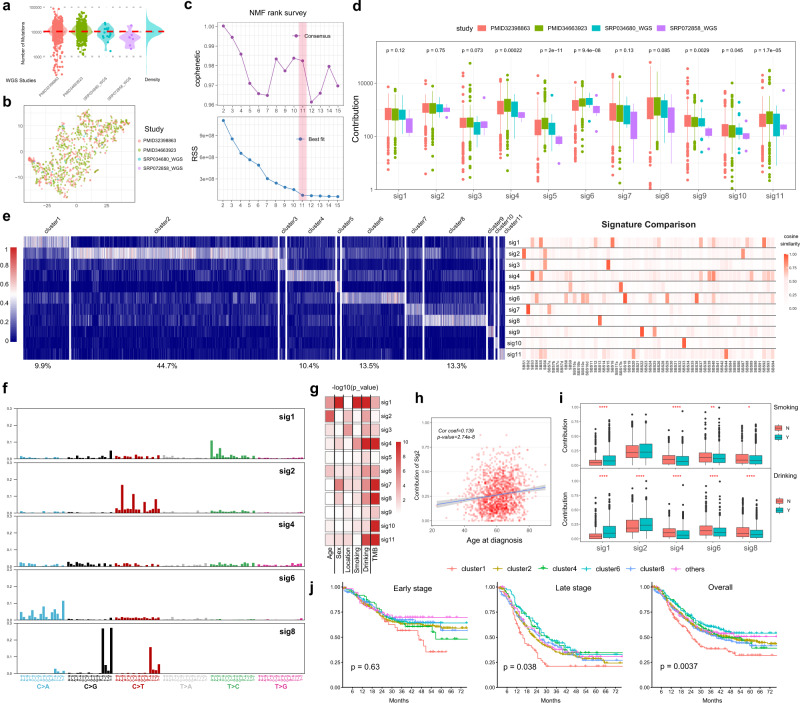
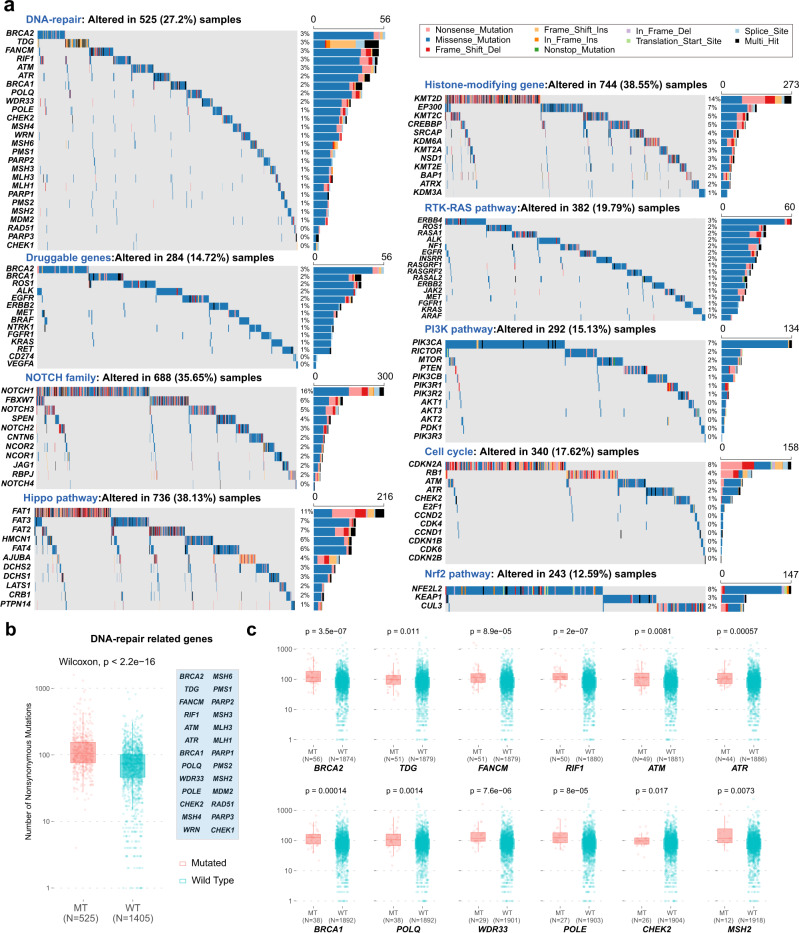
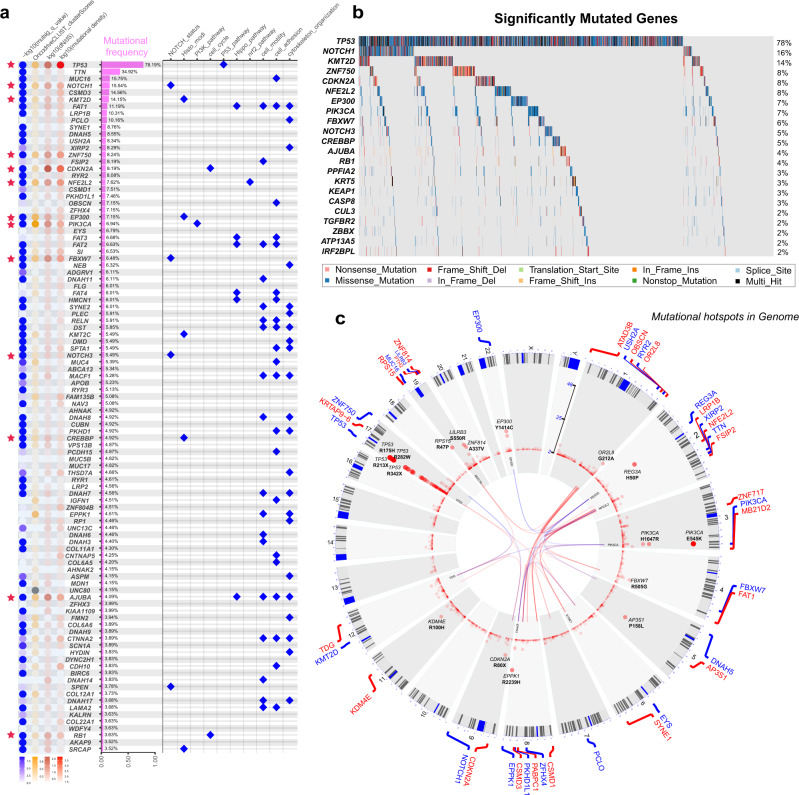
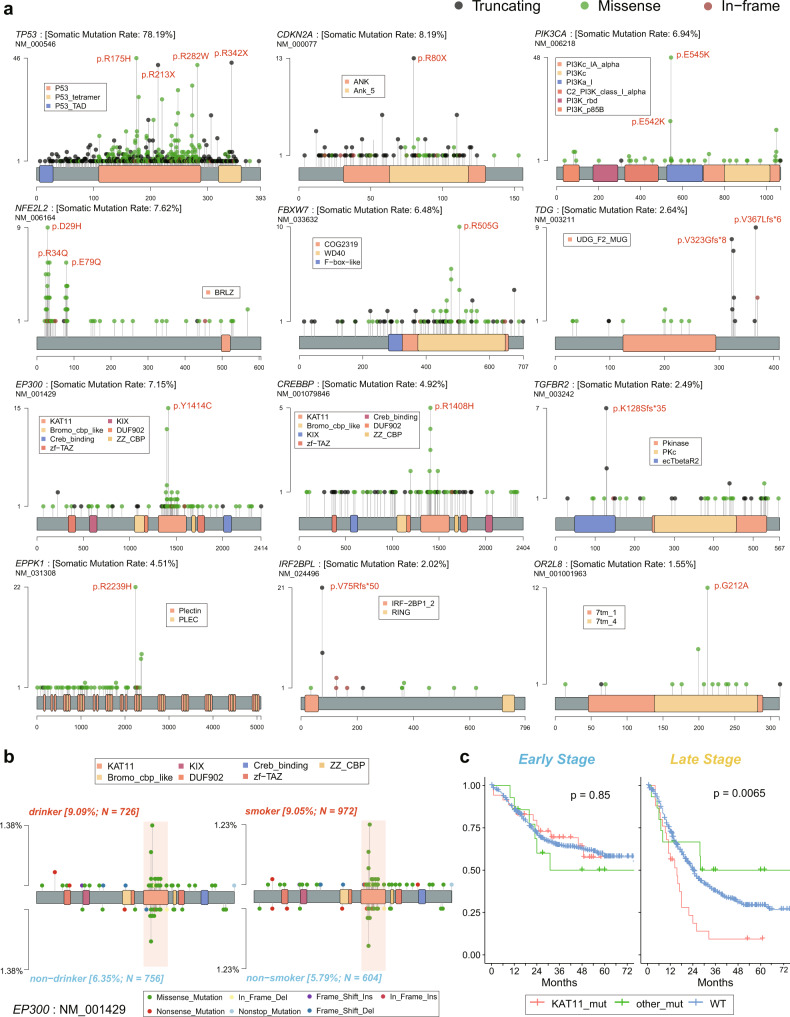
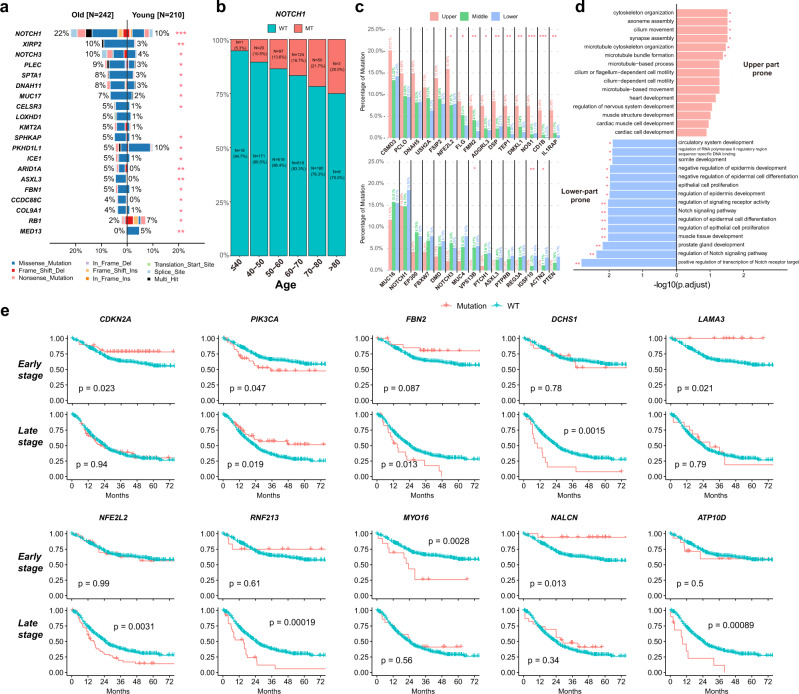
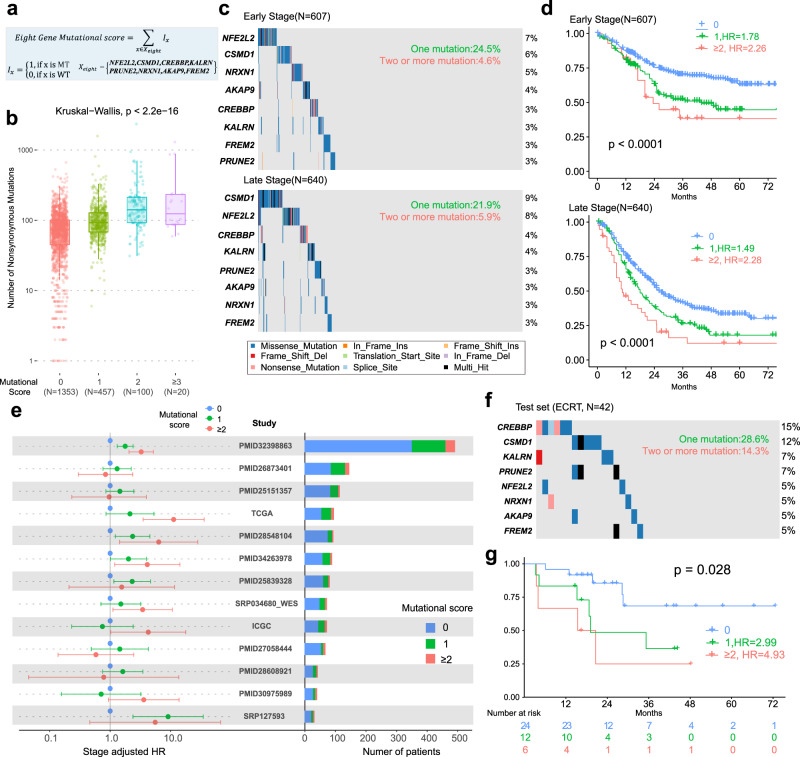
Esophageal squamous cell cancer (ESCC) is the major pathologic type of esophageal cancer in Asian population. To systematically evaluate the mutational features underlying clinical characteristics, we establish the integrated dataset of ESCC-META that consists of 1930 ESCC genomes from 33 datasets. The data process pipelines lead to well homogeneity of this integrated cohort for further analysis. We identified 11 mutational signatures in ESCC, some of which are related to clinical features, and firstly detect the significant mutated hotspots in TGFBR2 and IRF2BPL. We screen the survival related mutational features and found some genes had different prognostic impacts between early and late stage, such as PIK3CA and NFE2L2. Based on the results, an applicable approach of mutational score is proposed and validated to predict prognosis in ESCC. As an open-sourced, quality-controlled and updating mutational landscape, the ESCC-META dataset could facilitate further genomic and translational study in this field.


Conflict of interest statement

The authors declare no competing interests.

Figures

Fig. 1
Fig. 1. Overview of the ESCC-MATA cohort.
a All of the included studies and the number of the nonsilent mutations in the ESCC-META cohort. The datasets were ranked by their sample size from left to right. The red horizontal line indicated the median number in overall genomes. b The scatter plot of all genomes by t-SNE analysis. The dots were colored by datasets (left) or mutational status of TTN and TP53 (right). The t-SNE analysis was performed by the mutation matrix of all integrated genomes of the top 1000 genes. c forest plot of the mutational frequency for most common genes in ESCC among all included datasets. The total number of patients in each dataset was labeled in the leftmost panel (blue region). The gene-specific mutated numbers and frequencies in each dataset were presented in the left panel of the gene-specific region. The corresponding forest plots were in the right part. The error band for each line in the forest plot represents the 95% confidence interval of mutational frequency. d Comparison of the mutational load between different tumor stages. All the patients with available stage information were involved in this comparison. The Krustal–Wallis test was used to estimate the significance among the four groups, and the Wilcoxon test was used to estimate the difference in two groups comparison. In the boxplot, the lower extreme line, lower end of box, inner line of box, upper end of box and upper extreme line represent the value of (Q1 − 1.5×IQR), Q1, Q2, Q3 and (Q3 + 1.5×IQR), respectively. Q1—25th quartile; Q2—50th quartile or the median value; Q3—75th quartile. The interquartile range (IQR) is distance between Q1 and Q3 (Q3 − Q1). e Survival comparison between different mutational loads in both early-stage (stage I or II) and late-stage (stage III or IV) patients. All the patients with available stage information were involved in this comparison. The log-rank method was used to estimate the significance. Source data are provided as a Source Data file.
Fig. 2
Fig. 2. Mutational signature analysis.
a The distribution of total somatic SNVs in the WGS genomes from four datasets. b The results of the t-SNE analysis. The count matrix of 96 mutational types in WGS samples (n = 1084) was used in the t-SNE analysis, and the dots were colored by the source of dataset. c The NMF rank survey to choose the best separation. The cophenetic correlation coefficient (upper) and the residual sum of squares (lower) were plotted against factorization ranks (from 2 to 15). d The contributions of 11 identified signatures in WGS genomes (discovery set, 1084 patients). e The contributions of the identified 11 signatures in all ESCC-META genome. In the left panel, the patients were ranked according to their major signatures and grouped to 11 clusters. The right panel laid the heatmap of cosine similarity of the 11 signatures to the COSMIC database. f The 96 mutational type features of the sig1, sig2, sig4, sig6, and sig8, which are major mutational signatures in ESCC. g The heatmap of the significance (−log10pvalue) of association between signature contributions and the clinical variables in ESCC-META cohort. The two-side Krustal–Wallis test was used to test the difference among clinical groups. h The contribution of sig2 against the age of diagnosis in ESCC-META cohort. The Pearson’s correlation coefficient and its significance test were used to measure the correlation. The blue line and the gray band represent the fitted regression line and 95% confidence intervals. i In the patients of ESCC-META cohort with available smoking or drinking record, the contributions of major signatures among smoking (upper, n = 1578) or drinking (lower, n = 1484) status. j The overall survival curve of the major clusters in early (n = 607) or late-stage patients (n = 639). The labeled p-values were calculated by log-rank test. In d, g, h, and i, * indicates p < 0.05, **p < 0.01, ***p < 0.001, ****p < 0.0001. In boxplots of d and i, the lower extreme line, lower end of box, inner line of box, upper end of box, and upper extreme line represent the value of (Q1 − 1.5×IQR), Q1, Q2, Q3 and (Q3 + 1.5×IQR), respectively. Q1—25th quartile; Q2—50th quartile or the median value; Q3—75th quartile. The interquartile range (IQR) is distance between Q1 and Q3 (Q3 − Q1). Source data are provided as a Source Data file.
Fig. 3
Fig. 3. Summary of altered pathways in ESCC-META.
a The oncoplots of genes in mainly altered pathways. The text above each oncoplot indicates the cumulative altered frequencies among ESCC-META cohort, and the right bar plot indicates the number of mutated patients for each gene. The Multi-Hit (black color) represents two or more nonsilent mutational sites of the specified gene in one patient. b, c Comparison of mutational load between mutational status of DNA-repair pathway-related genes in ESCC-META cohort. The two-side the Wilcoxon test was used to estimate the significance between two groups. In the boxplots (b, c), the lower extreme line, lower end of box, inner line of box, upper end of box, and upper extreme line represent the value of (Q1 − 1.5×IQR), Q1, Q2, Q3 and (Q3 + 1.5×IQR), respectively. Q1—25th quartile; Q2—50th quartile or the median value; Q3—75th quartile. The interquartile range (IQR) is distance between Q1 and Q3 (Q3 − Q1). The effects of single mutated gene are shown in c and the effect of any mutation in the pathway (genes listed in the blue box) is shown in b. Source data are provided as a Source Data file.
Fig. 4
Fig. 4. Significantly mutated genes.
a Summary of the top 100 common mutated genes in the ESCC-META dataset. The dot heat of left panel indicated the mutational importance estimated by four approaches, and the red stars labeled the significantly mutated genes (n = 22) in combined selection. The bar plot of middle panel indicates the mutational frequency. The dot plot of right panel indicates the major related pathway. b The oncoplot of the 22 significantly mutated genes in ESCC-META cohort. c The circle chart to indicate the recurrent SNVs in ESCC-META cohort. Each point represented one recurrent mutational site in genome, and the relative height indicate the recurrent frequency. The inner part of the circle linked the significant interactions of gene-pairs, in which the blue links indicated mutually exclusive patterns and the red links indicated co-occurring patterns. Source data are provided as a Source Data file.
Fig. 5
Fig. 5. The distribution of mutational hotspots.
a The lollipop plots of some mutational hotspots in the ESCC-META dataset. b The comparative lollipop plots of EP300 in the comparison of drinking (left) or smoking (right) status. The range of KAT11 domain is marked by pink band. c The survival comparison between different EP300 mutational status in early (left panel) or late (right panel) patients of ESCC-META cohort. The two-side log-rank tests were used to indicate significance. Source data are provided as a Source Data file.
Fig. 6
Fig. 6. Clinical characteristics related to genomic features.
a Comparative bar plot of most significantly varied genes between old patients and young patients. The two-side Fisher’s exact test was used to indicate the significance, and * indicating p < 0.05, **p < 0.01, ***p < 0.001. b The proportion of NOTCH1 mutated patients in different groups of diagnostic age. c The mutational frequencies in tumors from different thoracic part. The upper panel indicated genes more commonly mutated in upper part, while the lower panel presented lower-part prone mutations. The two-side Fisher’s exact test was used to indicate the significance, and * indicating p < 0.05, **p < 0.01, ***p < 0.001. d The top 15 enriched pathways from GO analysis of upper part prone genes (upper part) or lower-part prone genes (lower part). The labeled * represents for p (adjusted) <0.05, ** for p (adjusted) <0.01. e Survival plots of some significant genes in early or late-stage patients. The two-side log-rank test was used to indicate the significance. Source data are provided as a Source Data file.
Fig. 7
Fig. 7. Building of eight-gene mutational score.
a The formula definition of the eight-gene mutational score. WT wide type, MT mutation. b The comparison of mutational load among different mutation score in all ESCC-META genomes, the two-side Krustal–Wallis test was used to estimate the significance among the groups. In the boxplots, the lower extreme line, lower end of box, inner line of box, upper end of box, and upper extreme line represent the value of (Q1 − 1.5×IQR), Q1, Q2, Q3 and (Q3 + 1.5×IQR), respectively. Q1—25th quartile; Q2—50th quartile or the median value; Q3—75th quartile. The interquartile range (IQR) is distance between Q1 and Q3 (Q3 − Q1). c Oncoplots of the eight genes in mutational score within early-stage patients (upper) or late-stage patients (lower) of discovery set. d The survival comparison between different mutational scores within early-stage patients (upper, n = 607) or late-stage patients (lower, n = 640) of discovery set. The two-side log-rank test was used to indicate the significance. e The prognostic value of mutational score within separated dataset. The left panel indicates the stage-adjusted HR of mutational score with the 95% confidence interval (the dot and error bar). The left panel indicates the total and positive number in each dataset. f The oncoplot of the eight genes in mutational score within test set of ECRT (n = 42). g The survival comparison between different mutational scores within test set. The two-side log-rank test was used to indicate the significance. Source data are provided as a Source Data file.

References

    1. Enzinger PC, Mayer RJ. Esophageal cancer. N. Engl. J. Med. 2003;349:2241–2252. doi: 10.1056/NEJMra035010. - DOI - PubMed
    1. Agrawal N, et al. Comparative genomic analysis of esophageal adenocarcinoma and squamous cell carcinoma. Cancer Discov. 2012;2:899–905. doi: 10.1158/2159-8290.CD-12-0189. - DOI - PMC - PubMed
    1. Song Y, et al. Identification of genomic alterations in oesophageal squamous cell cancer. Nature. 2014;509:91–95. doi: 10.1038/nature13176. - DOI - PubMed
    1. Lin DC, et al. Genomic and molecular characterization of esophageal squamous cell carcinoma. Nat. Genet. 2014;46:467–473. doi: 10.1038/ng.2935. - DOI - PMC - PubMed
    1. Gao YB, et al. Genetic landscape of esophageal squamous cell carcinoma. Nat. Genet. 2014;46:1097–1102. doi: 10.1038/ng.3076. - DOI - PubMed

Publication types