. 2022 Sep 7;12(1):15176.
doi: 10.1038/s41598-022-19155-y.

Spatio-temporal predictions of COVID-19 test positivity in Uppsala County, Sweden: a comparative approach

Affiliations

Spatio-temporal predictions of COVID-19 test positivity in Uppsala County, Sweden: a comparative approach

Vera van Zoest et al. Sci Rep. .

Abstract

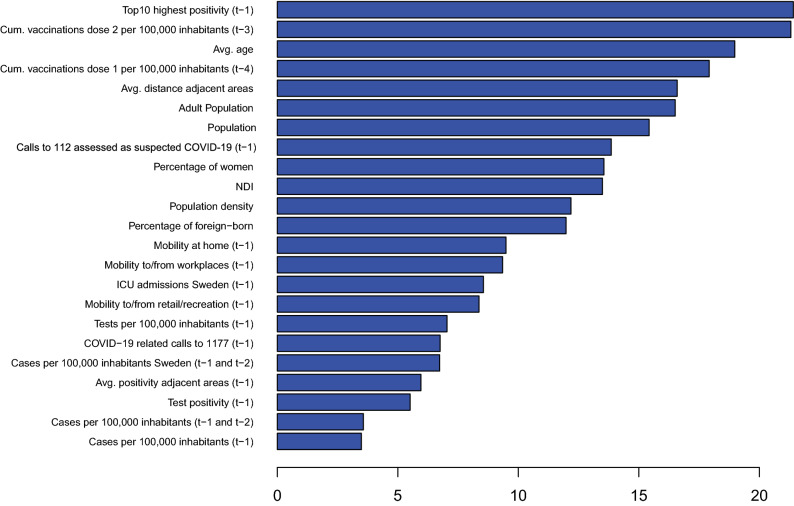
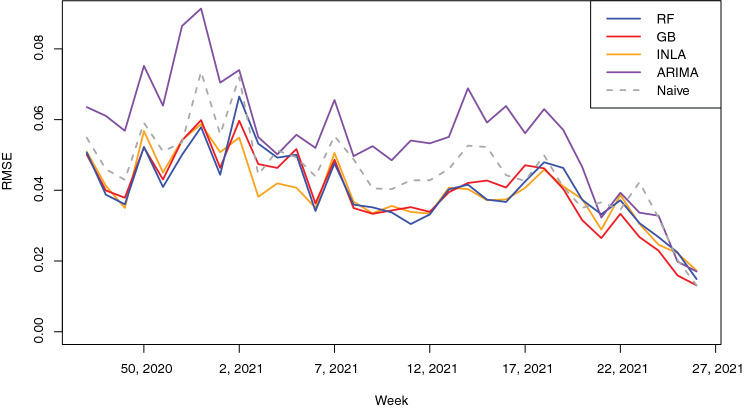
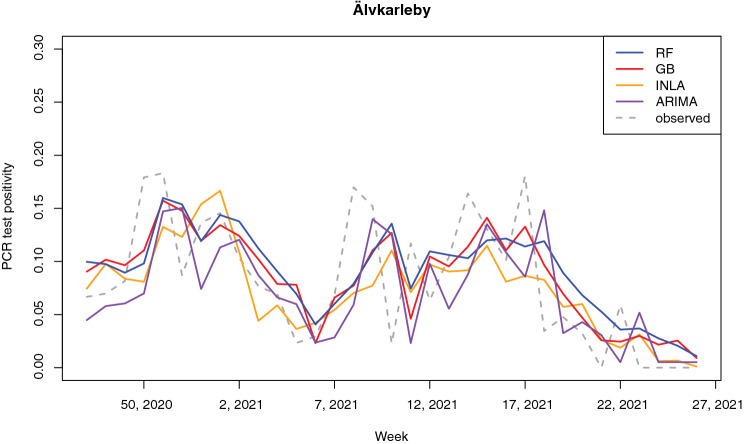
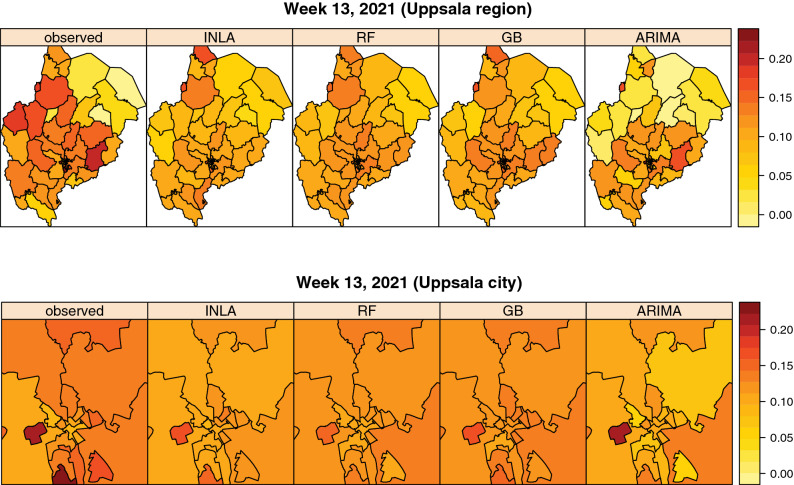
Previous spatio-temporal COVID-19 prediction models have focused on the prediction of subsequent number of cases, and have shown varying accuracy and lack of high geographical resolution. We aimed to predict trends in COVID-19 test positivity, an important marker for planning local testing capacity and accessibility. We included a full year of information (June 29, 2020-July 4, 2021) with both direct and indirect indicators of transmission, e.g. mobility data, number of calls to the national healthcare advice line and vaccination coverage from Uppsala County, Sweden, as potential predictors. We developed four models for a 1-week-window, based on gradient boosting (GB), random forest (RF), autoregressive integrated moving average (ARIMA) and integrated nested laplace approximations (INLA). Three of the models (GB, RF and INLA) outperformed the naïve baseline model after data from a full pandemic wave became available and demonstrated moderate accuracy. An ensemble model of these three models slightly improved the average root mean square error to 0.039 compared to 0.040 for GB, RF and INLA, 0.055 for ARIMA and 0.046 for the naïve model. Our findings indicate that the collection of a wide variety of data can contribute to spatio-temporal predictions of COVID-19 test positivity.


Conflict of interest statement

The authors declare no competing interests.

Figures

Figure 1
Figure 1
Gradient boosting, averaged ranking (over time) of importance for each variable. Lower ranks indicate higher importance.
Figure 2
Figure 2
Means of the importance ranks over all time points for the Random Forest model. Lower ranks indicate higher importance.
Figure 3
Figure 3
Posterior distributions for βk in prediction model for week 21, 2021. The gray dot-dashed lines indicate zero.
Figure 4
Figure 4
RMSE for the different models over time.
Figure 5
Figure 5
Time series of predicted and observed test positivity in Heby, a part of the region less strongly affected by the pandemic.
Figure 6
Figure 6
Time series of observed and predicted test positivity in Älvkarleby, a part of the region strongly affected by the pandemic.
Figure 7
Figure 7
Maps of observed and predicted test positivity in week 13, 2021, at the peak of the third wave of the pandemic. Uppsala county (top) and zoom-in of Uppsala city (bottom).

References

    1. Adam DC, et al. Clustering and superspreading potential of SARS-CoV-2 infections in Hong Kong. Nat. Med. 2020;26:1714–1719. doi: 10.1038/s41591-020-1092-0. - DOI - PubMed
    1. Meyerowitz EA, Richterman A, Gandhi RT, Sax PE. Transmission of SARS-CoV-2: A review of viral, host, and environmental factors. Ann. Intern. Med. 2021;174:69–79. doi: 10.7326/m20-5008. - DOI - PMC - PubMed
    1. Shen Y, et al. Community outbreak investigation of SARS-CoV-2 transmission among bus riders in Eastern China. JAMA Intern. Med. 2020;180:1665–1671. doi: 10.1001/jamainternmed.2020.5225. - DOI - PMC - PubMed
    1. Leclerc QJ, et al. What settings have been linked to SARS-CoV-2 transmission clusters? Wellcome Open Res. 2020;5:83. doi: 10.12688/wellcomeopenres.15889.2. - DOI - PMC - PubMed
    1. Petropoulos F, Makridakis S, Stylianou N. COVID-19: Forecasting confirmed cases and deaths with a simple time-series model. Int. J. Forecast. 2020 doi: 10.1016/j.ijforecast.2020.11.010. - DOI - PMC - PubMed

Publication types