. 2022 Sep 7;12(1):15194.
doi: 10.1038/s41598-022-19542-5.

Chronic back pain sub-grouped via psychosocial, brain and physical factors using machine learning

Affiliations

Chronic back pain sub-grouped via psychosocial, brain and physical factors using machine learning

Scott D Tagliaferri et al. Sci Rep. .

Abstract

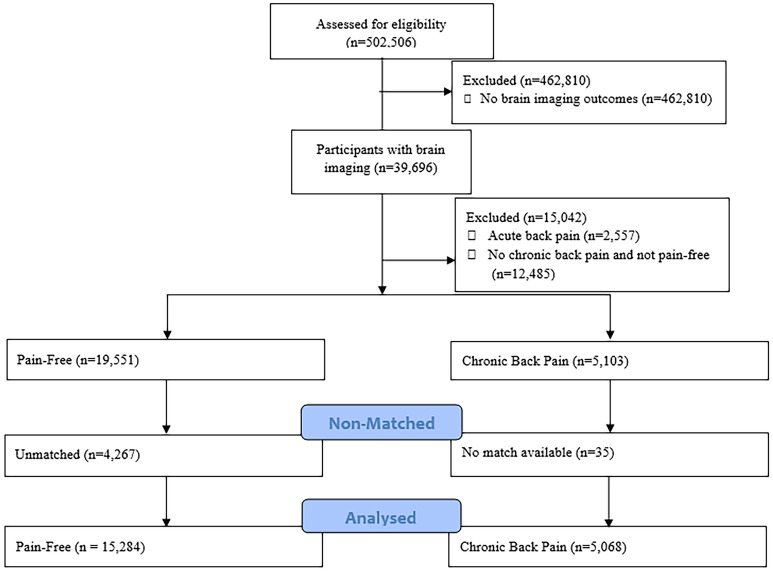
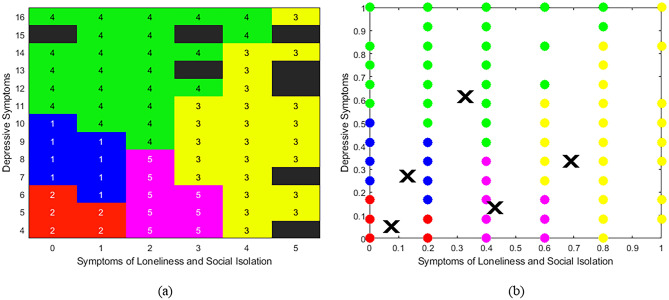
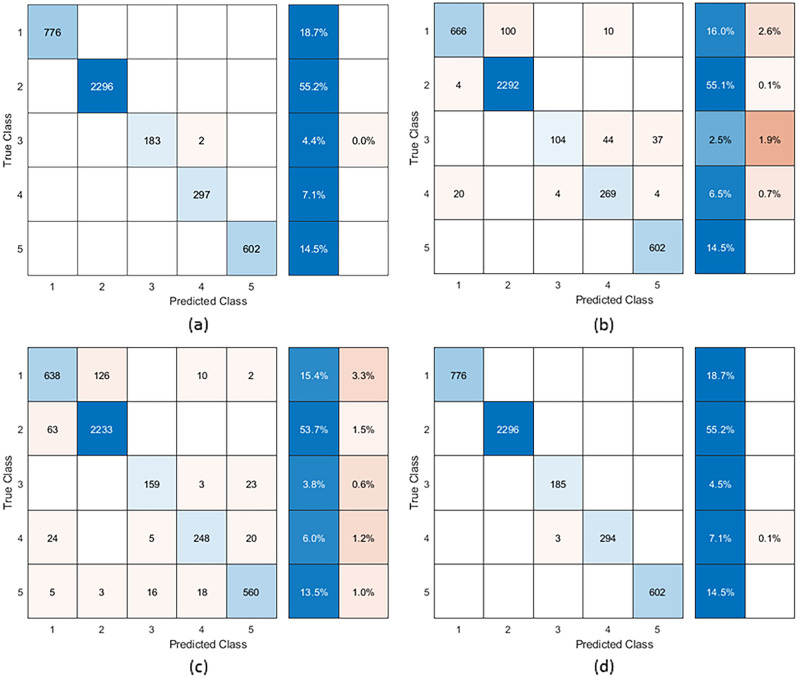
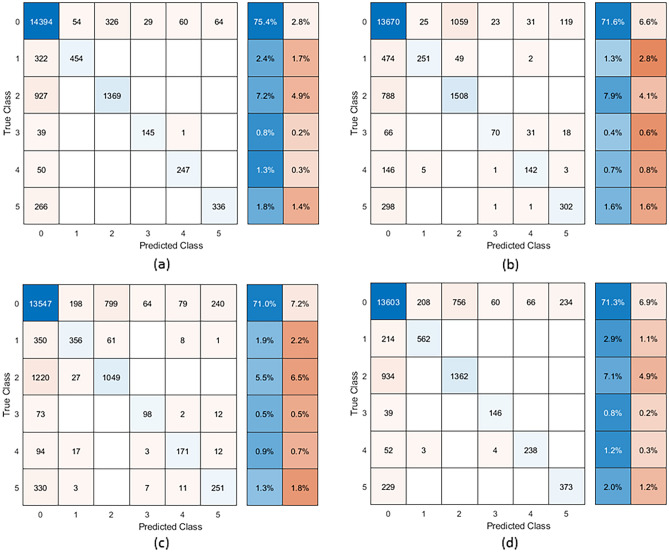
Chronic back pain (CBP) is heterogenous and identifying sub-groups could improve clinical decision making. Machine learning can build upon prior sub-grouping approaches by using a data-driven approach to overcome clinician subjectivity, however, only binary classification of pain versus no-pain has been attempted to date. In our cross-sectional study, age- and sex-matched participants with CBP (n = 4156) and pain-free controls (n = 14,927) from the UkBioBank were included. We included variables of body mass index, depression, loneliness/social isolation, grip strength, brain grey matter volumes and functional connectivity. We used fuzzy c-means clustering to derive CBP sub-groups and Support Vector Machine (SVM), Naïve Bayes, k-Nearest Neighbour (kNN) and Random Forest classifiers to determine classification accuracy. We showed that two variables (loneliness/social isolation and depression) and five clusters were optimal for creating sub-groups of CBP individuals. Classification accuracy was greater than 95% for when CBP sub-groups were assessed only, while misclassification in CBP sub-groups increased to 35-53% across classifiers when pain-free controls were added. We showed that individuals with CBP could sub-grouped and accurately classified. Future research should optimise variables by including specific spinal, psychosocial and nervous system measures associated with CBP to create more robust sub-groups that are discernible from pain-free controls.


Conflict of interest statement

The authors declare no competing interests.

Figures

Figure 1
Figure 1
Flow diagram of participant selection for this UKBioBank sub-study.
Figure 2
Figure 2
(a) Heat Map and (b) Scatter plot of the distribution of sub-groups of individuals with CBP based on symptoms of depression and loneliness/social isolation. Data are at discrete intervals due to outcomes being questionnaire based. Data is presented on (a) normal item range and (b) normalised scale of 0–1. Higher scores indicate greater symptoms of depression or loneliness/social isolation. Based on the centroids of fuzzy c-means clustering, classes and colours are (1; blue) low social isolation and loneliness and moderate depressive symptoms (n = 776; 18.7%), (2; red) low loneliness/social isolation and depressive symptoms (n = 2296; 55.3%), (3; yellow) high loneliness/social isolation and moderate depressive symptoms (n = 185; 4.5%), (4; green) moderate loneliness/social isolation and high depressive symptoms (n = 297; 7.2%) and (5; pink) moderate loneliness/social isolation and low depressive symptoms (n = 602; 14.5%). Black squares on the heat map indicate no class was available at those values. The X value on the scatter plot indicates the centroid of that cluster.
Figure 3
Figure 3
Confusion matrix of classifiers on chronic back pain classes (no pain-free controls included) with (a) Support Vector Machine, (b) Naïve Bayes, (c) k-Nearest Neighbour and (d) Random Forest classifiers. The x-axis is the predicted class while the y-axis is the true class. Blue squares indicate the number in the class that was accurately classified, while the oranges squares show the number of misclassifications. The boxes on the right of the matrix show the percentage of classification (blue) and misclassification (orange) for the class. Classes are (1) low social isolation and loneliness and moderate depressive symptoms (n = 776; 18.7%), (2) low loneliness/social isolation and depressive symptoms (n = 2296; 55.3%), (3) high loneliness/social isolation and moderate depressive symptoms (n = 185; 4.5%), (4) moderate loneliness/social isolation and high depressive symptoms (n = 297; 7.2%) and (5) moderate loneliness/social isolation and low depressive symptoms (n = 602; 14.5%).
Figure 4
Figure 4
Confusion matrix of classifiers on chronic back pain and pain-free classes with (a) Support Vector Machine, (b) Naïve Bayes, (c) k-Nearest Neighbour and (d) Random Forest classifiers. The x-axis is the predicted class while the y-axis is the true class. Blue squares indicate the number in the class that was accurately classified, while the oranges squares show the number of misclassifications. The boxes on the right of the matrix show the percentage of classification (blue) and misclassification (orange) for the class. Classes are (0) pain-free individuals (n = 14,927; 78.2%), (1) low social isolation/loneliness and moderate depressive symptoms (n = 776; 4.1%), (2) low loneliness/social isolation and depressive symptoms (n = 2296; 12.0%), (3) high loneliness/social isolation and moderate depressive symptoms (n = 185; 1.0%), (4) moderate loneliness/social isolation and high depressive symptoms (n = 297; 1.6%) and (5) moderate loneliness/social isolation and low depressive symptoms (n = 602; 3.2%).

Similar articles

Cited by

References

    1. Vos T, et al. Global, regional, and national incidence, prevalence, and years lived with disability for 328 diseases and injuries for 195 countries, 1990–2016: A systematic analysis for the Global Burden of Disease Study 2016. Lancet. 2017;390:1211–1259. doi: 10.1016/S0140-6736(17)32154-2. - DOI - PMC - PubMed
    1. Maetzel A, Li L. The economic burden of low back pain: A review of studies published between 1996 and 2001. Best Pract. Res. Clin. Rheumatol. 2002;16:23–30. doi: 10.1053/berh.2001.0204. - DOI - PubMed
    1. Froud R, et al. A systematic review and meta-synthesis of the impact of low back pain on people’s lives. BMC Musculoskelet. Disord. 2014;15:50. doi: 10.1186/1471-2474-15-50. - DOI - PMC - PubMed
    1. Maher C, Underwood M, Buchbinder R. Non-specific low back pain. Lancet. 2017;389:736–747. doi: 10.1016/S0140-6736(16)30970-9. - DOI - PubMed
    1. Rabey M, et al. Chronic low back pain is highly individualised: Patterns of classification across three unidimensional subgrouping analyses. Scand. J. Pain. 2019 doi: 10.1515/sjpain-2019-0073. - DOI - PubMed

Publication types