. 2022 Oct;610(7933):737-743.
doi: 10.1038/s41586-022-05089-y. Epub 2022 Sep 7.

A RORγt+ cell instructs gut microbiota-specific Treg cell differentiation

Affiliations

A RORγt+ cell instructs gut microbiota-specific Treg cell differentiation

Ranit Kedmi et al. Nature. 2022 Oct.

Erratum in

Abstract

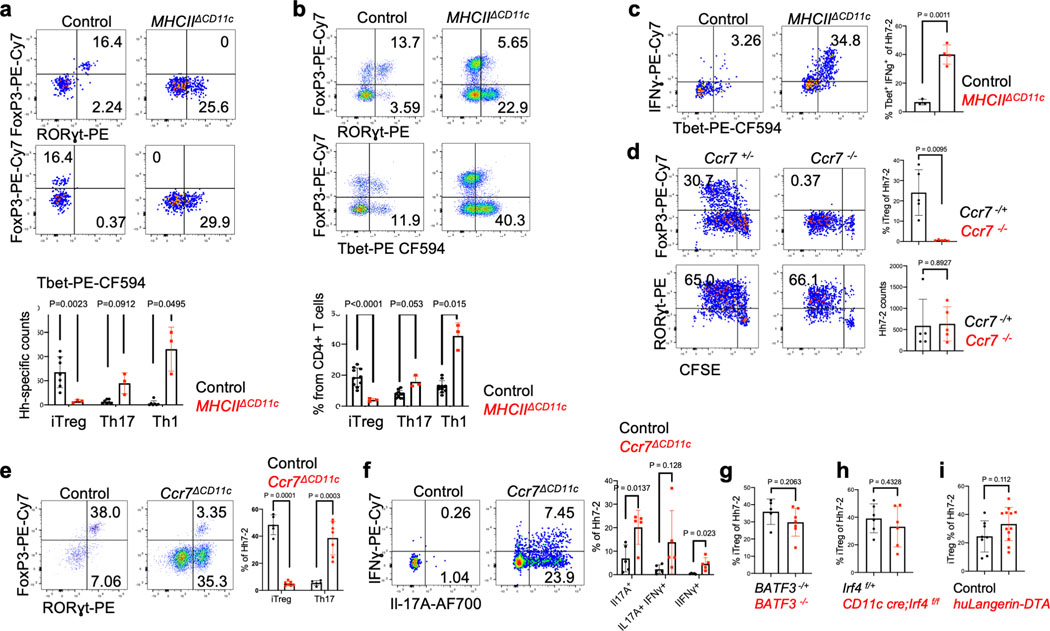
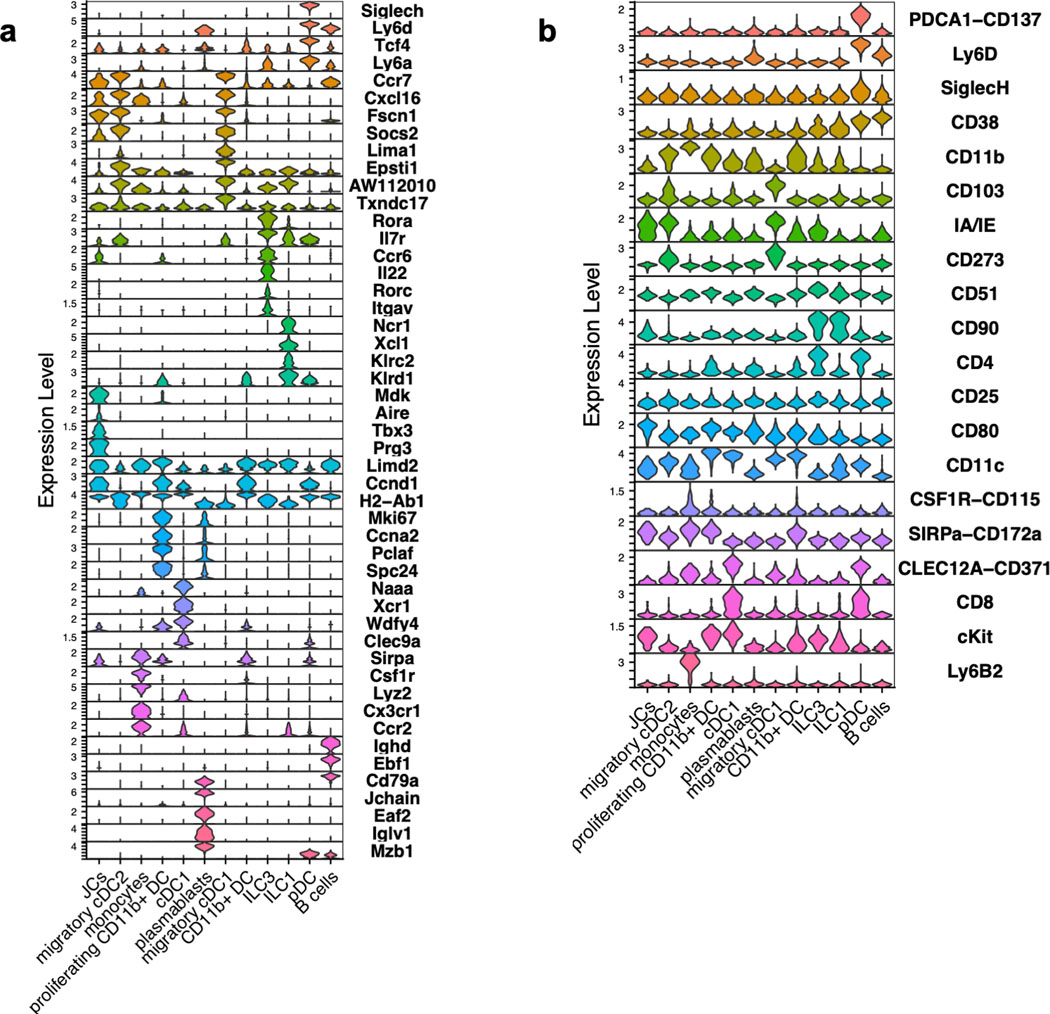
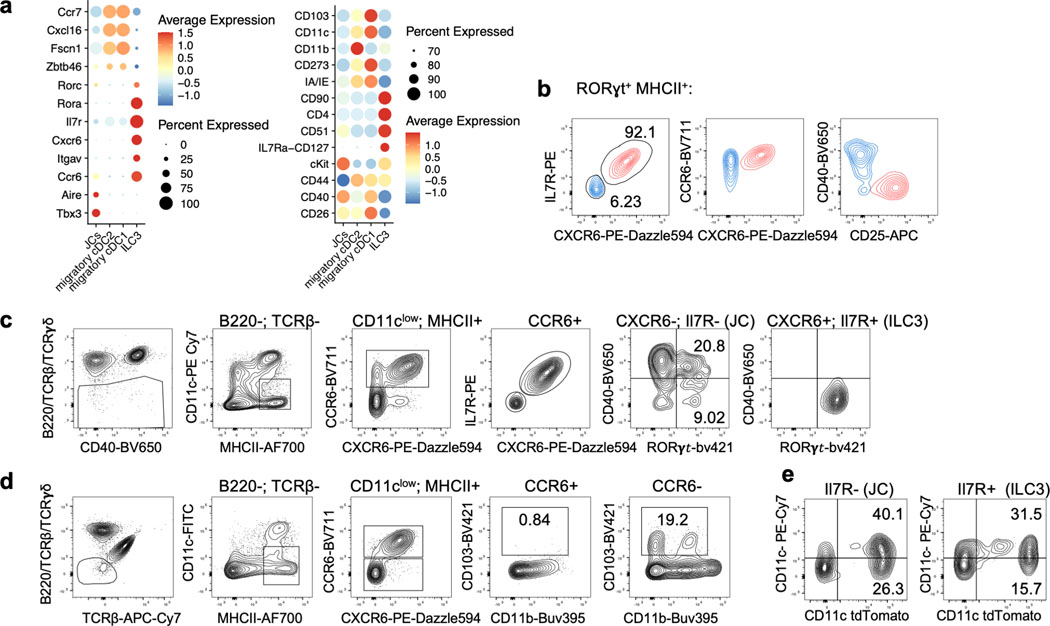
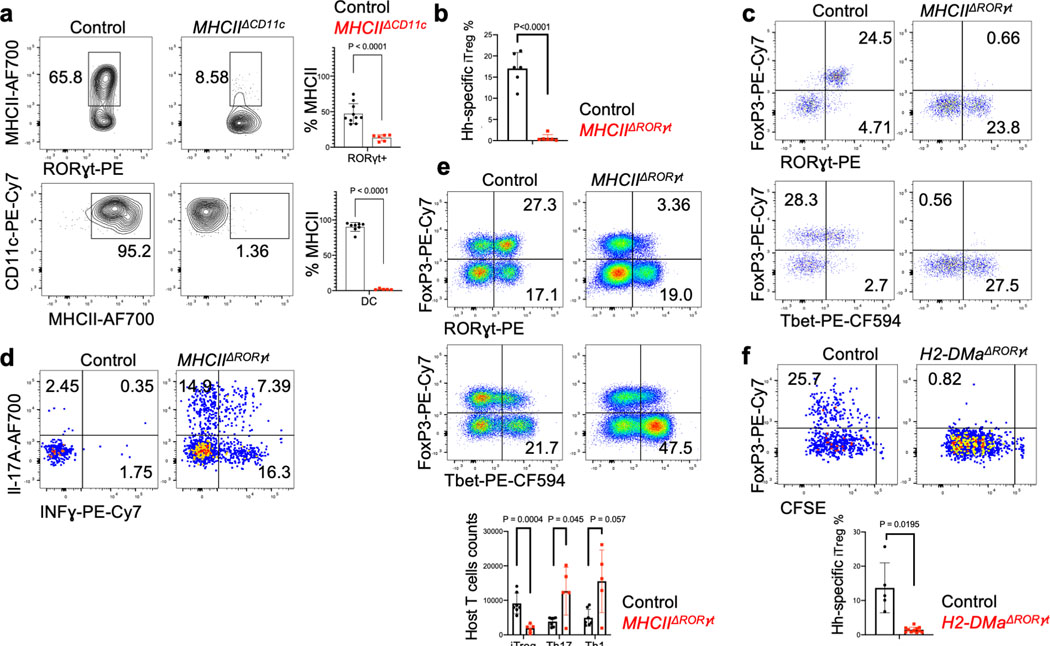
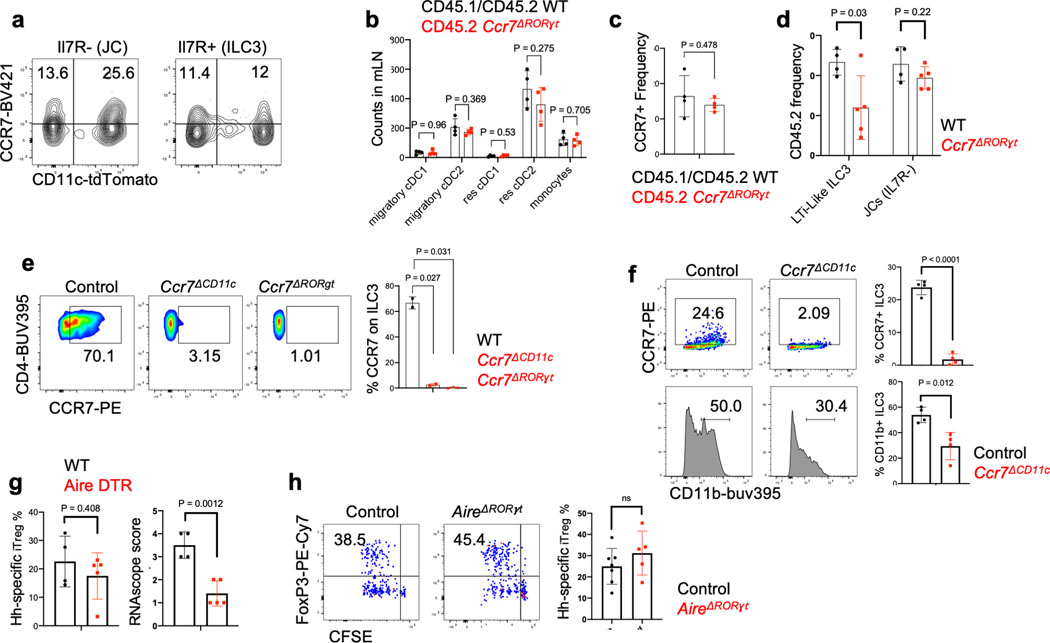
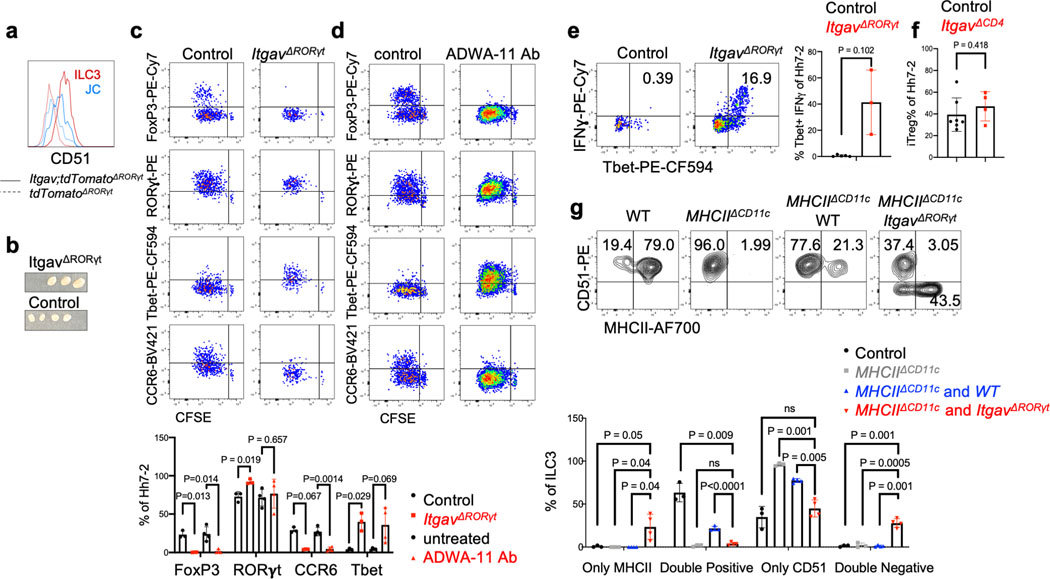
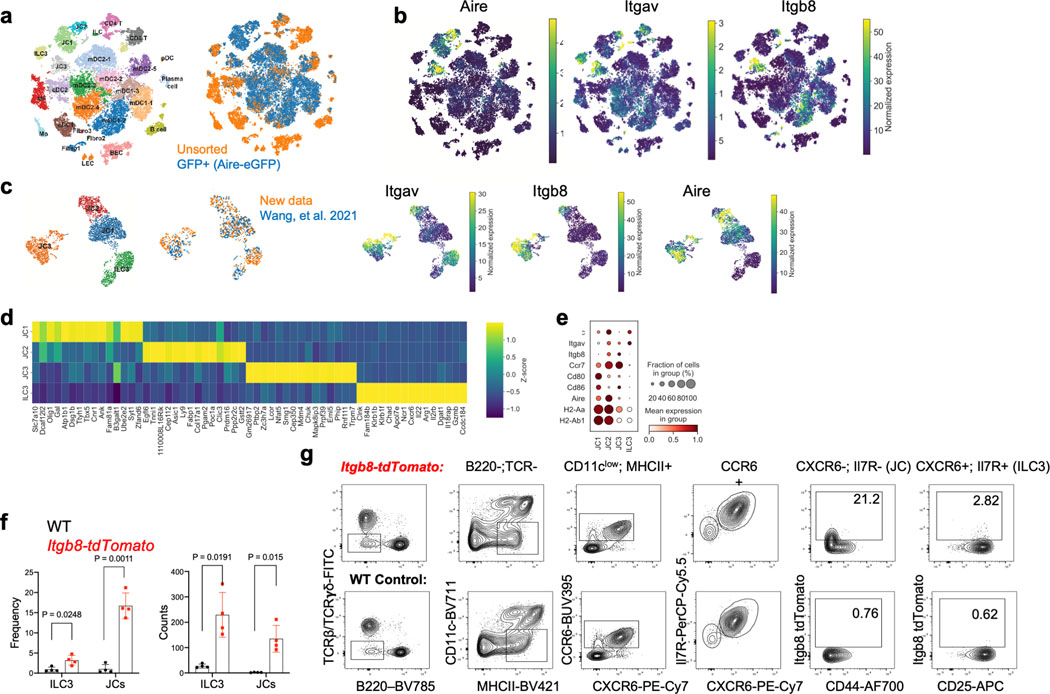
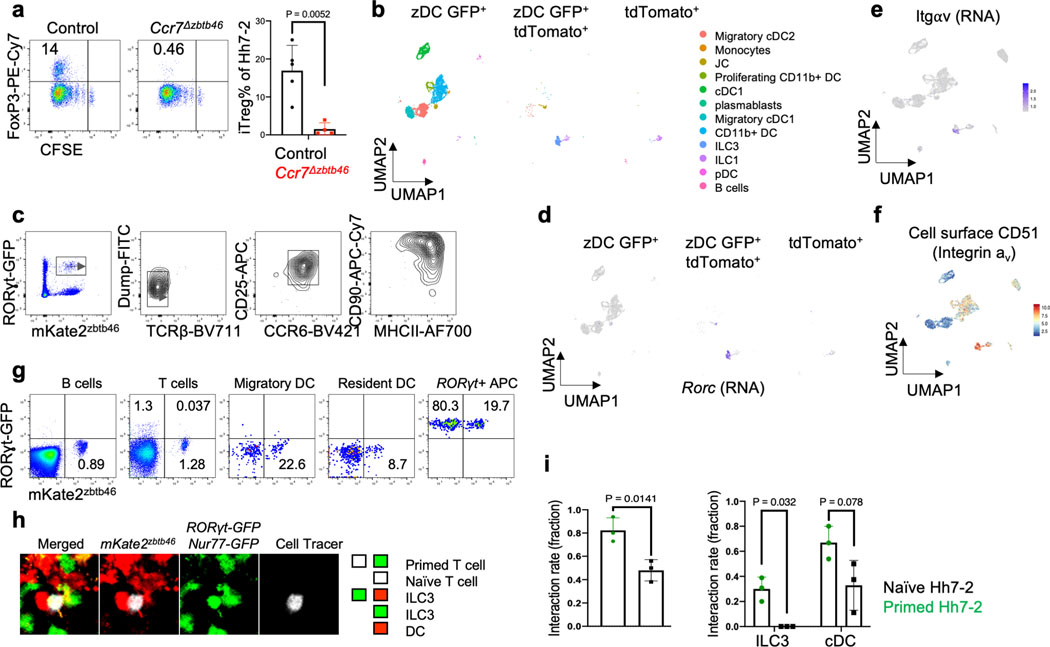
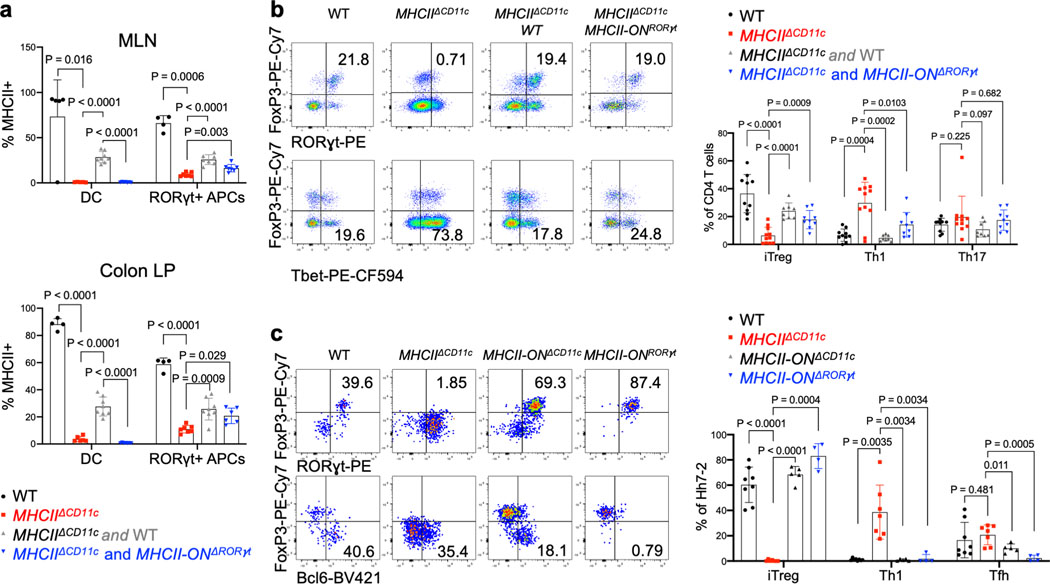
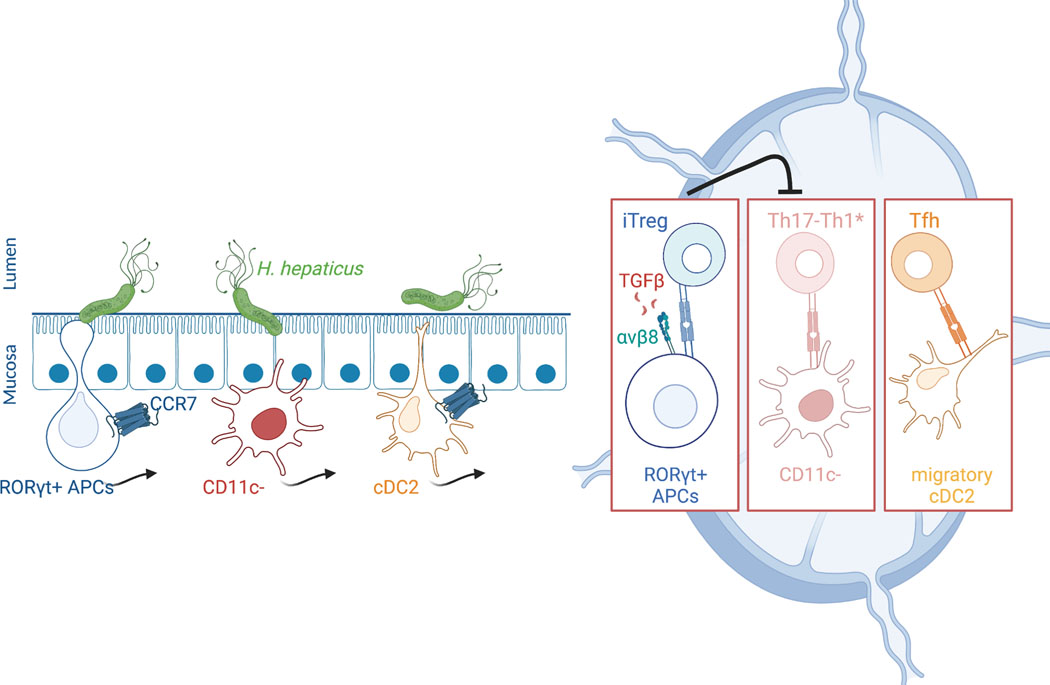
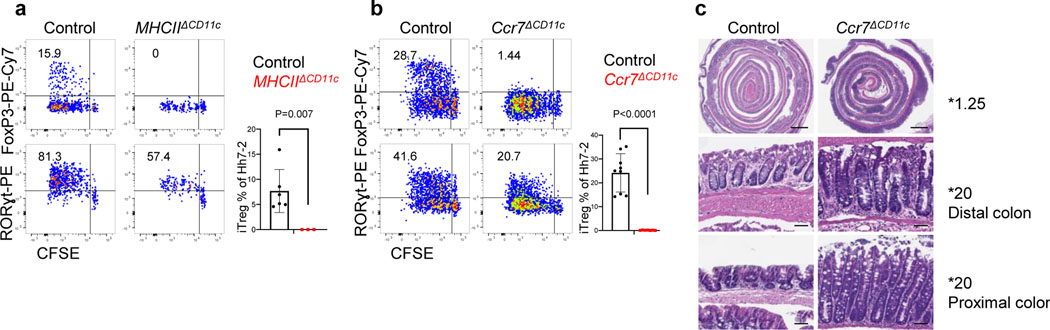
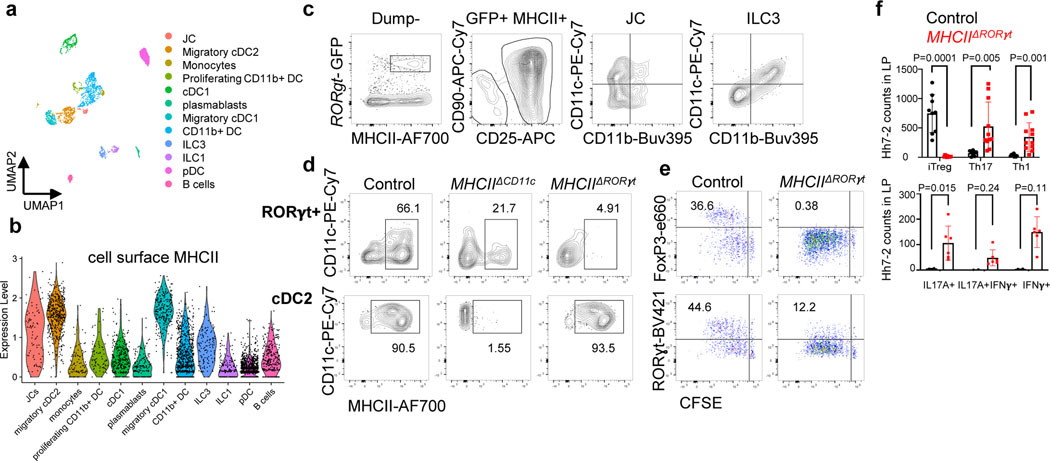
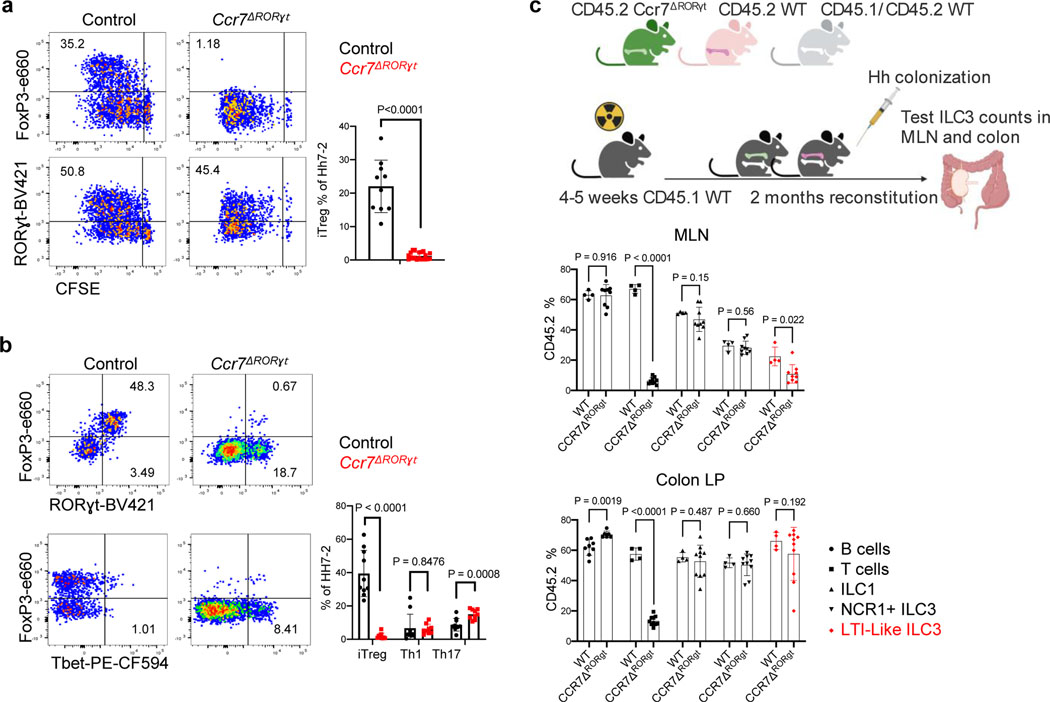
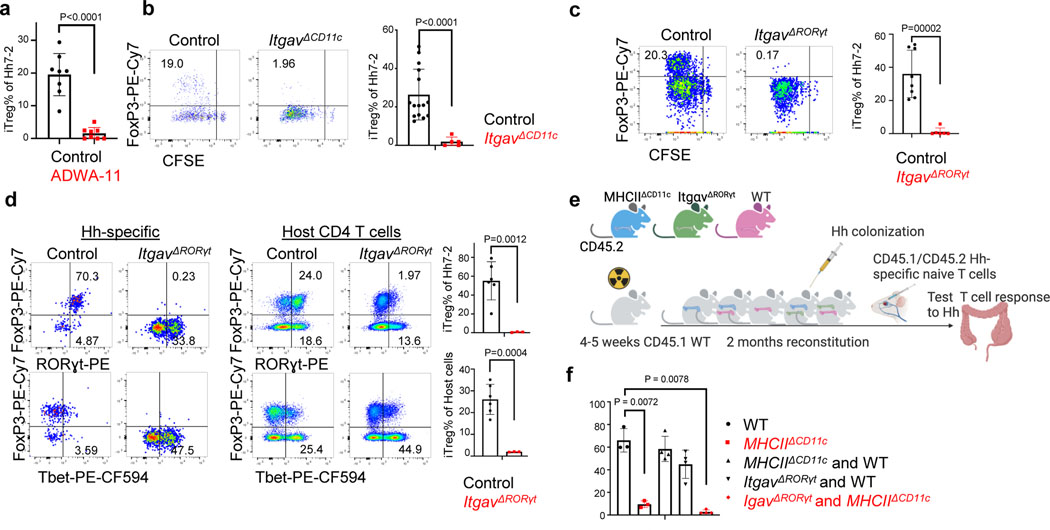
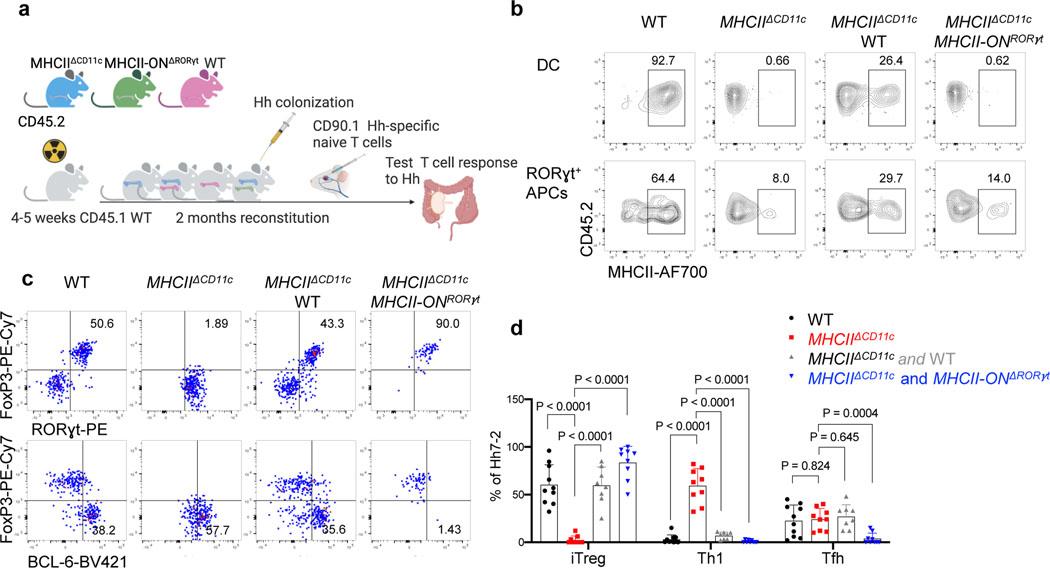
The mutualistic relationship of gut-resident microbiota and the host immune system promotes homeostasis that ensures maintenance of the microbial community and of a largely non-aggressive immune cell compartment1,2. The consequences of disturbing this balance include proximal inflammatory conditions, such as Crohn's disease, and systemic illnesses. This equilibrium is achieved in part through the induction of both effector and suppressor arms of the adaptive immune system. Helicobacter species induce T regulatory (Treg) and T follicular helper (TFH) cells under homeostatic conditions, but induce inflammatory T helper 17 (TH17) cells when induced Treg (iTreg) cells are compromised3,4. How Helicobacter and other gut bacteria direct T cells to adopt distinct functions remains poorly understood. Here we investigated the cells and molecular components required for iTreg cell differentiation. We found that antigen presentation by cells expressing RORγt, rather than by classical dendritic cells, was required and sufficient for induction of Treg cells. These RORγt+ cells-probably type 3 innate lymphoid cells and/or Janus cells5-require the antigen-presentation machinery, the chemokine receptor CCR7 and the TGFβ activator αv integrin. In the absence of any of these factors, there was expansion of pathogenic TH17 cells instead of iTreg cells, induced by CCR7-independent antigen-presenting cells. Thus, intestinal commensal microbes and their products target multiple antigen-presenting cells with pre-determined features suited to directing appropriate T cell differentiation programmes, rather than a common antigen-presenting cell that they endow with appropriate functions.


Conflict of interest statement

Competing interests

D.R.L. consults and has equity interest in Chemocentryx, Vedanta, Immunai and Pfizer Pharmaceuticals. All other authors declare no competing interests.

Figures

Extended Data Fig. 1.
Extended Data Fig. 1.. Cells targeted by CD11c-Cre and consequences for Hh-specific T cell differentiation.
a, Phenotype of Hh7–2 TCR transgenic T cells in the colon lamina propria at 10 days after transfer into Hh-colonized MHCIIΔCD11c (n=3) and control mice (n=7), as indicated. b, Phenotype of host CD4+ T cells from mice in (a); MHCIIΔCD11c (n=3) and control mice (n=10), as indicated. c, Cytokine profile of Hh7–2 T cells shown in (a); MHCIIΔCD11c (n=4) and control mice (n=3). d, Proliferation and differentiation of Hh-specific iTreg and Th17 cells in the MLN of Ccr7−/− (n=5) and littermate control mice (n=5). CFSE-labeled Hh7–2 T cells were analyzed at 3 days following their adoptive transfer into Hh-colonized mice. Data summarize two independent experiments. e-f, Transcription factor (e) and intracellular cytokine (f) profiles of Hh7–2 T cells in the large intestine of Ccr7ΔCD11c (n=7 or 5, for transcription factors and cytokines, respectively) and littermate control (n=5) mice, at 10 days after adoptive transfer. g-i, Proportion in MLN of Hh7–2 with the iTreg phenotype at 3 days after transfer into BATF3−/− (g) (n=7), IRF4ΔCD11c (h) (n=6), and huLangerin (CD207)-DTA (i) (n=12) mice (red) and indicated littermate controls (black). Data summarize at least two independent experiments. Representative flow panels and aggregate data are shown for each analysis. All statistics were calculated by unpaired two-sided Welch’s t-test. Error bars denote mean ± s.d. p-values are indicated in the figure.
Extended Data Fig. 2.
Extended Data Fig. 2.. Identification of CITE-seq-assigned clusters of sorted tdTomato-ONΔCD11c fate-mapped cells.
a, Stacked violin plots for selected (curated) and top DEG (data-driven) of tdTomato+ cells sorted from MLN of Hh-colonized mice. b, Stacked violin plots for selected (curated) cell surface markers for each cluster.
Extended Data Fig. 3.
Extended Data Fig. 3.. Phenotypic discrimination of ILC3 and JC.
a, Dot plots for selected (curated) DEG and cell surface markers for the indicated clusters, obtained from CITE-seq analysis of tdTomato-ONΔCD11c fate-mapped cells. b, Flow cytometry profiling of CXCR6, CD127(IL-7R), CCR6 CD25 and CD40 on ILC3 (red) and JC (blue), pre-gated on TCRβ, TCRγδ, B220, RORγt+, MHCII+. c, gating strategy for JC using cell surface staining as indicated. d, Flow cytometry profiling of JC and DC markers, showing that migratory cDC are excluded from CD11clow CCR6+ gating. e, TdTomato levels in ILC3 (TCRβ, TCRγδ, B220, MHCII+ CCR6+, Il7R+) and JC (TCRβ, TCRγδ, B220, MHCII+ CCR6+, Il7R) from the MLN of Hh-colonized tdTomato-ONCD11c fate-map mice.
Extended Data Fig. 4.
Extended Data Fig. 4.. Antigen presentation by RORγt+ cells is required for microbiota-induced iTreg cell differentiation.
a, MHCII expression in RORγt+ cells (top) and DC (bottom) from the MLN of Hh-colonized MHCIIΔCD11c mice (n=6 and 5) and littermate controls (n =10 and 8). RORγt+ cells were gated as TCRβ, TCRγδ, B220, RORγt+; DC were gated as TCRβ, TCRγδ, B220, CD90, CD11chigh. b, Bar graph showing frequency of iTreg among Hh7–2 T cells, measured as in Figure 2e. c-d, Representative dot plots showing Hh7–2 T cell differentiation (c) and cytokine (d) profiles in colon lamina propria at 22 days after adoptive transfer into Hh-colonized MHCIIΔRORγt and littermate controls. e, Representative and aggregate data of transcription factor profiles of host CD4+ T cells in colon lamina propria of mice shown in (c) and (d). f, Hh7–2 cell proliferation and differentiation in the MLN of H2-DMaΔRORγt (RORγt-Cre; H2-Dmaf/f) (n=11) and littermate controls (RORγt-Cre; H2-DMa+/f) (n=5) at 3 days after transfer of CFSE labeled naïve Hh7–2, cell proliferation and FoxP3 were assessed in cells isolated from C1 MLN. Representative flow cytometry (left) and aggregate data from multiple animals (right). Data summarize two independent experiments. All statistics were calculated by unpaired two-sided Welch’s t-test. Error bars denote mean ± s.d. p-values are indicated in the figure.
Extended Data Fig. 5.
Extended Data Fig. 5.. Differential requirements for CCR7 in iTreg and effector Th17 cell differentiation and analysis of Aire+ JC function in differentiation of Hh-specific iTreg cells.
a, Cell surface expression of CCR7 on CD11c-Cre fate-mapped ILC3 (TCRβ, TCRγδ, B220, MHCII+, CCR6+, IL-7R+) and JC (TCRβ, TCRγδ, B220, MHCII+, CCR6+, IL-7R) in the MLN. b-c, Analysis of DC counts in MLN (b) and large intestine (c) of WT and Ccr7ΔRORγt mixed bone marrow chimeric mice described in Figure 3c. Counts in the MLN of DC subsets derived from bone marrow (b); frequencies of CCR7+ among total colonic DCs (c) (n=4). Statistics were calculated using paired two-sided t-test. d, Analysis of CD45.2 frequencies within donor cells is presented for ILC3 (TCRβ, TCRγδ, B220, MHCII+, RORγt +, IL-7R+) and JC (TCRβ, TCRγδ, B220, MHCII+, RORγt +, IL-7R) in the MLN of WT and Ccr7ΔRORγt mixed bone marrow chimeric mice described in Figure 3c. e, Cell surface expression of CCR7 in colonic ILC3 (TCRβ, TCRγδ, B220, CD90+, RORγt+, CD25+, CD4+) from Ccr7ΔRORγt (n=3), Ccr7ΔCD11c (n=2) and control Hh-colonized mice (n=2). f, Cell surface expression of CCR7 and CD11b in ILC3-gated MLN cells (TCRβ, TCRγδ, B220, IL-7R+, CCR6+, CD25+) from Ccr7ΔCD11c (n=4) and control Hh-colonized mice (n=4). . g, Lethally irradiated mice were reconstituted with BM cells from CD45.2 Aire-DTR or CD45.2 WT mice. One month after reconstitution, mice were colonized with Hh, and one week later were treated with Diphtheria toxin (DT, Sigma-Aldrich) for 3 sequential days (at a dose of 25 ng/g mice). CD45.1/CD45.2 CFSE-labeled Hh7–2 T cells (1 × 10⁵) were transferred intravenously into the mice on the first day of DT treatment. Bar graph of proportion of proliferating Foxp3+ Hh7–2 T cells in the MLN of mice reconstituted with Aire-DTR BM (n=5) or with WT BM (n=4) (left); Aire mRNA in the spleen of the treated mice was blindly scored using RNAscope analysis. The experiment was performed once. h, Proliferation and differentiation of CFSE-labeled Hh7–2 T cells in the MLN of RORγt-Cre;Airef/f (n=5) and control Aire+/f littermates (n=7) at 3 days after adoptive transfer. Data summarize three independent experiments. All statistics, except for b and c, were calculated by unpaired two-sided Welch’s t-test. Error bars denote mean ± s.d. p-values are indicated in the figure.
Extended Data Fig. 6.
Extended Data Fig. 6.. Effect of integrin αvβ8 blockade or αv inactivation on microbiota-dependent T cell differentiation.
a, Expression of integrin αv (CD51) in fate-mapped RORγt+ cell subsets from MLN of wild type and ItgavΔRORγt mice. b, C1 MLN from ItgavΔCD11c (n=3) and littermate controls (n=4), 10 days after Hh colonization. c-d, Flow cytometry profiling of transcription factors and CCR6 in proliferating CFSE-labeled Hh7–2 in the MLN at 3 days after adoptive transfer into ItgavΔRORγt (n=3) and littermate control mice (n=3) (b) or into mice treated with ADWA11(n=4) (as in Fig. 4a) or untreated control littermates (n=4) (c). Summary data of results in (b) and (c) are shown below. e, Intracellular IFNγ and T-bet expression in PMA/Ionomycin-stimulated Hh7–2 T cells isolated from colon lamina propria of ItgavΔRORγt(n=3) and control littermates (n=5), 10 days after adoptive transfer. f, Frequency of iTreg cells among proliferating Hh7–2 in the MLN at 3 days after adoptive transfer into ItgavΔCD (n=4) and control littermates (n=7). Data summarize two independent experiments. g, Integrin αv and MHCII cell surface expression in ILC3 (gated as TCRβ, TCRγδ, B220, RORγt+, CD90+, CD25+ CD45.2+) isolated from MLN of bone marrow chimeric mice, reconstituted with different combinations of donor cells as indicated and colonized with Hh for 10 days. Data summarized below for control (n=3), MHCIIΔCD11c (n=3), MHCIIΔCD11c and WT (n=4), and MHCIIΔCD11c and ItgavΔRORγt (n=4) reconstituted mice. All Statistics were calculated by unpaired two-sided Welch’s t-test. Error bars denote mean ± s.d. p-values are indicated in the figure.
Extended Data Fig. 7.
Extended Data Fig. 7.. Itgav and Itgb8 expression in ILC3 and JC.
a, tSNE plot with Leiden clustering of scRNAseq of pooled GFP+ sorted and unsorted cells, as indicated, from pooled lymph nodes of Adig mice. b, tSNE feature plots showing Aire, Itgav, and Itgb8 levels in the cell clusters. c, UMAP plot of Aire+ JC and ILC3 populations from pooled datasets as indicated with associated feature plots. d, top differentially expressed genes per pseudobulk cluster in (c), shown by heatmap. e, dot plot of selected genes in JC and ILC3 clusters. f-g, aggregate results (f) and representative flow cytometry (g) of tdTomato+ JC and ILC3, gated as indicated, in C1 MLN of Itgb8-IRES-tdTomato mice (n=4) and littermate controls (n=4). Aggregate data (right) show percent tdTomato+ cells among total ILC3 and JC and number of reporter-positive cells in the C1 MLN of each mouse. We performed two independent experiments and data shown are from one representative experiment. All statistics were calculated by unpaired two-sided Welch’s t-test. Error bars denote mean ± s.d. p-values are indicated in the figure.
Extended Data Fig. 8.
Extended Data Fig. 8.. Analysis of RORγt-expressing cells in the MLN and intravital tracking of RORγt-expressing cells and DC interactions with Hh-specific T cells during priming in the MLN.
a, Hh7–2 proliferation and differentiation in MLN of Ccr7Δzbtb46 (n= 4) and control littermates (n=5), at 3 days after transfer of the naïve cells. Data in the right panel summarize three independent experiments. b, UMAP visualization of CITE-seq datasets obtained from 3 distinct sorted populations (GFP+, GFP+ tdTomato+ and tdTomato+) isolated from C1 MLN of Zbtb46-eGFP ; tdTomato-ONΔRORγt mice (n=2), analyzed by the WNN method. c, Flow cytometry analysis of fate-mapped C1 MLN cells from RORγt-eGFP;mKate2-ONΔzbtb46 mice, gated for the indicated cell subsets. d-e, Feature plot showing Rorc (d) and integrin αv (e) levels in the cell clusters identified in the CITE-seq analysis shown in (b); Positive cells are layered in front. g, Flow cytometry analysis of fate-mapped C1 MLN cells from RORγt-eGFP;mKate2-ONΔzbtb46 mice, gated for the indicated cell subsets (ILC3 were gated as TCRβ, TCRγδ, B220, MHCII+, RORγt-eGFP+, CCR6+, CD25+ and JC as TCRβ, TCRγδ, B220, MHCII+, RORγt-eGFP+, CD25). Note that there is incomplete excision of the transcriptional stop signal by zbtb46-Cre. h, Representative image of cell-cell interactions of recently primed Hh-specific T cells with DC and RORγt-expressing cells. Nur77-eGFP tracer-labeled Hh7–2 T cells were transferred into of RORγt-eGFP;mKate2-ONzbtb46 Hh-colonized mice. Cell colocalization of primed Hh7–2 (tracer dye+, GFP+) or naïve Hh7–2 (tracer dye+, GFP) T cells with cDC (mKate2+ with dendritic morphology), RORγt-expressing cells (eGFP+, mKate2+ or eGFP+ alone with amoeboid morphology), or both were visualized using intravital multiphoton microscopy of the C1 MLN at 15 h after transfer. Note that Cell Tracer fluorescent labeling provides clear spatial discrimination of RORγt-eGFP and Nur77-eGFP expressing cells. i, Quantification and graphical representation of the total (left) and individual rates of interaction of RORγt-expressing cells or cDC populations (right) with primed or naïve Hh7–2 T cells. Data summarize cell-cell interactions from six 0.25mm3 three-dimensional regions of C1 MLN, (n=72 total Hh7–2 T cells), (n=49 primed and 23 naïve Hh7–2 T cells). All statistics were calculated by unpaired two-sided Welch’s t-test. Error bars denote mean ± s.d. p-values are indicated in the figure.
Extended Data Fig. 9.
Extended Data Fig. 9.. Gain-of-function expression of MHCII in RORγt+ cells rescues bone marrow-derived iTreg cell differentiation.
a, Aggregate data showing MHCII frequency on donor-derived DC and RORγt+ cells in MLN and colon lamina propria from chimeric mice reconstituted with combinations of donor BM cells as indicated, with representative flow cytometry panel in Fig. 5b. MLN: WT (n=5), MHCIIΔCD11c (n=5), MHCIIΔCD11c and WT (n=8), MHCIIΔCD11c and MHCII-ONΔRORγt (n=7). Colon: WT (n=4), MHCIIΔCD11c (n=6), MHCIIΔCD11c and WT (n=8), MHCIIΔCD11c and MHCII-ONΔRORγt (n=6). b, Donor bone marrow-derived CD4+ T cell differentiation in colon lamina propria from chimeric mice reconstituted with combinations of BM cells as indicated. Representative flow panels (left) and aggregate data (right). WT (n=10), MHCIIΔCD11c (n=11), MHCIIΔCD11c and WT (n=8), MHCIIΔCD11c and MHCII-ONΔRORγt (n=9). Colon: WT (n=4), MHCIIΔCD11c (n=6), MHCIIΔCD11c and WT (n=8), MHCIIΔCD11c and MHCII-ONΔRORγt (n=7). c, Representative flow cytometry (left) and aggregate data (right) of Hh7–2 T cell differentiation in colon lamina propria of Hh-colonized bone marrow chimeric mice reconstituted with cells of indicated genotypes, 12 days after transfer of naive TCR transgenic T cells. WT (n=8), MHCIIΔCD11c (n=7), MHCII-ONΔCD11c (n=5), and MHCII-ONΔRORγt (n=4). Data summarize two or three independent experiments. All statistics were calculated by unpaired two-sided Welch’s t-test. Error bars denote mean ± s.d. p-values are indicated in the figure.
Extended Data Fig. 10.
Extended Data Fig. 10.. Schematic of the requirement of distinct APC subsets for T cell differentiation.
CCR7 and integrin αvβ8 are required in RORγt+ APCs for iTreg cell differentiation. Note that other APCs, with differential requirements for CCR7 expression, are involved in the priming and differentiation of pathogenic Th17 and Tfh cells.
Figure 1.
Figure 1.. Distinct requirements for antigen presentation and CCR7 expression in differentiation of iTreg versus pathogenic Th17 cells.
a-b, Hh-specific T cell proliferation and differentiation in Hh-colonized CD11c-Cre;I-Abf/f (MHCIIΔCD11c) (n=3) and I-Abf/f or CD11c-Cre;I-Abf/+ littermate control mice (n=6) (a) and in Ccr7ΔCD11c (n = 7) and littermate control mice (n = 9) (b). CFSE-labeled naïve TCR transgenic Hh7–2 T cells from the C1 MLN were assessed for cell proliferation and expression of FoxP3 and RORγt at 3 days after adoptive transfer. Representative flow cytometry (left) and aggregate results (right). Data summarize two (a) and three (b) independent experiments. c, Representative H&E histology in large intestine of mice with indicated genotypes. Scale bars are 1 mm and 50μm, for 1.25X and 20X. respectively. All statistics were calculated by unpaired two-sided Welch’s t-test. Error bars denote mean ± s.d. p-values are indicated in the figure.
Figure 2.
Figure 2.. Antigen presentation by RORγt+ cells is required for microbiota-induced iTreg cell differentiation.
a-b, UMAP visualization of the tdTomato-ONCD11c fate-map cell CITE-seq dataset, analyzed by the WNN method (a), and Violin plot showing MHCII protein levels in the different cell clusters (b). MLN cells from Hh-colonized tdTomato-ONCD11c fate-map mice were gated for TCRβ, TCRγδ, B220, and tdTomato+ cells were sorted for CITE-seq analysis. Cells were sorted from two mice and labeled by hashing antibodies (n=2). c, CD11c and CD11b staining of ILC3 and JC from MLN of Hh-colonized RORγt-eGFP mice, gated as indicated. d, MHCII expression in RORγt+ cells (top) and DCs (bottom) from the MLN of Hh-colonized mice of the indicated genotypes. RORγt+ cells were gated as TCRβ, TCRγδ, B220, RORγt+; DC were gated as TCRβ, TCRγδ, B220, CD90, CD11c+, CD11b+ SIRPα+. e, Hh7–2 cell proliferation and differentiation in MHCIIΔRORγt (n = 6) and I-Abf/f littermate control mice (n = 6) at 3 days after adoptive transfer into Hh-colonized mice. f, Hh7–2 T cell differentiation profiles (upper) and cytokine production (lower) in the large intestine lamina propria at 22 days after transfer into MHCIIΔRORγt (n=11) and littermate controls (n=9). Differentiation was assessed by expression of Foxp3, RORγt with or without T-bet, and T-bet. Data summarize two independent experiments. All statistics were calculated by unpaired two-sided Welch’s t-test. Error bars denote mean ± s.d. p-values are indicated on the figure.
Figure 3.
Figure 3.. RORγt+ cells require CCR7 to promote iTreg cell differentiation.
a-b, Representative flow cytometry profiles (left) and aggregate data (right) for Hh7–2 T cell proliferation and differentiation in MLN at 3 days (a) and their phenotype in large intestine at 14 days (b) following adoptive transfer into Ccr7ΔRORγt and littermate control mice. MLN: Control mice n=10, Ccr7ΔRORγt mice n=20; LI: Control mice n=10, Ccr7ΔRORγt mice n=9. Data summarize three independent experiments. Statistics were calculated by unpaired two-sided Welch’s t-test. c, Analysis of CCR7 requirement for RORγt+ cell accumulation in the MLN. Irradiated CD45.1 mice were reconstituted with equal number of bone marrow cells from CD45.2 Ccr7ΔRORγt and CD45.1/CD45.2 WT mice or with CD45.2 WT and CD45.1/CD45.2 WT mice as controls. Scheme is shown at the top (created with BioRender.com). Aggregate data shows the frequency in MLN and colon lamina propria of CD45.2 WT (n=4) or CD45.2 Ccr7ΔRORγt (n=9) cells within each subset, as indicated. Data summarize three independent experiments. All statistics were calculated by unpaired two-sided Welch’s t-test. Error bars denote mean ± s.d. p-values are indicated in the figure.
Figure 4.
Figure 4.. Role of integrin αvβ8 in RORγt+ antigen presenting cell-dependent iTreg cell differentiation.
a, Frequency of iTreg cells among proliferating donor-derived Hh-specific cells in the MLN at 3 days after transfer of naïve CFSE-labeled Hh7–2 T cells into mice treated with 200μg of ADWA11 blocking antibody (n=8) or left untreated (n=8), on the day of adoptive transfer. Data summarize three independent experiments. b, Hh7–2 T cell proliferation and differentiation in the MLN of ItgavΔCD11c (n=5) and littermate controls (n=15) at 3 days after adoptive transfer. Data summarize three independent experiments. c, Proliferation and differentiation of Hh-specific iTreg cells in the MLN of ItgavΔRORγt (n=6) and littermate control mice (n=8). CFSE-labeled Hh7–2 T cells were analyzed at 3 days following their adoptive transfer into Hh-colonized mice. Representative flow cytometry profiles (left) and aggregate data (right). Data summarize three independent experiments. d, Transcription factor expression in Hh7–2 T cells (left panels) and in endogenous CD4+ T cells (right panels) from colon lamina propria (LP) at 10 days after adoptive transfer into ItgavΔRORγt mice (n=3) and control littermates (n=6). Data summarize two independent experiments. Representative dot plots and aggregate data are shown (right panels). e, Scheme for mixed bone marrow chimeric mouse experiment, with control, ItgavΔRORγt or MHCIIΔCD11c cells administered to irradiated host mice (created with BioRender.com). f, Bar graphs showing iTreg frequency among Hh7–2 T cells in the colon LP at 10 days after their transfer into the bone marrow chimeric mice, reconstituted with different combinations of donor cells as indicated. Control mice (n=3), MHCIIΔCD11c (n=3), MHCIIΔCD11c and WT (n=4), ItgavΔRORγt and WT (n=4) and MHCIIΔCD11c and ItgavΔRORγt (n=4). All statistics were calculated by unpaired two-sided Welch’s t-test. Error bars denote mean ± s.d. p-values are indicated in the figure.
Figure 5.
Figure 5.. Antigen presentation by RORγt+ cells is sufficient to promote iTreg cell differentiation.
a, Experimental design (created with BioRender.com). b, MHCII frequency in donor bone marrow-derived cDC2 (gated TCRβ, TCRγδ, B220, CD45.2+, CD11c+, CD11b+ Sirpa+) and RORγt+ cells (gated as TCRβ, TCRγδ, B220, RORγt+, CD45.2+) in MLN from chimeric mice reconstituted with combinations of donor BM cells as indicated. c, Representative flow cytometry of Hh7–2 T cell differentiation in colon lamina propria of Hh-colonized bone marrow chimeric mice, 12 days after transfer of naive TCR transgenic T cells. d, Aggregate data for differentiation of Hh7–2 T cells in bone marrow chimeric mice reconstituted with cells of indicated genotypes. WT (n=10), MHCIIΔCD11c (n=9), MHCIIΔCD11c and WT (n=8), MHCIIΔCD11c and MHCII-ONΔRORγt (n=9). Data summarize three independent experiments. All statistics were calculated by unpaired two-sided Welch’s t-test. Error bars denote mean ± s.d. p-values are indicated in the figure.

Comment in

References

    1. Hooper LV, Littman DR & Macpherson AJ Interactions between the microbiota and the immune system. Science 336, 1268–1273, doi:10.1126/science.1223490 (2012). - DOI - PMC - PubMed
    1. Ansaldo E, Farley TK & Belkaid Y Control of Immunity by the Microbiota. Annu Rev Immunol 39, 449–479, doi:10.1146/annurev-immunol-093019-112348 (2021). - DOI - PubMed
    1. Xu M et al. c-MAF-dependent regulatory T cells mediate immunological tolerance to a gut pathobiont. Nature 554, 373–377, doi:10.1038/nature25500 (2018). - DOI - PMC - PubMed
    1. Chai JN et al. Helicobacter species are potent drivers of colonic T cell responses in homeostasis and inflammation. Science immunology 2, doi:10.1126/sciimmunol.aal5068 (2017). - DOI - PMC - PubMed
    1. Wang J, Lareau CA, Bautista JL, Gupta AR, Sandor K, Germino J, Yin Y, Arvedson MP, Reeder GC, Cramer NT, Xie F, Ntranos V, Satpathy AT, Anderson MS, Gardner JM Single-cell multiomics defines tolerogenic extrathymic Aire-expressing populations with unique homology to thymic epithelium. Sci. Immunol. 6 (2021). - PMC - PubMed

Publication types

MeSH terms

Substances