. 2022 Oct;610(7933):744-751.
doi: 10.1038/s41586-022-05141-x. Epub 2022 Sep 7.

ILC3s select microbiota-specific regulatory T cells to establish tolerance in the gut

Collaborators, Affiliations

ILC3s select microbiota-specific regulatory T cells to establish tolerance in the gut

Mengze Lyu et al. Nature. 2022 Oct.

Abstract

Microbial colonization of the mammalian intestine elicits inflammatory or tolerogenic T cell responses, but the mechanisms controlling these distinct outcomes remain poorly understood, and accumulating evidence indicates that aberrant immunity to intestinal microbiota is causally associated with infectious, inflammatory and malignant diseases1-8. Here we define a critical pathway controlling the fate of inflammatory versus tolerogenic T cells that respond to the microbiota and express the transcription factor RORγt. We profiled all RORγt+ immune cells at single-cell resolution from the intestine-draining lymph nodes of mice and reveal a dominant presence of T regulatory (Treg) cells and lymphoid tissue inducer-like group 3 innate lymphoid cells (ILC3s), which co-localize at interfollicular regions. These ILC3s are distinct from extrathymic AIRE-expressing cells, abundantly express major histocompatibility complex class II, and are necessary and sufficient to promote microbiota-specific RORγt+ Treg cells and prevent their expansion as inflammatory T helper 17 cells. This occurs through ILC3-mediated antigen presentation, αV integrin and competition for interleukin-2. Finally, single-cell analyses suggest that interactions between ILC3s and RORγt+ Treg cells are impaired in inflammatory bowel disease. Our results define a paradigm whereby ILC3s select for antigen-specific RORγt+ Treg cells, and against T helper 17 cells, to establish immune tolerance to the microbiota and intestinal health.


Conflict of interest statement

The authors declare no other competing interests.

Figures

Extended Data Fig. 1 |
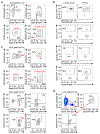
Extended Data Fig. 1 |. scRNA-seq profiling of RORγt+ cells from mouse mLN.
a, Gating strategy to sort GFP+TCRβ+ and GFP+TCRβ cells (1:1, n = 3) for scRNA-seq. b, Doublet test showing cluster 8 as doublets. c, d, Representative flow cytometry plot of the frequency of RORγt+ cells in CD127+ ILC fractions (CD45+CD3εCD5NK1.1Ly6GTCRγ/δB220CD11bCD11cKLRG1CD127+), CD19+ B cell fractions (CD45+CD19+) and CD172a+ cDC2 fractions (CD45+ CD3εCD5NK1.1Ly6GTCRγ/δB220CD64CD11c+MHCII+XCR1CD172a+) from RORγt-eGFP reporter mice (n = 3) (c) and RorcCre x Rosa26lsl-YFP fate mapped mice (n = 3) (d). e-k, Violin plot showing the expression of Rorc (e), Cd3e (f), Foxp3 (g), Xcr1 (h), Clec9a (i), Clec10a (j), Clec12a (k) among all the identified clusters.
Extended Data Fig. 2 |
Extended Data Fig. 2 |. Characterization of RORγt+ eTACs and LTi-like ILC3s in mouse mLN.
a, Violin plot showing the expression of Siglecg and Dpp4 among all the identified clusters of non-T lymphocytes. b, Gating strategy to identify ILC3s and RORγt+ eTACs from mLN of RORγt-eGFP reporter mice (n = 4) for data shown in Fig. 1e, f. c, Quantification of indicated genes expression in LTi-like cells and RORγt+ eTACs shown in Fig. 1e (n = 4). Data in c are representative of three independent experiments. Data are shown as means ± SEM, statistics shown in c are obtained by unpaired Student’s t-test (two-tailed).
Extended Data Fig. 3 |
Extended Data Fig. 3 |. Gating strategies and fate mapping of RORγt+ eTACs and LTi-like ILC3s in mouse mLN.
a, Gating strategy to identify LTi-like ILC3s and RORγt+ eTACs for fate mapping analyses in Fig. 1g, h. b, Representative flow cytometry plots showing expression of CD127, CD11c, Clec9a and Aire among “fate-mapped” LTi-like ILC3s and RORγt+ eTACs in mLN shown in Fig. 1g, h. c, Gating strategy to identify LTi-like ILC3s, RORγt+ eTACs and RORγt+ Tregs of mLN in Fig. 2c–l, Fig. 4e, the same gating strategy applied to the LI-LP. d, Gating strategy to identify H. Hepaticus (Hh)-specific CD4+ T cells in mouse LI-LP.
Extended Data Fig. 4 |
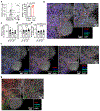
Extended Data Fig. 4 |. Immunofluorescence and quantification of different cell types in mLN.
a, Representative flow cytometry plots of frequency (left) and percentage (right) of RORγt+FoxP3+ Tregs and RORγt+FoxP3 Th17 cells among total RORγt+CD4+ T cells in mLN of WT mice (n = 5). b, Tile-scanned (left) and magnified (right) images of mLN stained for expression of IL7Rα (red), CD3 (blue), FOXP3 (cyan), RORγt (green) and DAPI (grey). c-e, Quantification of percentage of RORγt+ Tregs among total Tregs (c), total numbers per mm2 of ILC3s (d) and RORγt+ Tregs (e) in interfollicular zone of mLN of WT-1 (n = 11 areas), WT-2 (n = 8 areas) and WT-3 (n = 12 areas) mice. f, Tile-scanned images and serial sections of mLN stained for expression of IL7Rα (red), CD11c (blue), FOXP3 (cyan), RORγt (green) and DAPI (grey). Left panel is without IL7Rα and RORγt staining, middle panel is without FOXP3 staining, and right panel is a merge with a magnified image. g, Tile-scanned (left) and magnified (right) images of mLN stained for expression of CD3 (red), FOXP3 (cyan), CD11c (green) and DAPI (grey). Scale bars: 50 μm, 20 μm (in magnified images). Data in a, b, f, g are representative of two independent experiments. Data in c-e are representative of two independent experiments containing a total of 5 mice. Data are shown as means ± SEM, statistics shown in a are obtained by unpaired Student’s t-test (two-tailed).
Extended Data Fig. 5 |
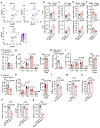
Extended Data Fig. 5 |. MHCII+ ILC3s selectively regulate T cell homeostasis in the gut.
a, UMAP plots of scRNA-seq data showing expression of H2-Ab1, H2-Ab1 and Cd74 are enriched in clusters of LTi-like ILC3s and RORγt+ eTACs across all the identified clusters in mouse mLN. b-e, Cell numbers of CD4+ T cells (b), Th17 cells (c), RORγtTregs (d) and RORγt+ Tregs (e) in mLN (upper panel) and LI-LP (lower panel) of H2-Ab1fl/fl and MHCIIΔILC3 mice (n = 8, pooled from 2 independent experiments). f-k, Large intestine of H2-Ab1fl/fl (n = 6) and Cd4Cre H2-Ab1fl/fl (MHCIIΔT cell) mice (n = 4) (f, g), H2-Ab1fl/fl (n = 4) and Il5Cre H2-Ab1fl/fl (MHCIIΔILC2) mice (n = 6) (h, i), Rorcfl/fl (n = 10) and Ncr1Cre Rorcfl/fl mice (n = 9) (j, k) were analyzed. Proportion of MHCII-expressing CD4+ T cells (f), ILC2s (h) and ILC3s (j). Frequency of each subset among CD4+ T cells and RORγt+ Tregs among total Tregs (g, i, k). Th17: Foxp3RORγt+; Treg: Foxp3+; Th1: Foxp3RORγT-bet+; Th2: Foxp3RORγtGata3+. l, Quantification of RORγt+ Tregs among total CD4+ T cells in LI-LP of Airefl/fl and RorcCreAirefl/fl mice (n = 5). m, n, Quantification of eTACs among total CD127CD90 cells (m) and LTi-like ILC3s among CD45+CCR6+ cells (n) in mLN of Rorcfl/fl and AireCreRorcfl/fl mice (n = 5). o, Quantification of MHCII expression among eTACs (o, left) and LTi-like ILC3s (o, right) in mLN of H2-Ab1fl/fl and AireCreH2-Ab1fl/fl mice (n = 4). p, Quantification of MHCII expression among DCs in mLN of H2-Ab1fl/fl and Clec9aCreH2-Ab1fl/fl mice (n = 4). Data are representative of two independent experiments unless otherwise indicated. Data shown as mean ± SEM. Statistics in f, h, j, l-p, right of g, i, k are obtained by unpaired Student’s t-test. Statistics shown in left of g, i, k are obtained by multiple unpaired t-test. Statistics are calculated by two-tailed test.
Extended Data Fig. 6 |
Extended Data Fig. 6 |. LTi-like ILC3s support RORγt+ Tregs in a co-culture system.
a-c, Sort-purified RORγt+CD4+ T cells and LTi-like ILC3s from LI-LP and mLN (n = 6 or 5 or 3 per group as technical replicates) were co-cultured for 72 hours and RORγt+ Tregs were analyzed by flow cytometry. Frequency and cell number of RORγt+ Tregs (a, RORγt+Foxp3+ among CD4+ T cells), MFI of Bim (b) and Nur77 (c) in RORγt+ Tregs. d, e, Dead cells were quantified in RORγt+ Tregs (d) and Th17 cells (e) after co-culture with or without LTi-like ILC3s for 72 hours. RORγt+CD4+ T cells and LTi-like ILC3s were sort-purified from mLN and LI-LP and pooled for co-culture assay (n = 12, each dot represents samples pooled from 2 mice). Data in a-c are representative of two independent experiments. Data in d, e are pooled from two independent experiments. Data are shown as mean ± SEM, statistics shown in d, e were obtained by unpaired Student’s t-test (two-tailed).
Extended Data Fig. 7 |
Extended Data Fig. 7 |. MHCII+ LTi-like ILC3s select for microbiota specific RORγt+ Tregs.
a, H. hepaticus (Hh)-specific and/or SFB-specific CD4+ T cells were transferred to H2-Ab1fl/fl and MHCIIΔILC3 mice colonized with H. hepaticus 2 weeks before experiment as shown in Fig. 3 a–h, k, l. b, c, Frequency of CD44+ ratio among SFB-specific (b) or Hh-specific (c) CD4+ T cells were analyzed in Peyer’s patch for SFB (CD45.1CD90.1+CD4+ T cells) and in LI-LP for Hh-specific (CD45.1+CD90.1CD4+ T cells) transgenic T cells (n = 4). d, Quantification of RORγt+ Tregs and Th17 cells among total CD4+ T cells in LI-LP of Rorcfl/fl and Foxp3CreRorcfl/fl mice (n = 4). e, f, Quantification of MHCII expression on LTi-like ILC3s (n = 9) (e) and eTACs (n = 4) (f) in mLN of H2-Ab1fl/fl and Il22CreH2-Ab1fl/fl mice. g, Quantification of RORγt+ Tregs (among Hh-specific CD4+ T cells) and Th17 cells (among Hh-specific CD4+ T cells) were analyzed in LI-LP of H2-Ab1fl/fl and Il22CreH2-Ab1fl/fl mice (n = 9). h, Representative flow cytometry plots of the frequency of MHCII expression on ILC3s, DCs in LI-LP of MHCIIneg and MHCIIILC3+ mice (n = 6) as shown in Fig. 3j. i, Frequency of CD44hiCD62Llo ratio among Hh-specific CD4+ T cells were analyzed in mLN and LI-LP for Hh-specific CD4+ T cells as shown in Fig. 3k, l (n = 6). j, k, RORγt+ Tregs in LI-LP of H2-Ab1fl/fl and MHCIIΔILC3 mice (n = 4) were analyzed by flow cytometry. Histogram and MFI of Bim (j). Proportions of Ki-67 positive cells (k). l, Quantification of RORγt+ Tregs among CD4+ T cells in LI-LP of Il2fl/fl and RorcCreIl2fl/fl mice (n = 4). m, Quantification of CD25 staining or IL-2 binding in mLN of WT mice (n = 3). Naive T cells: CD44loCD62Lhi; effector T: CD44hiCD62Llo; Th17 cells: RORγt+FoxP3; Tregs: FoxP3+; RORγt+Tregs: RORγt+FoxP3+. Data in e, g are pooled from two independent experiments with similar results. Data in b-d, f, i-l are representative of two independent experiments. Data are shown as mean ± SEM, statistics shown in m are obtained by one-way ANOVA with Tukey’s multiple comparisons test, statistics shown in b-g, i-l are obtained by unpaired Student’s t-test (two-tailed).
Extended Data Fig. 8 |
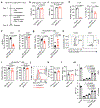
Extended Data Fig. 8 |. Itgav on LTi-like ILC3s contributes to the selection of microbiota-specific RORγt+ Tregs.
a, Representative flow cytometry plot of the frequency of Itgav expression on LTi-like ILC3s and eTACs in mLN of Itgavfl/fl and RorcCreItgavfl/fl mice as shown in Fig. 4d (n = 5). b-d, Quantification of Itgav on CD4+ T cells (b), LTi-like ILC3s (c) and eTACs (d) in mLN of Itgavfl/fl and Cd4CreItgavfl/fl mice (n = 6). e, Quantification of RORγt+ Tregs in mLN of Itgavfl/fl and Cd4CreItgavfl/fl mice (n = 6). f, H. Hepaticus (Hh)-specific CD4+ T cells were transferred to Itgavfl/fl and RorcCreItgavfl/fl mice colonized with H. hepaticus 14 days before experiment related to Fig. 4f. Data in b-e are representative of two independent experiments. Data are shown as mean ± SEM, statistics shown in b-e are obtained by unpaired Student’s t-test (two-tailed).
Extended Data Fig. 9 |
Extended Data Fig. 9 |. Gating strategy for ILC3s and T cell subsets in the human intestine.
a, Gating strategy to sort ILCs and T cells from small intestine of the IBD patient for scRNA-seq in Fig. 5. b, Gating strategy to demonstrate the ILC3s and RORγt+ Tregs shown in Fig. 5.
Extended Data Fig. 10 |
Extended Data Fig. 10 |. ILC3s select microbiota specific Tregs to establish tolerance in the gut.
a, Violin plot of CD3E expression among clusters of scRNA-seq data as shown in Fig. 5a. b, Bar graph showing the composition of non-T lymphocytes as indicated in Fig. 5a in non-inflamed tissue (NI) versus inflamed tissue (Infla). c, Bar graph showing the composition of ILC3 lymphocytes in non-inflamed tissue (NI) versus inflamed tissue (Infla) from human IBD samples as published. d, e, A dot plot showing the mean expression (colour) of indicated genes in ILC3 cluster (d) and Treg cluster (e) in non-inflamed versus inflamed tissue from human IBD samples as published. f, Correlation analyses between the RORγt+ Tregs (RORγt+Helios among CD4+ T cells) and Th17 cells (RORγt+FoxP3 among CD4+ T cells) in the cohort of CD patients as in Fig.5d, i, j. g, h, Quantification of frequency of ILC3s among CD127+CD117+ subset (g) and RORγt+ Tregs among total Tregs (h) in a second independent cohort of individuals. Healthy donor n = 15, Crohn’s disease (CD) patients n = 15. i, Correlation analyses between the ILC3 (ILC3 among CD127+CD117+ subset) and RORγt+ Tregs (RORγt+ Helios among FoxP3+ Tregs) in a second independent cohort of human samples as in (g, h). j, LTi-like ILC3s are necessary and sufficient in selecting for the differentiation fate of microbiota specific RORγt+ Tregs, and selecting against Th17 cells, via antigen presentation with contributions from integrin αv and gradients of competition for IL-2. This collectively enforces immunologic tolerance to microbiota and maintains intestinal homeostasis. Data in g, h are shown as means ± SEM, statistics shown in g, h are performed using Mann–Whitney U-test (unpaired), correlative analyses in f, i are compared by Pearson’s rank correlation coefficient (R2). Statistics are calculated by two-tailed test.
Fig. 1 |
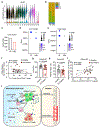
Fig. 1 |. Single-cell resolution of RORγt+ adaptive and innate lymphocytes in the mLN.
a, Uniform manifold approximation and projection (UMAP) of scRNA-seq data from RORγt+ cells in mesenteric lymph node (mLN) from healthy RORγt-eGFP reporter mice. Treg: regulatory T cells; LTi-like ILC3: lymphoid tissue inducer-like group 3 innate lymphoid cells; eTACs: extrathymic Aire-expressing cells; ILC2: group 2 innate lymphoid cells. TCRβ+ GFP+ and TCRβ GFP+ cells pooled from 3 mice and 12,948 cells were sequenced. b, c, Dot plot showing the mean expression (color) of indicated genes in clusters grouped by adaptive lymphocytes (b) and innate lymphocytes (c), dot size represents the proportion of cells in a cluster with the gene detected. d, Volcano plot of differentially expressed genes between cluster 2 and cluster 6 of scRNA-Seq dataset. e, Histogram examination of indicated genes expression in LTi-like ILC3s (black line) and RORγt+ eTACs (red line) from the mLN of RORγt-eGFP reporter mice. f, qPCR analysis of Aire expression in sort-purified LTi-like ILC3s and RORγt+ eTACs from mLN, relative to Hprt (n = 3). g,h, Frequencies of “fate-mapped” LTi-like ILC3s and RORγt+ eTACs in the mLN of CD127-Cre (n = 3), CD11c-Cre (n = 3), CLEC9A-Cre (n = 4) (g) and AIRE-Cre fate-mapping mice (n = 4) (h). ND, not detected. Data in f-h are representative of two or three independent experiments, shown as means ± SEM, statistics shown in f, g, h are obtained by unpaired Student’s t-test (two-tailed). Statistics in d and Supplementary Table 1 were obtained by Wilcoxon test as implemented by Seurat, red dots are significantly different.
Fig. 2 |
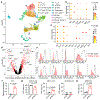
Fig. 2 |. LTi-like ILC3s select for microbiota specific RORγt+ Tregs via MHCII.
a, Left (images), tile-scanned (left) and magnified (column 2) images of mLN, and serial sections (columns 3–5) showing the same interfollicular area as in the left image stained for ILC3s (CD3IL-7Rα+RORγt+) and RORγt+ Treg cells (CD3+IL7RαFOXP3+RORγt+); the white asterisk indicates the association between ILC3s and RORγt+ Treg cells. Scale bars, 50 μm (left), 10 μm (column 2) and 2 μm (columns 3–5). Right, quantification of the percentage of RORγt+ Treg cells in association with ILC3s in the interfollicular zone (n = 3). b, Representative plots of the frequency of MHCII on LTi-like ILC3s in mLN. c, Quantification of MHCII expression on major MHCII-expressing cells from mLN and LI-LP of H2-Ab1fl/fl (n = 5 for B cells (B), monocytes (Mo), macrophages (Mf), dendritic cells (DC), conventional type I and 2 dendritic cells (cDC1 and cDC2) and neutrophils (Neu); n = 4 for ILC2, ILC3 and eTACs) and MHCIIΔILC3 mice (n = 4). d-g, Representative flow cytometry plot of the frequency (% of CD4+ T cells) (d, f) and quantification (e, g) of RORγt+ Tregs in mLN and LI-LP of H2-Ab1fl/fl and MHCIIΔILC3 mice (n = 9). h-l, Quantification of RORγt+ Tregs (% of Tregs) in mLN of MHCIIΔILC3 mice (n = 5) (h), AireCreH2-Ab1fl/fl mice (n = 4) (i), RorcCreAirefl/fl mice (n = 5) (j), AireCreRorcfl/fl mice (n = 5) (k) and Clec9aCreH2-Ab1fl/fl mice (n = 4) (l) relative to littermate control mice. Data in d-g are pooled from two independent experiments. Data in h-l are representative of two independent experiments. Data are shown as mean ± SEM, statistics shown in c are obtained by multiple unpaired t-test (two-tailed), statistics shown in e, g, h-l are obtained by unpaired Student’s t-test (two-tailed).
Fig. 3 |
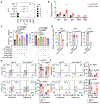
Fig. 3 |. MHCII+ ILC3s are sufficient for selection of microbiota specific RORγt+ Tregs.
a–d, Flow cytometry plots (a,c) and frequencies (b,d) of RORγt+ Tregs (RORγt+FOXP3+) and Th17 cells (RORγt+FOXP3) in Peyer’s patch for SFB-specific (CD45.1CD90.1+CD4+ T cells; a,b) and in LI-LP for H. hepaticus-specific (CD45.1+CD90.1CD4+ T cells; c,d) from H2-Ab1fl/fl and MHCIIΔILC3 mice (n = 4). e, f, Representative flow cytometry plots of the frequency (T-bet+ among H. hepaticus-specific RORγt+FoxP3 Th17 cells) (e) and quantification (f) of T-bet+ H. hepaticus-specific Th17 in LI-LP of H2-Ab1fl/fl and MHCII∆ILC3 mice as shown in (c) (n = 4). g, h, Representative flow cytometry plots of the frequency (IL-17A+ and/or IFNγ+ cells among H. hepaticus-specific RORγt+FoxP3 Th17 cells) (g) and quantification (h) of IFNγ+ and IFNγ+IL-17A+ cells among H. hepaticus-specific Th17 in LI-LP of H2-Ab1fl/fl and MHCII∆ILC3 mice as shown in (c) (n = 4). i, j, Representative flow cytometry plots of the frequency (i) and quantification (j) of MHCII expression on ILC3s, DCs and eTACs (gated as CD127CD90) in mLN and LI-LP of MHCIIneg and MHCIIILC3+ mice (n = 6 or 9). ND, not detected. k, l, Representative flow cytometry plots of the frequency and quantification of RORγt+ Tregs (RORγt+FoxP3+ among H. hepaticus-specific CD4+ T cells) were analyzed for transgenic T cells in mLN (k) and LI-LP (l) of MHCIIneg and MHCIIILC3+ mice (n = 6). Data in a-h are representative of two independent experiments. Data in i-l are pooled from two or three independent experiments. Data are shown as mean ± SEM, statistics are obtained by unpaired Student’s t-test (two-tailed).
Fig. 4 |
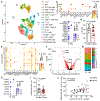
Fig. 4 |. Itgav on LTi-like ILC3s promotes RORγt+ Treg homeostasis.
a, Dot plot showing selected genes expressed in ILC3 (y axis) and Treg (x axis) cell clusters. b, qPCR analysis of Itgb1, Itgb3, Itgb5, Itgb6 and Itgb8 expression in sort-purified LTi-like ILC3s from LI-LP (n = 7) and mLN (n = 6), relative to Hprt. ND, not detected. c, Sort-purified RORγt+CD4+ T cells and LTi-like ILC3s from LI-LP and mLN (n = 12, each dot represents samples pooled from 2 mice) were co-cultured for 72 hours under indicated conditions, and frequencies of RORγt+ Tregs and Th17 cells were analyzed by flow cytometry. d, Quantification of Itgav on LTi-like ILC3s and eTACs in mLN (n = 5), and quantification of Itgav on ILC3s in LI-LP of Itgavfl/fl and RorcCreItgavfl/fl mice (n = 5 or 3 per group). e, Representative flow cytometry plot of the frequency (% in CD4+ T cells) (left panel) and quantification (right panel) of RORγt+ Tregs and Th17 cells in mLN (top panel) and LI-LP (bottom panel) of Itgavfl/fl (n = 9) and RorcCreItgavfl/fl mice (n = 8). f, Representative flow cytometry plot of the frequency (left panel) and quantification (right panel) of RORγt+ Tregs (RORγt+FoxP3+ among H. hepaticus-specific CD4+ T cells) and Th17 cells (RORγt+FoxP3 among H. hepaticus-specific CD4+ T cells) were analyzed in mLN (top panel) and LI-LP (bottom panel) of Itgavfl/fl and RorcCreItgavfl/fl mice (n = 4). Data in d, f are representative of two independent experiments. Data in c, e are pooled from two independent experiments. Data are shown as means ± SEM, statistics shown in c are obtained by one-way ANOVA with Tukey’s multiple comparisons test, statistics shown in d-f are obtained by unpaired Student’s t-test (two-tailed).
Fig. 5 |
Fig. 5 |. Interactions between ILC3 and RORγt+ Treg are altered in human IBD.
a, UMAP plots of scRNA-seq data on ILCs and T lymphocytes from the inflamed and non-inflamed intestine in human IBD. b, Dot plot showing the mean expression (color) of indicated genes in clusters grouped by low CD3E expression, dot size represents the proportion of cells in a cluster with the gene detected. c, A dot plot showing the mean expression (colour) of indicated genes in cluster 4 as indicated in (a) in non-inflamed (NI) versus inflamed tissue (Infla). d, Quantification of ILC3 frequency in a cohort of IBD patients. Healthy donor n = 17, IBD patient n = 18. e, Dot plot showing the mean expression (color) of indicated genes in clusters grouped by high CD3E expression. f, Volcano plot of differentially expressed genes between cluster 6 and cluster 8 as indicated in (a). g, Bar graph showing the composition of T lymphocytes as indicated in (a). h, Expression of indicated genes in cluster 6 in non-inflamed versus inflamed tissue as indicated in (a). i, Quantification of frequency of RORγt+ Tregs among total Tregs in a cohort of IBD patients as indicated in (d). j, Correlation analyses between the ILC3 and RORγt+ Treg frequencies as indicated in (d, i). Data in d, i are shown as means ± SEM, statistics shown in d, i are performed using Mann–Whitney U-test (unpaired), correlative analyses in j are compared by Pearson’s rank correlation coefficient (R2). Statistics are calculated by two-tailed test. Statistics in f and Supplementary Table 2 were obtained by Wilcoxon test as implemented by Seurat, red dots are significantly different.

Comment in

References

    1. Honda K & Littman DR The microbiota in adaptive immune homeostasis and disease. Nature 535, 75–84 (2016). - PubMed
    1. Maloy KJ & Powrie F Intestinal homeostasis and its breakdown in inflammatory bowel disease. Nature 474, 298–306 (2011). - PubMed
    1. Maynard CL, Elson CO, Hatton RD & Weaver CT Reciprocal interactions of the intestinal microbiota and immune system. Nature 489, 231–241 (2012). - PMC - PubMed
    1. Zhou L & Sonnenberg GF Essential immunologic orchestrators of intestinal homeostasis. Sci Immunol 3 (2018). - PMC - PubMed
    1. Belkaid Y & Hand TW Role of the microbiota in immunity and inflammation. Cell 157, 121–141 (2014). - PMC - PubMed

Publication types

MeSH terms

Substances