. 2022 Sep;609(7926):307-312.
doi: 10.1038/s41586-022-05020-5. Epub 2022 Sep 7.

Chiral monoterpenes reveal forest emission mechanisms and drought responses

Affiliations

Chiral monoterpenes reveal forest emission mechanisms and drought responses

Joseph Byron et al. Nature. 2022 Sep.

Abstract

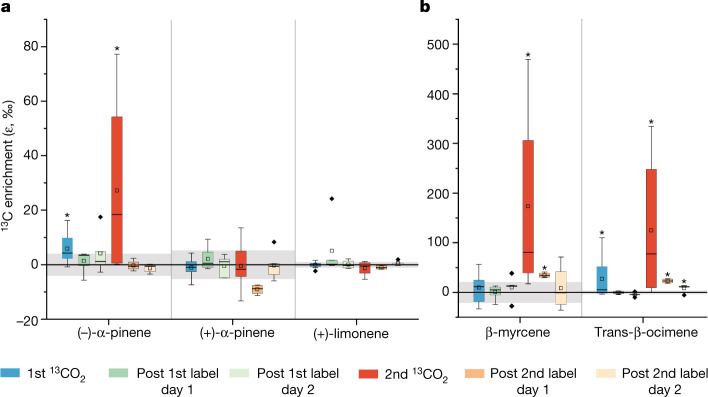
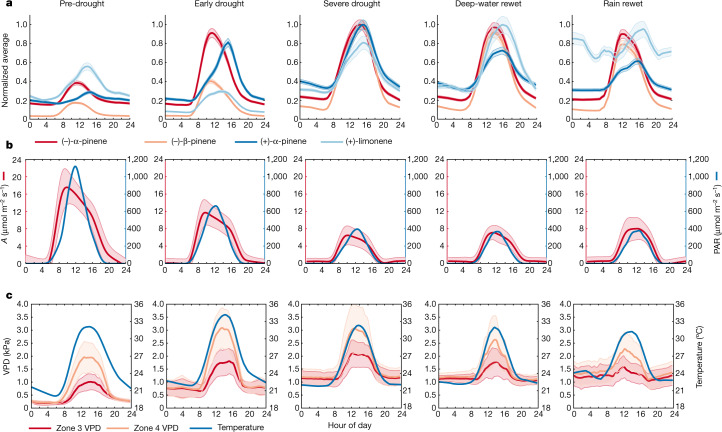
Monoterpenes (C10H16) are emitted in large quantities by vegetation to the atmosphere (>100 TgC year-1), where they readily react with hydroxyl radicals and ozone to form new particles and, hence, clouds, affecting the Earth's radiative budget and, thereby, climate change1-3. Although most monoterpenes exist in two chiral mirror-image forms termed enantiomers, these (+) and (-) forms are rarely distinguished in measurement or modelling studies4-6. Therefore, the individual formation pathways of monoterpene enantiomers in plants and their ecological functions are poorly understood. Here we present enantiomerically separated atmospheric monoterpene and isoprene data from an enclosed tropical rainforest ecosystem in the absence of ultraviolet light and atmospheric oxidation chemistry, during a four-month controlled drought and rewetting experiment7. Surprisingly, the emitted enantiomers showed distinct diel emission peaks, which responded differently to progressive drying. Isotopic labelling established that vegetation emitted mainly de novo-synthesized (-)-α-pinene, whereas (+)-α-pinene was emitted from storage pools. As drought progressed, the source of (-)-α-pinene emissions shifted to storage pools, favouring cloud formation. Pre-drought mixing ratios of both α-pinene enantiomers correlated better with other monoterpenes than with each other, indicating different enzymatic controls. These results show that enantiomeric distribution is key to understanding the underlying processes driving monoterpene emissions from forest ecosystems and predicting atmospheric feedbacks in response to climate change.


Conflict of interest statement

The authors declare no competing interests.

Figures

Fig. 1
Fig. 1. Inside the Biosphere 2 Tropical Rain Forest.
a, Schematic of the Biosphere 2 Tropical Rain Forest biome. b, Photograph taken inside the biome (photo J. Byron).
Fig. 2
Fig. 2. Long-term trends are different between monoterpene enantiomers, especially during daylight hours.
Monoterpene and isoprene data are divided into five stages, indicated by the bands: pre-drought (PD), early drought (ED), severe drought (SD), deep-water rewet (DRW) and rain rewet (RRW). The timing of the 13CO2 pulses is indicated by the dotted black lines. a, Daytime isoprene and total monoterpene volume mixing ratios (VMR). The shaded region around the lines represents the absolute measurement uncertainty. b, Average daytime VMR for (−)-α-pinene and (+)-α-pinene and other monoterpenes. c, Average night-time VMR for (−)-α-pinene and (+)-α-pinene and other monoterpenes. For b and c, the shaded region around the lines represents the calculated measurement uncertainty. d, Soil moisture (SM) and relative humidity (RH). Note the different scales for enantiomers. e, Pie charts showing the daytime composition of the enantiomeric monoterpenes during each stage. Other monoterpenes includes (−)-camphene, (+)-camphene, (−)-limonene, (+)-limonene and γ-terpinene.
Fig. 3
Fig. 3. Emissions of α-pinene enantiomers are not equally enriched in 13C.
Carbon sources (de novo or storage) for monoterpene emissions were clearly separated by ε13C values of monoterpenes and their enantiomers after 13C-enriched CO2 was added during one morning in pre-drought (1st 13CO2) and severe drought (2nd 13CO2) phases. 13CO2 gas was introduced into the atmosphere so that plants taking up CO2 and directly producing immediate monoterpene emissions (de novo) would produce emissions enriched in 13C. Therefore, emissions that did not become enriched in 13C came from storage pools. a, Enrichment of chiral monoterpenes. b, Enrichment of non-chiral monoterpenes. Grey shading represents the standard deviation of the ε13C values of the compounds in ambient air when there is no 13CO2 pulse. The black line through the grey boxes represents the mean. The box plots present the median and 25th and 75th percentiles. The small squares represent the mean and the whiskers represent the maximum and minimum acquired data points that are not as considered outliers. Significantly 13C-enriched values are indicated by the asterisk (*) above the box (that is, results are significant if P ≤ 0.05). n values are given in Extended Data Table 3.
Fig. 4
Fig. 4. Diel cycles of α-pinene enantiomers become more aligned with increasing drought.
Comparison of diel cycles of selected monoterpenes and their enantiomers with light, temperature and soil moisture across the experiment suggest emission driver changes in some monoterpenes. a, Average diel cycles for (−)-α-pinene and (+)-α-pinene, (−)-β-pinene and (+)-limonene. The monoterpene diel cycles were normalized by their respective maxima across all averaged diel bins, which was found to be during severe drought for both compounds. The shaded region around the lines is the average absolute uncertainty. b, Assimilation (A) and photosynthetically active radiation (PAR). The shaded region around the assimilation rate line represents 1σ. c, Vapour pressure deficit (VPD) and temperature. Zones 3 and 4 were the uppermost sections of the rainforest enclosure (Extended Data Fig. 3a). The shaded region around the VPD lines represents 1σ.
Extended Data Fig. 1
Extended Data Fig. 1. Correlations between measured compounds.
a,b, Correlation matrix for the measured atmospheric concentrations of monoterpenes. a, Pre-drought. b, Severe drought. Colours denote strength and direction of the correlation. Correlations are based on Pearson’s correlation coefficient. c,d, Correlations of (+)-α-pinene and (−)-α-pinene during each stage of drought. c, Daytime correlation. d, Night-time correlation. Data are more correlated during night-time, indicating that the source of the emissions is more similar than the daytime sources.
Extended Data Fig. 2
Extended Data Fig. 2. Sorbent tube data taken from branch cuvettes and soil chambers.
a, Average soil flux of individual monoterpene species from soil chambers located around the B2-TRF. Values shown are the calculated medians from three soil chamber outlet samples and 2–3 atmospheric sample cartridges taken at the inlet to the soil chamber. b,c, Measurements of the emissions from four branch cuvettes on both C. fairchildiana (b) and Piper sp. (c) show different emissions trends across the drought period. The dotted line on doy 280 shows the start of the drought and the dotted line on doy 346 shows the end of the drought and the start of the rain rewet. The shaded grey line on doy 337 shows the day of the underground deep rewet.
Extended Data Fig. 3
Extended Data Fig. 3. Schematic of the B2-TRF microbiome and SF6 leak rate.
a, The height of the B2-TRF was divided into five zones. A13 is the location where the atmosphere was sampled by GC-MS. b, SF6 leak rate fraction across the entire measurement period. SF6 was injected into the B2-TRF atmosphere and measured with GC-MS to characterize the air loss rate owing to the flow-through ventilation.
Extended Data Fig. 4
Extended Data Fig. 4. Schematic representation of the three-enzyme-group model.
The solid arrows represent the main emission pathway for that compound and the dashed arrows represent a secondary pathway.
Extended Data Fig. 5
Extended Data Fig. 5. Comparison of the measured (−)-α-pinene time profiles with the MEGAN model.
a, The sum of the α-pinene emission and the sum of the α-pinene flux calculated with the MEGAN model as a function of time using the temperature data measured from 13 m on the measurement tower and the PAR data measured outside the Biosphere 2. b, Diurnal cycles of the measured concentration of (−)-α-pinene and (+)-α-pinene during pre-drought on doy 280 in addition to the predicted combined emission flux of (−)-α-pinene and (+)-α-pinene. c, Diurnal cycles of the measured concentration of (−)-α-pinene and (+)-α-pinene during severe drought on doy 296 in addition to the predicted combined emission flux of (−)-α-pinene and (+)-α-pinene.
Extended Data Fig. 6
Extended Data Fig. 6. Daily daytime average concentrations and smoothed average plots.
a, Isoprene and total monoterpenes. b, (−)-α-pinene, (+)-α-pinene, (−)-β-pinene and the total of the other monoterpenes. c, Daily night-time average concentrations of (−)-α-pinene, (+)-α-pinene, (−)-β-pinene and the total of the other monoterpenes. d, Calibrated (−)-α-pinene measurements (black) with smoothed daytime (red) and night-time (brown) trend lines. The smoothed lines were created by applying a Savitzky–Golay filter in conjunction with a moving-average filter, as described in the ‘Data management’ section.
Extended Data Fig. 7
Extended Data Fig. 7. 13C enrichment of isoprene and (−)-α-pinene.
a, 13C enrichment of isoprene measured with PTR-TOF-MS shows substantial enrichment above pre-pulse levels on the day of the labelling pulse but not on the days following the labelling pulse. b, A section of the chromatogram obtained from the GC-IRMS showing the peaks for the identified compounds. c, A section of the chromatogram obtained from the GC-IRMS showing the trans-β-ocimene peaks. The integrated regions are shaded in grey. d, A section of the chromatogram obtained from the GC-IRMS showing the β-myrcene peak. The integrated region is shaded in grey. e, Box plots representing the 13C enrichment of (−)-α-pinene. Each method represents a different way of integrating the (−)-α-pinene peak in the GC-IRMS chromatogram. The integration method is depicted in the subplot above the box plots. For a and e, the grey boxes represent the standard deviation of the values of the compounds in ambient air when there is no 13CO2 pulse. The black line through the grey boxes represents the mean. The box plots present the median, and 25th and 75th percentiles. The small squares represent the mean and the whiskers represent the maximum and minimum acquired data points that are not considered as outliers. Significant results are indicated by the asterisk (*) above the box (that is, results are significant if P ≤ 0.05). Statistical information for e is shown in Extended Data Table 3b.

References

    1. Jokinen T, et al. Production of extremely low volatile organic compounds from biogenic emissions: measured yields and atmospheric implications. Proc. Natl Acad. Sci. 2015;112:7123–7128. - PMC - PubMed
    1. Engelhart GJ, Asa-Awuku A, Nenes A, Pandis SN. CCN activity and droplet growth kinetics of fresh and aged monoterpene secondary organic aerosol. Atmos. Chem. Phys. 2008;8:3937–3949.
    1. Laothawornkitkul J, Taylor JE, Paul ND, Hewitt CN. Biogenic volatile organic compounds in the Earth system. New Phytol. 2009;183:27–51. - PubMed
    1. Yáñez-Serrano AM, et al. Monoterpene chemical speciation in a tropical rainforest: variation with season, height, and time of day at the Amazon Tall Tower Observatory (ATTO) Atmos. Chem. Phys. 2018;18:3403–3418.
    1. Jardine KJ, et al. Monoterpene ‘thermometer’ of tropical forest-atmosphere response to climate warming. Plant Cell Environ. 2017;40:441–452. - PubMed