. 2022 Nov;240(11):2817-2833.
doi: 10.1007/s00221-022-06456-x. Epub 2022 Sep 7.

Benefits of active listening during 3D sound localization

Affiliations

Benefits of active listening during 3D sound localization

V Gaveau et al. Exp Brain Res. 2022 Nov.

Abstract

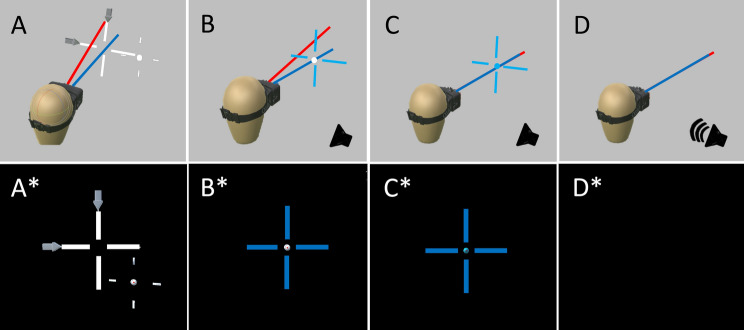
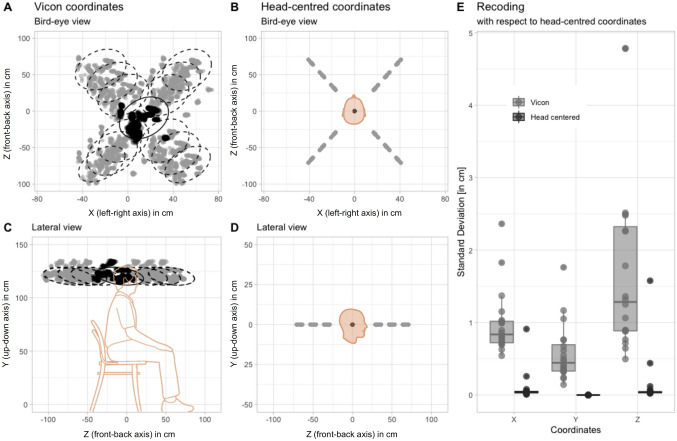
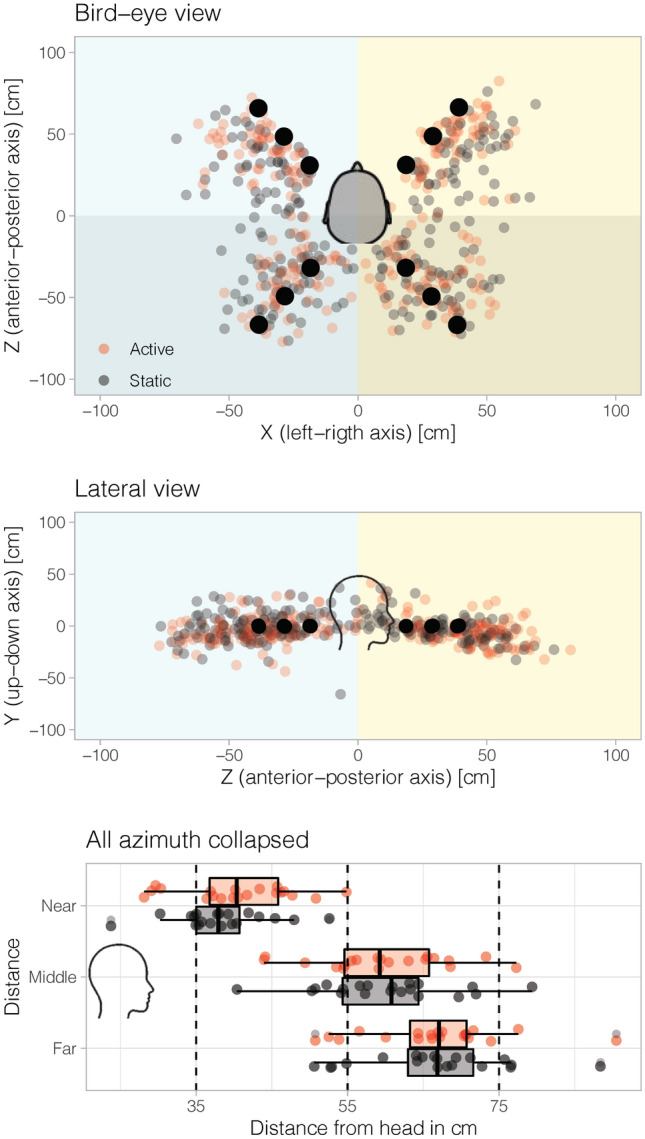
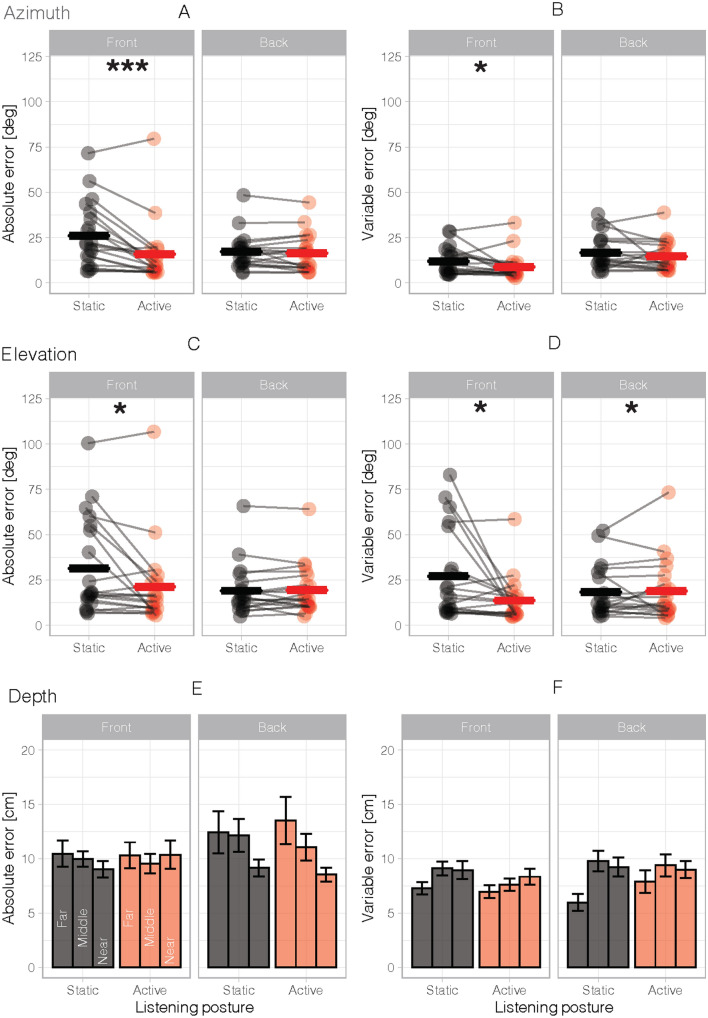
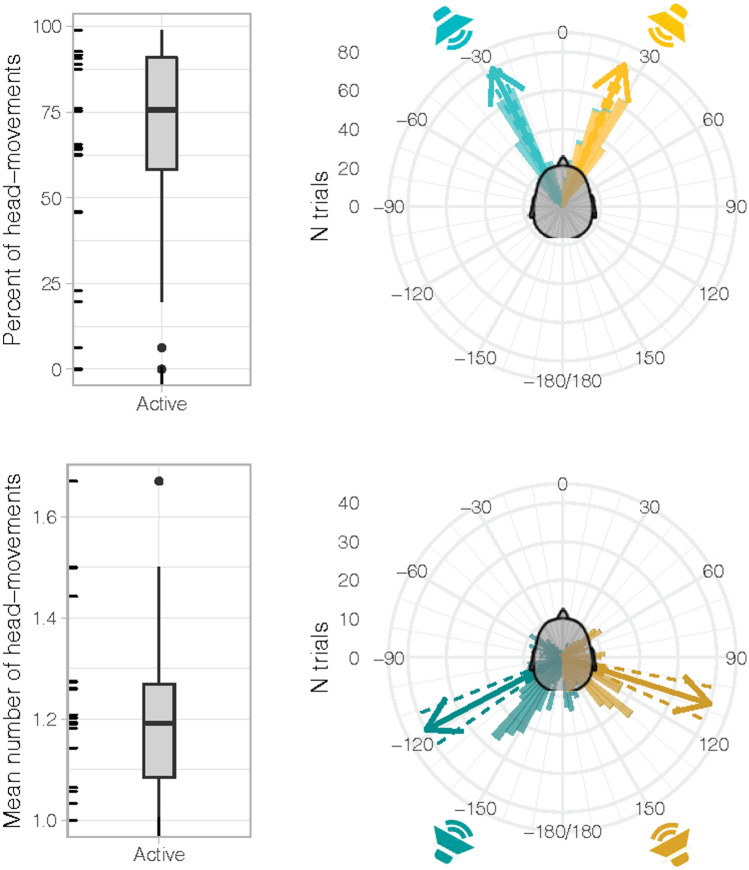
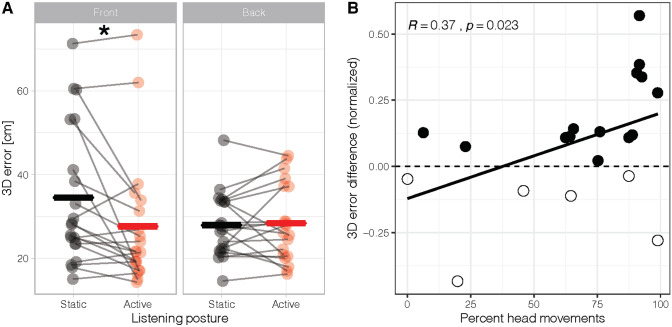
In everyday life, sound localization entails more than just the extraction and processing of auditory cues. When determining sound position in three dimensions, the brain also considers the available visual information (e.g., visual cues to sound position) and resolves perceptual ambiguities through active listening behavior (e.g., spontaneous head movements while listening). Here, we examined to what extent spontaneous head movements improve sound localization in 3D-azimuth, elevation, and depth-by comparing static vs. active listening postures. To this aim, we developed a novel approach to sound localization based on sounds delivered in the environment, brought into alignment thanks to a VR system. Our system proved effective for the delivery of sounds at predetermined and repeatable positions in 3D space, without imposing a physically constrained posture, and with minimal training. In addition, it allowed measuring participant behavior (hand, head and eye position) in real time. We report that active listening improved 3D sound localization, primarily by ameliorating accuracy and variability of responses in azimuth and elevation. The more participants made spontaneous head movements, the better was their 3D sound localization performance. Thus, we provide proof of concept of a novel approach to the study of spatial hearing, with potentials for clinical and industrial applications.

Keywords: Active perception; Head movements; Motion tracking; Spatial hearing; Virtual reality.


Conflict of interest statement

The authors declare that they have no conflict of interest.

Figures

Fig. 1
Fig. 1
Pre-stimulation alignment of head and eyes. A At the beginning of each trial, the participant was free to move their head (symbolized head direction: blue line) and eyes (symbolized cyclopean eye direction: red line). A* In the HMD display: a bold white cross indicates the actual position of the head, and a thin white cross with a central ball indicates the desired position of the head and eyes, respectively. Two gray arrows flank the bold white cross, showing the participant in which direction to move their head to achieve the desired initial position. B* When the desired head position was achieved, the bold cross turned blue. C* When the desired eye-gaze position was reached, the central ball turned blue. D When all criteria were met (head and eye position straight ahead and speaker within a sphere around the predetermined position), all visual stimulations were removed, D* the scene became dark and the sound was delivered
Fig. 2
Fig. 2
Normalization to head-centered coordinates. Bird’s-eye and lateral views of initial head position (in black) and 12 predetermined locations (in gray) for all participants (192 trials each), in VICON reference frame (AC) and head-centered coordinates (BD). Variability of predetermined locations averaged across 12 positions for each participant in the two reference frames as a function of coordinates x, y, z (E)
Fig. 3
Fig. 3
Actual speaker location with respect to predetermined location, in centimeters. Stimulations delivered to all participants, when the 12 predetermined locations were re-aligned to a single coordinate, centered on the origin of the axes. A top view; B front view; C lateral view; D 3D rendering. Ellipses in the 2D panels represent 95% confidence intervals of the distributions
Fig. 4
Fig. 4
Behavioral pointing and effects of static and active listening on sound localization. A Bird’s-eye view of all target positions (black dots) and hand-pointing responses (smaller gray and red circles) for each participant, averaged across trials in a quadrant (i.e., front-left, front-right, back-left, back-right) irrespective of sound distance. Color code is a function of listening condition (black: static listening; red: active listening). B Lateral view of all target positions and responses. Responses for each participant are averaged across (left or right) and distance (near, middle or far). C Lateral view of responses in depth (black box plot: static listening; red box plot: active listening). All participants were included
Fig. 5
Fig. 5
Effects of static and active listening on sound localization performances. In azimuth dimension, for the hand absolute error (A) and the hand variable error (B) for each participant as a function of listening condition and antero-posterior position of target sounds. In elevation dimension, for the hand absolute error (C) and the hand variable error (D) for each participant. In depth dimension, for the hand absolute error (E) and the hand variable error (F) for each participant and for the three distance (near, middle and far sound position). Bold horizontal lines indicate the mean for all participants. Asterisks indicate significant differences (* p < 0.05; **p < 0.01; ***p < 0.001)
Fig. 6
Fig. 6
Head movements during sound emission in the active listening condition. A Box plot of percentage head movements. Note that two participants were identified as outliers (i.e., they fell outside the 1.5 × interquartile range), made almost no head movements during the active listening condition and were thus excluded from subsequent analyses. B Box plot of mean number of head movements once outliers were removed. C, D Polar histogram showing the distribution of head-movement responses for targets in front (C) and back (D) space. Arrows indicate mean head-movement direction, dashed lines indicate ± 1 SE
Fig. 7.
Fig. 7.
3D error. Scatterplot of the difference in 3D errors between active and static listening conditions (normalized difference based on static listening performance), as a function of percent head movements. Filled circles indicate participants who improved in active compared to static listening; empty circles indicate participants whose sound localization performance decreased in active compared to static listening

Similar articles

Cited by

References

    1. Ahrens A, Lund KD, Marschall M, Dau T. Sound source localization with varying amount of visual information in virtual reality. PLoS ONE. 2019;14(3):e0214603. doi: 10.1371/journal.pone.0214603. - DOI - PMC - PubMed
    1. Alais D, Burr D. The ventriloquist effect results from near-optimal bimodal integration. Curr Biol. 2004;14(3):257–262. doi: 10.1016/j.cub.2004.01.029. - DOI - PubMed
    1. Andéol G, Simpson BD. Editorial : how, and why, does spatial-hearing ability differ among listeners? What is the role of learning and multisensory interactions? Front Neurosci. 2016 doi: 10.3389/fnins.2016.00036. - DOI - PMC - PubMed
    1. Bahill AT, McDonald JD. Frequency limitations and optimal step size for the two-point central difference derivative algorithm with applications to human eye movement data. IEEE Trans Biomed Eng, BME. 1983;30(3):191–194. doi: 10.1109/TBME.1983.325108. - DOI - PubMed
    1. Bahu H, Carpentier T, Noisternig M, Warusfel O. Comparison of different egocentric pointing methods for 3D sound localization experiments. Acta Acust Acust. 2016;102(1):107–118. doi: 10.3813/AAA.918928. - DOI

LinkOut - more resources