. 2022 Nov;19(11):1235-1250.
doi: 10.1038/s41423-022-00921-x. Epub 2022 Sep 8.

S1P/S1PR1 signaling differentially regulates the allogeneic response of CD4 and CD8 T cells by modulating mitochondrial fission

Affiliations

S1P/S1PR1 signaling differentially regulates the allogeneic response of CD4 and CD8 T cells by modulating mitochondrial fission

Linlu Tian et al. Cell Mol Immunol. 2022 Nov.

Abstract

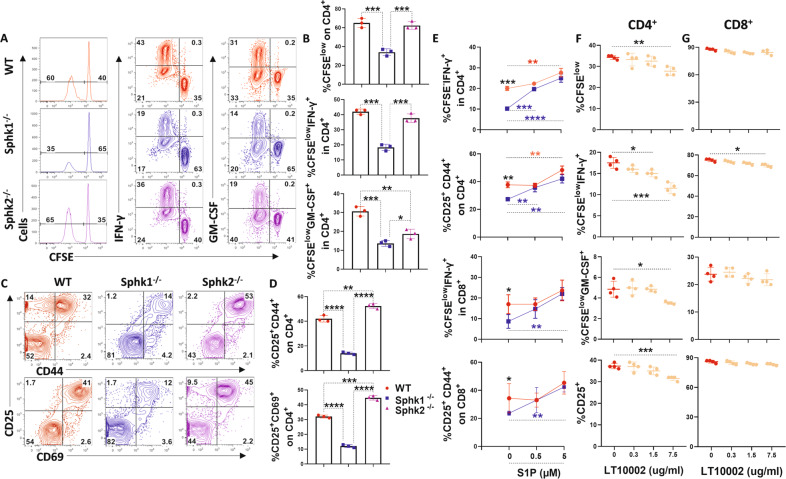
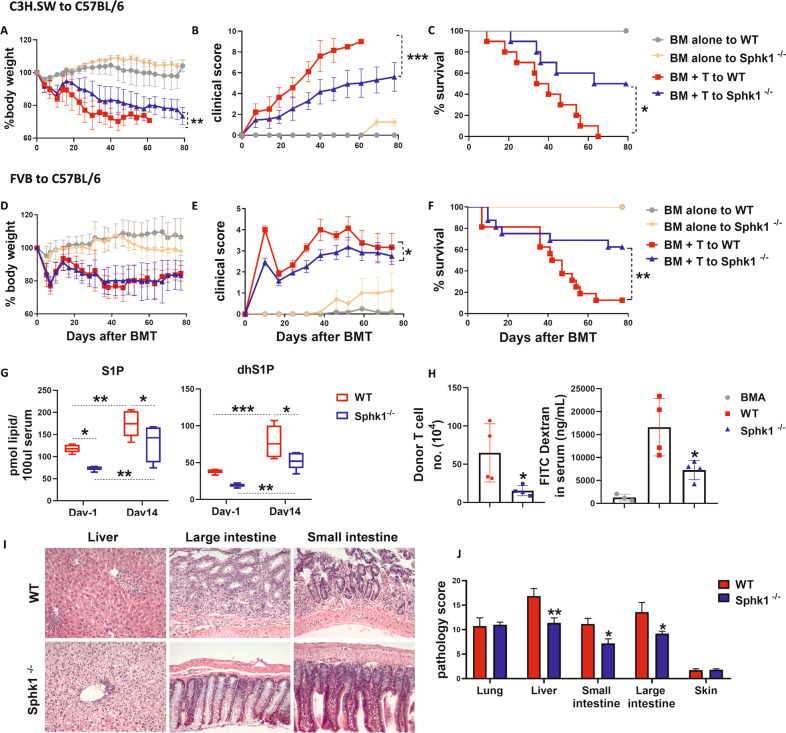
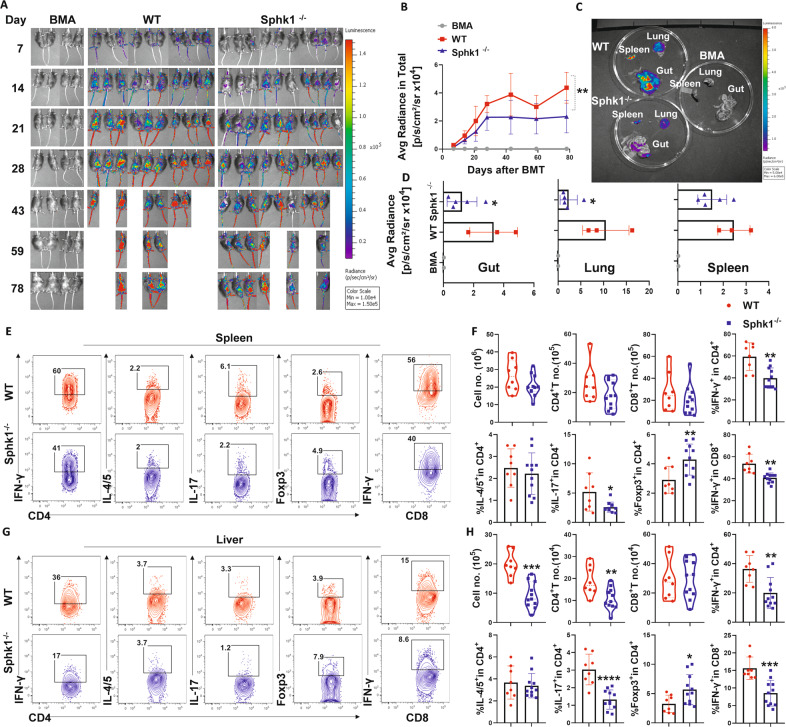
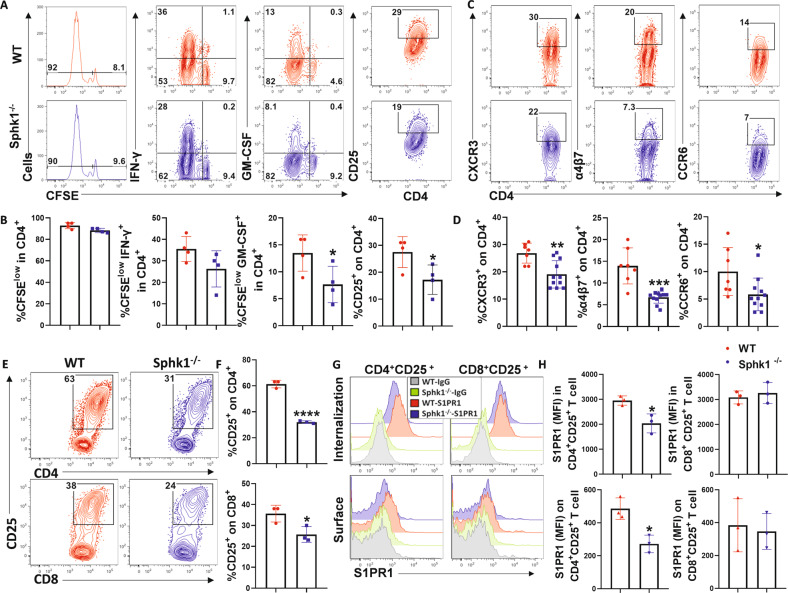
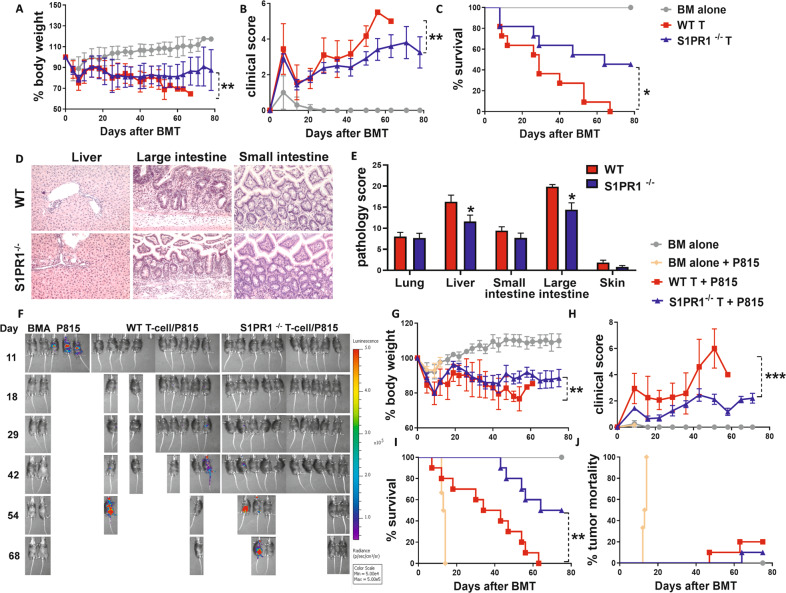
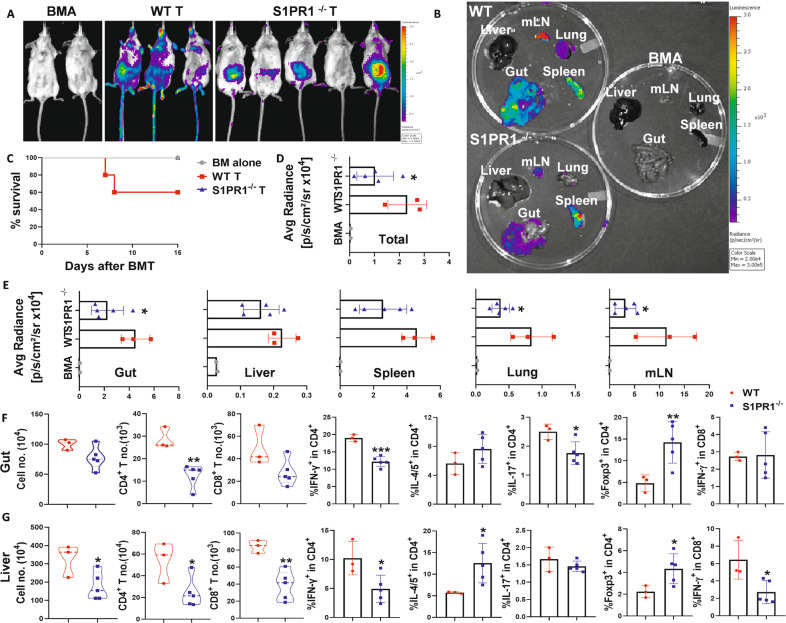
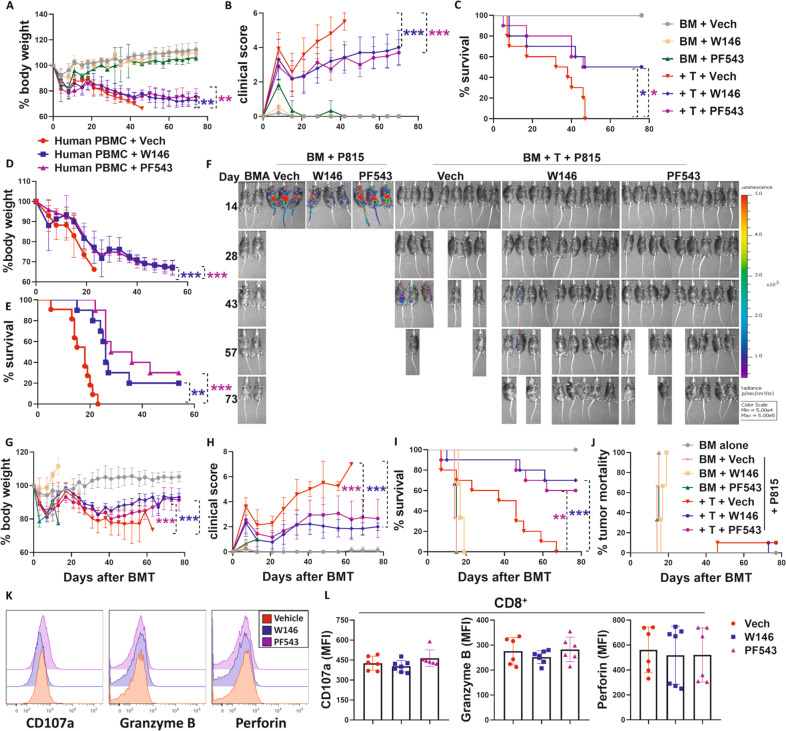
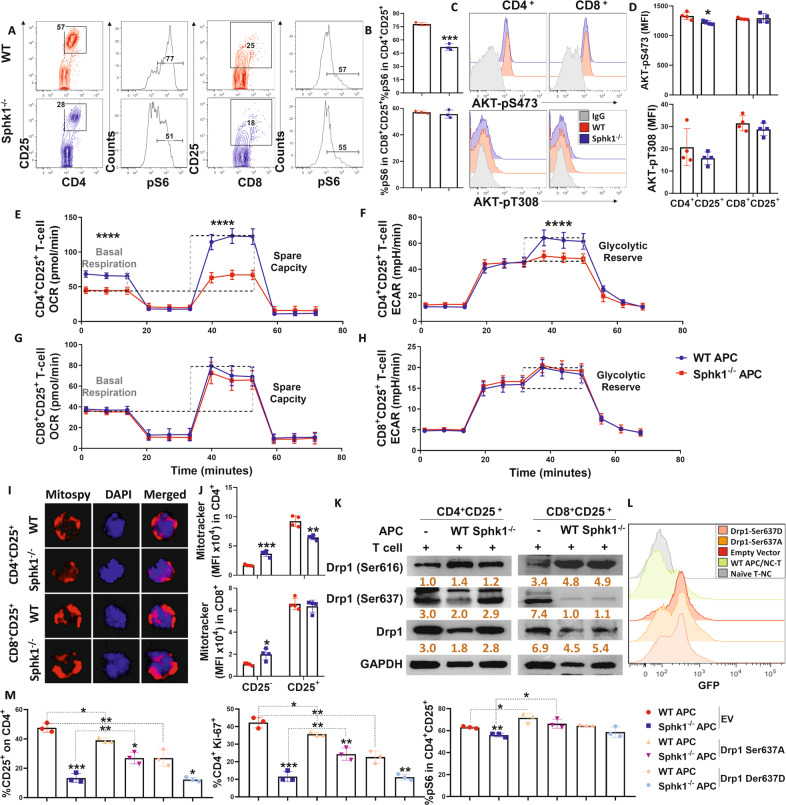
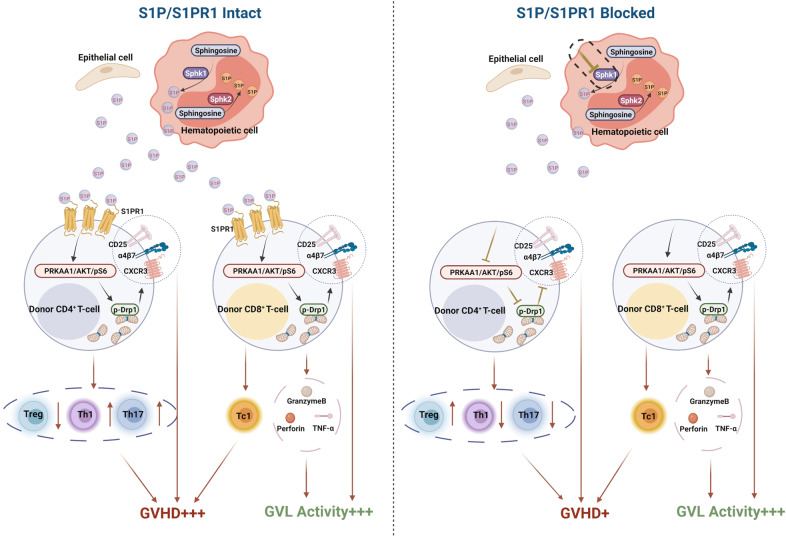
Graft-versus-host disease (GVHD) significantly contributes to patient morbidity and mortality after allogeneic hematopoietic cell transplantation (allo-HSCT). Sphingosine-1-phosphate (S1P) signaling is involved in the biogenetic processes of different immune cells. In the current study, we demonstrated that recipient sphingosine kinase 1 (Sphk1), but not Sphk2, was required for optimal S1PR1-dependent donor T-cell allogeneic responses by secreting S1P. Using genetic and pharmacologic approaches, we demonstrated that inhibition of Sphk1 or S1PR1 substantially attenuated acute GVHD (aGVHD) while retaining the graft-versus-leukemia (GVL) effect. At the cellular level, the Sphk1/S1P/S1PR1 pathway differentially modulated the alloreactivity of CD4+ and CD8+ T cells; it facilitated T-cell differentiation into Th1/Th17 cells but not Tregs and promoted CD4+ T-cell infiltration into GVHD target organs but was dispensable for the CTL activity of allogeneic CD8+ T cells. At the molecular level, the Sphk1/S1P/S1PR1 pathway augmented mitochondrial fission and increased mitochondrial mass in allogeneic CD4+ but not CD8+ T cells by activating the AMPK/AKT/mTOR/Drp1 pathway, providing a mechanistic basis for GVL maintenance when S1P signaling was inhibited. For translational purposes, we detected the regulatory efficacy of pharmacologic inhibitors of Sphk1 and S1PR1 in GVHD induced by human T cells in a xenograft model. Our study provides novel mechanistic insight into how the Sphk1/S1P/S1PR1 pathway modulates T-cell alloreactivity and validates Sphk1 or S1PR1 as a therapeutic target for the prevention of GVHD and leukemia relapse. This novel strategy may be readily translated into the clinic to benefit patients with hematologic malignancies and disorders.

Keywords: GVHD; GVL; S1P; S1PR; Sphk1; mitochondrial fission.


Conflict of interest statement

The authors declare no competing interests.

Figures

Fig. 1
Fig. 1
The impact of Sphk1/S1P on T-cell alloreactivity. CFSE-labeled CD4+ T cells from FVB mice were cocultured with T-cell depleted (TCD)-splenocytes serving as APCs from WT, Sphk1−/− or Sphk2−/− mice for 4 days. A, B Representative flow figures and percentages of CFSE, CFSE-diluted, and IFN-γ+ or GM-CSF+ cells are shown on gated CD4+ T cells. C, D Representative dot plots and the average frequencies of CD25 and CD69 or CD44 double-positive expression on gated CD4+ T cells are shown. CFSE-labeled T cells from FVB mice were stimulated with WT or Sphk1−/− APCs in the absence or presence of S1P for 4 days. E Percentages of CFSE-diluted and IFN-γ+ cells and the average frequencies of CD25 and CD44 double-positive gated CD4+ or CD8+ T cells are shown. CFSE-labeled T cells from B6 mice were cocultured with BALB/c mouse APCs and treated with a specific anti-S1P antibody (0, 0.3, 1.5, 7.5 μg/ml) for 4 days. F, G Percentages of CFSE-diluted and IFN-γ+ or GM-CSF+ cells and the average frequencies of CD25 on gated CD4+ or CD8+ T cells are shown. The experiments were repeated 2 to 3 independent times. Statistical data are presented as the mean ± 1 SD, and significance was determined by Student’s t-test. *P < 0.05, **P < 0.01, ***P < 0.001 and **** P < 0.0001
Fig. 2
Fig. 2
The role played by recipient Sphk1 in the development of aGVHD. Lethally irradiated C57BL/6 WT and Sphk1−/− mice (1100 cGy) were transplanted with 5 × 106 TCD-BM alone or with 1.25 × 106 CD44-depleted T cells isolated from a C3H cell population of SW donors. Recipients were monitored for A body weight loss, B clinical score, and C survival over time (n = 10 mice/group). Lethally irradiated C57BL/6 WT and Sphk1−/− mice (1100 cGy) were transplanted with 5 × 106 TCD-BM alone or with 1 × 106 total T cells isolated from FVB donors, and recipients were monitored for D body weight loss, E clinical score, and F survival over time (n = 10 mice/group). G Serum was collected from the recipient mice before and 14 days after allo-BMT and subjected to HPLC‒MS analysis for S1P and dhS1P measurement (n = 5 mice/group). Seven days after allo-BMT, WT and Sphk1−/− recipients were administered FITC-dextran (80 mg/mL, 200 μL/mouse) by gavage. H Gut permeability was evaluated on the basis of the concentration of secreted FITC-dextran in serum after an additional 4 h, and the absolute numbers of infiltrating donor T cells were calculated (n = 4 mice/group). Tissues from WT and Sphk1−/− FVB mice and transplanted into C57BL/6 mouse recipients were collected on 21 days after allo-BMT and analyzed for pathology (I, J). Representative photomicrographs showing hematoxylin and eosin staining of liver, small and large intestine at the original 200 x magnification, and pathology the scores are shown (n = 10 mice/group). “BMA” in the summary graph indicates BM alone. The experiments were repeated 2 independent times, and the combined data are presented. Log-rank (Mantel‒Cox) test (C and F) and nonparametric Mann‒Whitney U tests (A, B, D, and E) were performed to compare groups. A two-way ANOVA test (G) was used to compare the levels of S1P and dhS1P between groups. Statistical data are presented as the mean ± 1 SD, and significance was determined by Student’s t-test. *P < 0.05, **P < 0.01 and ***P < 0.001
Fig. 3
Fig. 3
The effect of host secretory S1P on donor T-cell migration and differentiation after allo-BMT. Lethally irradiated WT and Sphk1−/− mice were transplanted with 5 × 106 TCD-BM isolated from FVB donors plus 0.5 × 106 total T cells isolated from β-actin-luciferase transgenic FVB mice (n = 10 mice/group). T-cell migration was monitored using bioluminescent imaging (BLI). Macrophotos show BLI for A the total body over time and C individual organs in a region of interest (ROI) summary (B, D). Lethally irradiated WT and Sphk1−/− mice (H2b) were transplanted with 5 × 106 TCD-BM (Thy1.2+) plus 0.75 × 106 total T cells (Thy1.1+) isolated from FVB mice (H2q). Two weeks after allo-BMT, the spleens and livers of the recipients were collected and analyzed by flow cytometry (n = 8–11 mice/group). The numbers of infiltrated donor cells, representative dot plots, and the average levels of IFN-γ, IL4/5, IL-17, and Foxp3 on gated donor CD4+ or CD8+ T cells from E, F spleens and G, H livers are shown. “BMA” in the summary graph indicates BM alone. The experiments were repeated 2 times independently, and the combined data are presented. Nonparametric Mann‒Whitney U test (C) was performed to compare between groups. Statistical data are presented as the mean ± 1 SD, and significance was determined by Student’s t-test. *P < 0.05, **P < 0.01, ***P < 0.001 and ****P < 0.0001
Fig. 4
Fig. 4
S1P/Sphk1 upregulates S1PR1 expression in alloantigen-activated CD4+ T cells but not CD8+ T cells. Purified T cells from FVB mice (H2Kq) were labeled with CFSE and transferred into lethally irradiated WT or Sphk1−/− (H2Kb) mice at 2 × 106 cells per mouse. Four days after cell transfer, recipient spleens were harvested and analyzed by flow cytometry. A, B Representative flow figures and percentages of CFSE, CFSE-diluted, and IFN-γ+ or GM-CSF+ and CD25+ cells are shown on gated live H2Kq+ CD4+ cells. (n = 4 mice/group). C, D The same experiments are shown in Fig. 2E–H. Representative dot plots and the average frequencies of CXCR3, α4β7, and CCR6 expression on gated donor CD4+ T cells from the recipient spleen are shown. Purified FVB T cells were cocultured with APCs from WT or Sphk1−/− mice for three days. E Representative dot plots and F the average levels of CD25 on gated CD4+ or CD8+ T cells are shown. G Representative histograms and H graphical summary for MFI of S1PR1 on (surface staining) or in (permeable staining) gated CD4+ CD25+ T cells and CD8+ CD25+ T cells are shown. PE-conjugated anti-rat IgG was used as the negative control antibody. The experiments were repeated 2 to 3 times. Statistical data are presented as the mean ± 1 SD, and significance was determined by Student’s t-test. *P < 0.05, **P < 0.01, ***P < 0.001 and ****P < 0.0001
Fig. 5
Fig. 5
The role played by S1PR1 on donor T cells in GVH and GVL responses. Lethally irradiated BALB/c mice (700 cGy) underwent BMT with 5 × 106 TCD-BMCs alone or with 0.75 × 106 total T cells isolated from WT or S1PR1flox/floxCD4-Cre mice, and recipients were monitored for A body weight loss, B clinical score and C survival over time (n = 10 mice/group). Tissues from BALB/c recipients were collected on 21 days after allo-BMT and analyzed for pathology. D Representative photomicrographs showing hematoxylin and eosin staining of livers, small and large intestines at the original magnification 200x, and E pathology scores are shown (n = 6–10 mice/group). Lethally irradiated B6D2F1 recipients were transplanted with 5 × 106 TCD-BMCs alone or with 3 × 106 total CD25-depleted T cells isolated from WT or S1PR1flox/floxCD4-Cre mice and with or without 5000 β-actin-luciferase-transduced P815 mastocytoma cells. Mice were monitored for tumor burden. F BLI images taken throughout the experiment were used to determine tumor growth. G Body weight loss, H clinical score, I survival, and J tumor mortality of recipients were monitored over time (n = 10 mice/group). The experiments were repeated 2 to 3 independent times, and the combined data are presented. Log-rank (Mantel‒Cox) test (C, I, and J) and nonparametric Mann‒Whitney U test (A, B, G and H) were performed to compare between groups. Statistical data are presented as the mean ± 1 SD, and significance was determined by Student’s t-test. *P < 0.05, **P < 0.01 and ***P < 0.001
Fig. 6
Fig. 6
S1PR1 regulates T-cell differentiation and migration. Lethally irradiated BALB/c mice underwent BMT with 5 × 106 TCD-BMCs alone (Ly5.1+) or plus 0.5 × 106 β-actin-luciferase transgenic total T cells isolated from WT or S1PR1flox/floxCD4-Cre mice (Ly5.2+). Two weeks after allo-BMT, T-cell expansion and migration were monitored using BLI. Macrophotos show the BLI of A the total body and B individual organs with D, E a region of interest (ROI) summary. C Mouse survival is shown (n = 3-5 mice/group). Recipient livers and intestines were collected and analyzed with flow cytometry. The numbers of infiltrated donor cells and the average levels of IFN-γ, IL4/5, IL-17, and Foxp3 on gated donor CD4+ or CD8+ T cells from F livers and G intestines are shown. “BMA” in the summary graph indicates BM alone. The experiments were repeated 2 independent times. Statistical data are presented as the mean ± 1 SD, and significance was determined by Student’s t-test. *P < 0.05, **P < 0.01 and ***P < 0.001
Fig. 7
Fig. 7
Pharmacological inhibition of S1P/S1PR1 signaling impacts GVH and GVL responses. Lethally irradiated BALB/c mice (700 cGy) underwent transplantation with 5 × 106 TCD-BMCs alone and with or without 0.75 × 106 total T cells isolated from C57BL/6 donors. Recipient mice were injected i.p. with Sphk1 inhibitor (PF543) at 0.5 mg/kg or S1PR1 inhibitor (W146) at 1 mg/kg every other day from Day 0 to Day 14. Recipients were monitored for A body weight loss, B clinical score, and C survival over time (n = 10 mice/group). NSG-HLA-A2+ mice were irradiated (250 cGy) and transfused with HLA-A2 human PBMCs (10 × 106/mouse). Recipient (D) body weight loss and E survival were monitored for 60 days (n = 10 mice/group). Recipients were treated with PF543 or W146 as shown in AC. Lethally irradiated B6D2F1 recipients (1100 cGy) were transplanted with 5 × 106 TCD-BMCs alone or with 3 × 106 total CD25-depleted T cells isolated from C57BL/6 donors with or without 5000 β-actin luciferase-transduced P815 mastocytoma. Recipients were treated with PF543 or W146 as in AC. G Body weight loss, H clinical score, I survival, and J tumor mortality of recipients were monitored over time. F BLI images taken throughout the experiment were used to reflect tumor growth. In a separate experiment, spleens were collected from recipients on14 days after allo-BMT. K, L Representative histograms and summary graphs of CD107a, granzyme B, and perforin level on gated donor CD8+ T cells are shown (n = 6-7 mice/group). “BMA” in the summary graph indicates BM alone. The experiments were repeated 2 independent times, and combined data are presented. Log-rank (Mantel‒Cox) test (C, E, I, and J) and nonparametric Mann‒Whitney U test (A, B, D, G, and H) were performed to compare groups. Statistical data are presented as the mean ± 1 SD, and significance was determined by Student’s t-test. *P < 0.05, **P < 0.01 and ***P < 0.001
Fig. 8
Fig. 8
S1P regulates CD4+ T-cell pathogenicity through Akt/pS6-mediated mitochondrial fission. Purified CD25-depleted T cells from FVB mice were cocultured with APCs from either WT or Sphk1−/− mice. A, B pS6, C, D AKT-pS473 and AKT-pT308 expression in gated CD4+ CD25+ or CD8+ CD25+ T cells was measured after 3 days. Representative dot plots or histograms and average frequencies are shown. EH Purified CD4+ or CD8+ T cells from FVB mice were cocultured with APCs from either WT or Sphk1−/− mice for 3 days, and activated CD4+ or CD8+ T cells were obtained from bulk culture with CD25 using microbeads and further analyzed with a Seahorse XF96e machine. Glycolysis and OXPHOS shifts in alloreactive T cells were determined by evaluating OCR and ECAR. I Fluorescence figures showing costaining of DAPI and MitoSpy in CD4+ and CD8+ T cells after CD25 selection are shown. J Expression of MitoTracker in CD25+ or CD25 on gated CD4+ or CD8+ T cells was detected by flow cytometry, and summary graphs are shown. K Purified CD4+ or CD8+ T cells from FVB mice were cocultured with APCs from either WT or Sphk1−/− mice for 3 days, and activated CD4+ or CD8+ T cells were obtained from bulk culture with CD25 using microbeads. Drp1, Drp1-Ser616, Drp1-Ser637 and GAPDH expression in CD4+ CD25+ or CD8+ CD25+ T cells was detected by western blotting. Purified naive CD4+ T cells from FVB mice were transfected with GFP-EV, GFP-Drp1 Ser637A, and GFP-Drp1 Ser637D DNA plasmid vectors. After 6 h, transfected T cells were collected and cocultured with TCD-splenocytes serving as APCs from WT or Sphk1−/− mice for three days, and then, CD25, pS6, and Ki-67 expression was analyzed. L GFP signal and M the average levels of CD25, pS6, and Ki-67 on gated CD4+ T cells are shown. The experiments were repeated 2 to 3 independent times. The gray intensity of each band in the western blot was measured by ImageJ. Statistical data are presented as the mean ± 1 SD, and significance was determined by Student’s t-test. *P < 0.05, **P < 0.01, ***P < 0.001 and ****P < 0.0001
Fig. 9
Fig. 9
S1P regulates mitochondrial fission of pathogenic T cells via PRKAA1. A Upon soluble anti-CD3 mAb stimulation (1 μg/mL), purified CD25-depleted T cells from WT or PRKAA1flox/floxCD4-Cre mice were cocultured with APCs from WT or Sphk1−/− mice for 3 days. CD25 abundance on gated CD4+ or CD8+ T cells and pS6 abundance on gated CD4+CD25+ or CD8+CD25+ T cells were measured. Summary graphs of the average levels are shown. B Purified CD25-depleted T cells from either WT or PRKAA1flox/floxCD4-Cre mice were cocultured with APCs from BALB/c mice in the presence or absence of PF543 (1 μM). The percentages of CFSE-diluted and IFN-γ+ cells on gated CD4+ or CD8+ T cells were detected after 4 days. Summary graphs of the average frequencies are shown. C Purified CD4+ or CD8+ T cells from either WT or PRKAA1flox/floxCD4-Cre mice cocultured with APCs from BALB/c mice in the presence or absence of PF543 (1 μM). Activated T cells were enriched from bulk culture through CD25positive selection after 3 days. Drp1, Drp1-Ser616, Drp1-Ser637, and GAPDH expression in CD4+CD25+ and CD8+CD25+ T cells was detected by western blotting. D Purified CD4+ or CD8+ T cells from FVB mice were cocultured with APCs from either WT or Sphk1−/− mice for 3 days, and activated CD4+ or CD8+ T cells were obtained from bulk culture with CD25 using microbeads. AMPKα1 and GAPDH expression in CD4+CD25+ and CD8+CD25+ T cells was detected by western blotting. Lethally irradiated BALB/c mice underwent BMT with 5 × 106 TCD-BMCs alone and with or without 0.75 × 106 total T cells isolated from WT or PRKAA1flox/floxCD4-Cre donors. Recipients were injected i.p. with PF543 at 0.5 mg/kg every other day from Day 0 to Day 14. E Body weight loss, F clinical score, and G survival were monitored over time (n = 10 mice/group). The experiments were repeated 2 to 3 independent times. Log-rank (Mantel‒Cox) test (G) and nonparametric Mann‒Whitney U test (E, F) were performed to compare groups. The gray intensity of each band in the western blot was measured by ImageJ. Statistical data are presented as the mean ± 1 SD, and significance was determined by Student’s t-test. *P < 0.05, **P < 0.01 and ***P < 0.001
Fig. 10
Fig. 10
Graphic summary

References

    1. Voermans C, Hazenberg MD. Cellular therapies for graft-versus-host disease: a tale of tissue repair and tolerance. Blood. 2020;136:410–7. doi: 10.1182/blood.2019000951. - DOI - PubMed
    1. Zeiser R, Blazar BR. Acute graft-versus-host disease–biologic process, prevention, and therapy. N. Engl J Med. 2017;377:2167–79. doi: 10.1056/NEJMra1609337. - DOI - PMC - PubMed
    1. Gratwohl A, Pasquini MC, Aljurf M, Atsuta Y, Baldomero H, Foeken L, et al. One million haemopoietic stem-cell transplants: a retrospective observational study. Lancet Haematol. 2015;2:e91–100. doi: 10.1016/S2352-3026(15)00028-9. - DOI - PubMed
    1. Ghimire S, Weber D, Mavin E, Wang XN, Dickinson AM, Holler E. Pathophysiology of GvHD and other HSCT-related major complications. Front Immunol. 2017;8:79. doi: 10.3389/fimmu.2017.00079. - DOI - PMC - PubMed
    1. Spiegel S, Milstien S. The outs and the ins of Sphingosine-1-phosphate in immunity. Nat Rev Immunol. 2011;11:403–15. doi: 10.1038/nri2974. - DOI - PMC - PubMed

Publication types

Substances