

Association of Area-Level Heat and Social Vulnerability With Recurrent Hospitalizations Among Individuals With Rheumatic Conditions
- PMID: 36071609
- PMCID: PMC9947700
- DOI: 10.1002/acr.25015
Association of Area-Level Heat and Social Vulnerability With Recurrent Hospitalizations Among Individuals With Rheumatic Conditions
Abstract
Objective: Climate and social vulnerability contribute to morbidity and health care utilization. We examined associations between the neighborhood Social Vulnerability Index (SVI) and the Heat Vulnerability Index (HVI) and recurrent hospitalizations among individuals with rheumatic conditions.
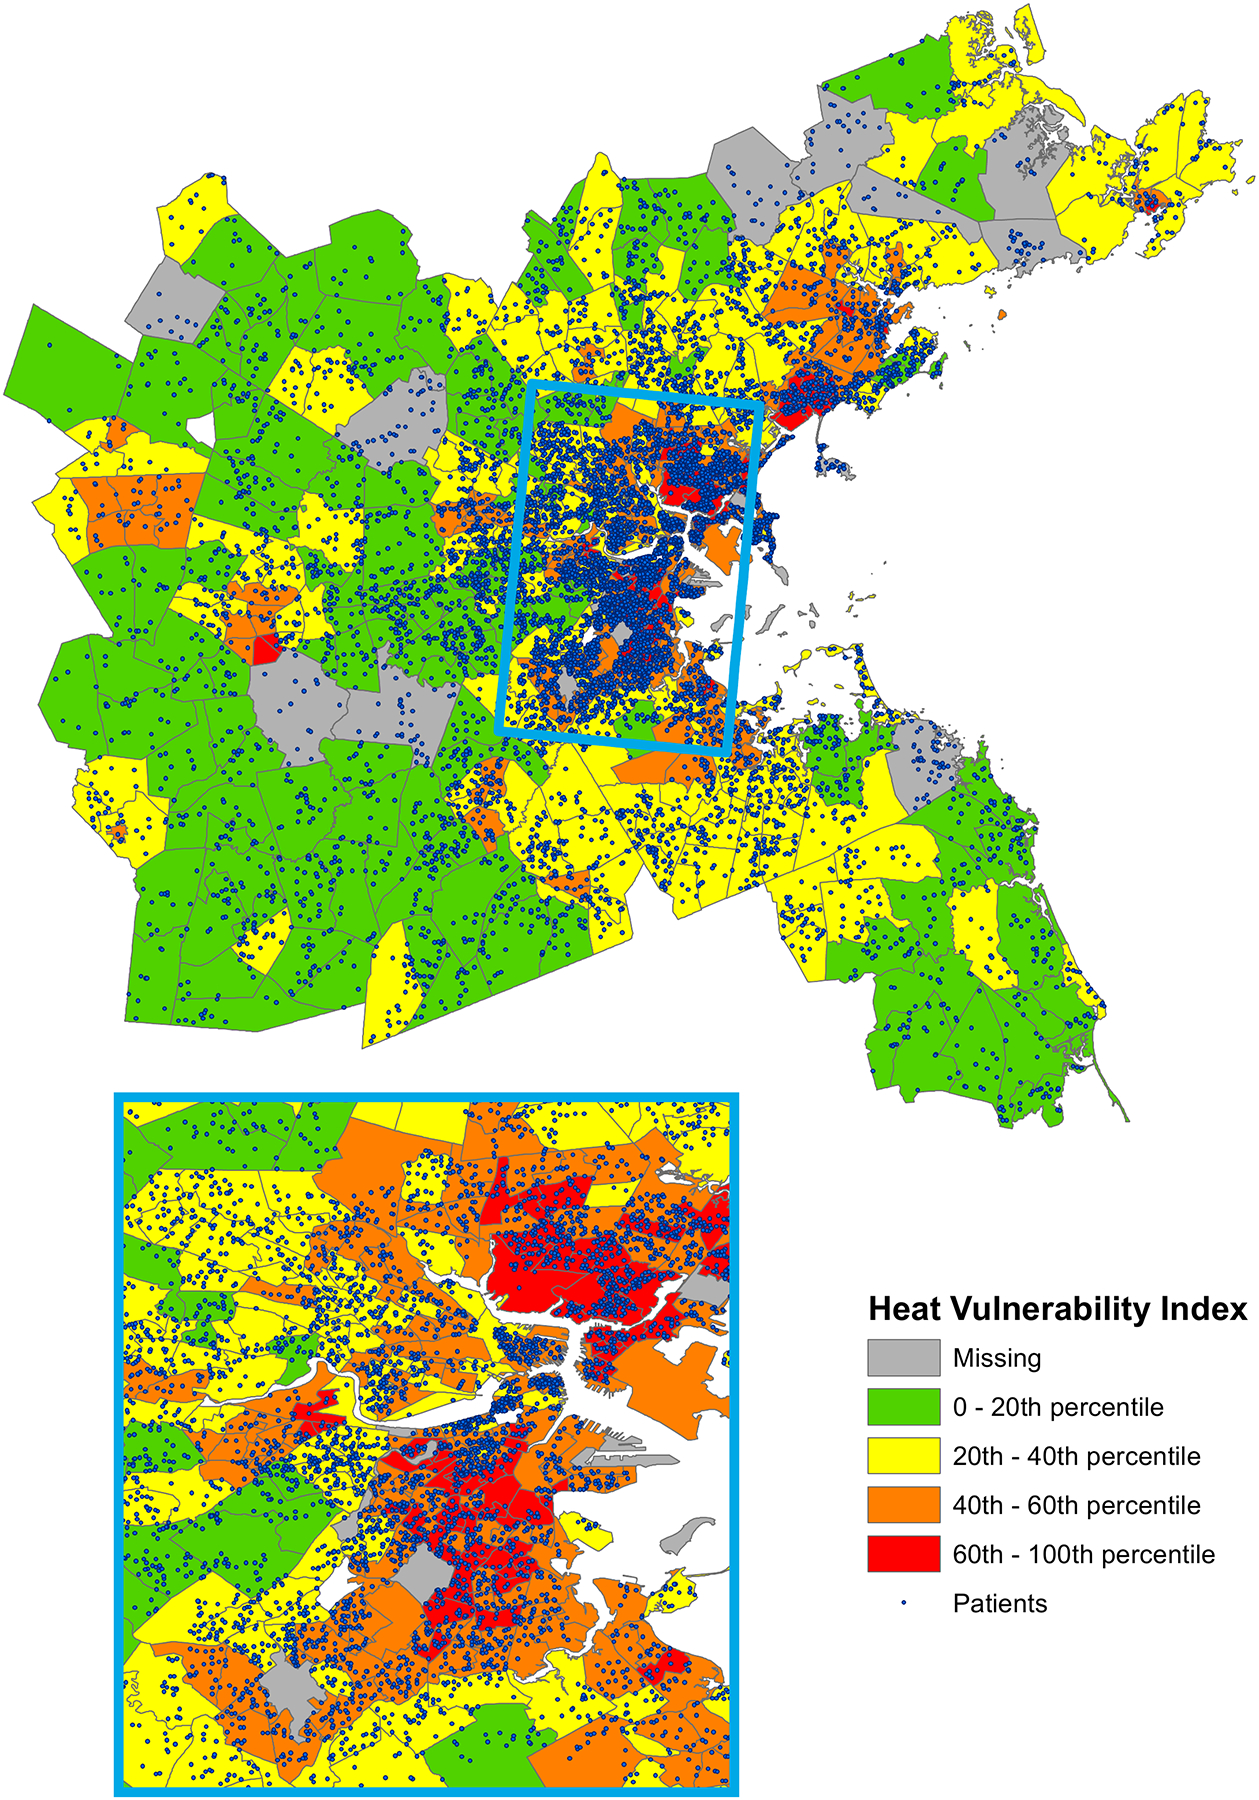
Methods: Using a Massachusetts multihospital centralized clinical data repository, we identified individuals ≥18 years of age with a rheumatic condition who received rheumatology care within 3 years of April 2021. We defined the index date as 2 years before the last encounter and the baseline period as 1 year pre-index date. Addresses were geocoded and linked by census tract to the SVI and the HVI. We used multilevel, multinomial logistic regression to examine the odds of 1-3 and ≥4 hospitalizations (reference = 0) over 2 years post index date by vulnerability index, adjusting for age, gender, race/ethnicity, insurance, and comorbidities.
Results: Among 14,401 individuals with rheumatic conditions, the mean ± age was 61.9 ± 15.7 years, 70% were female, 79% White, 7% Black, and 2% Hispanic. There were 8,251 hospitalizations; 11,649 individuals (81%) had 0 hospitalizations, 2,063 (14%) had 1-3, and 689 (5%) had ≥4. Adjusting for individual-level factors, individuals living in the highest versus lowest SVI areas had 1.84 times higher odds (95% confidence interval [95% CI] 1.43-2.36) of ≥4 hospitalizations. Individuals living in the highest versus lowest HVI areas had 1.64 times greater odds (95% CI 1.17-2.31) of ≥4 hospitalizations.
Conclusion: Individuals with rheumatic conditions living in areas with high versus low social and heat vulnerability had significantly greater odds of recurrent hospitalizations. Studies are needed to determine modifiable factors to mitigate risks.
© 2022 American College of Rheumatology.
Figures

References
-
- About Social Determinants of Health (SDOH). [cited 2022 March 7, 2022]; Available from: https://www.cdc.gov/socialdeterminants/about.html
Publication types
MeSH terms
Grants and funding
LinkOut - more resources
Full Text Sources
Miscellaneous
