. 2022 Aug 22:13:937970.
doi: 10.3389/fmicb.2022.937970. eCollection 2022.

HupB, a nucleoid-associated protein, is critical for survival of Mycobacterium tuberculosis under host-mediated stresses and for enhanced tolerance to key first-line antibiotics

Affiliations

HupB, a nucleoid-associated protein, is critical for survival of Mycobacterium tuberculosis under host-mediated stresses and for enhanced tolerance to key first-line antibiotics

Niti Singh et al. Front Microbiol. .

Abstract

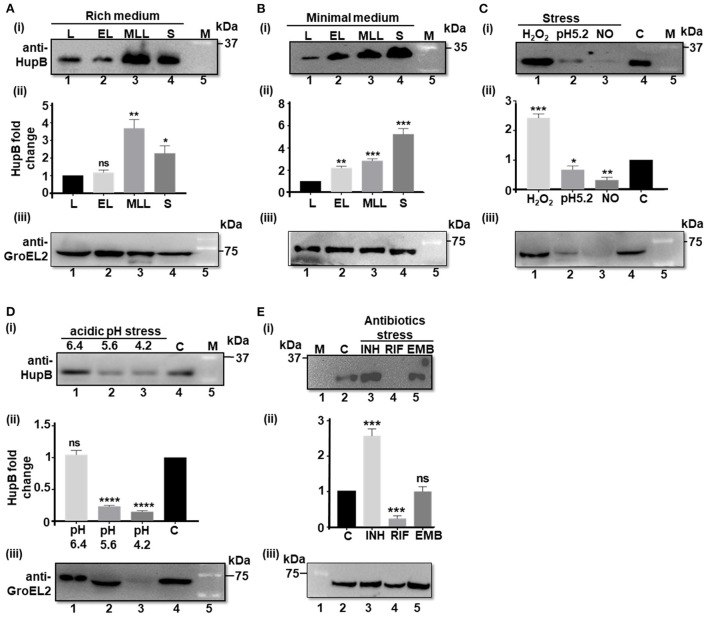
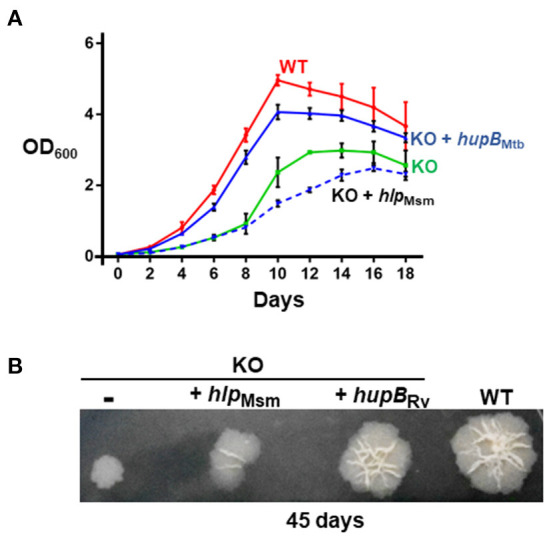
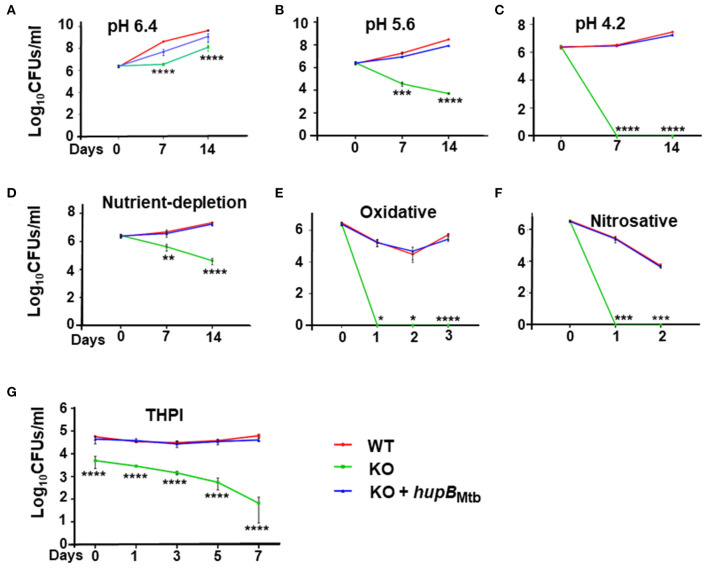
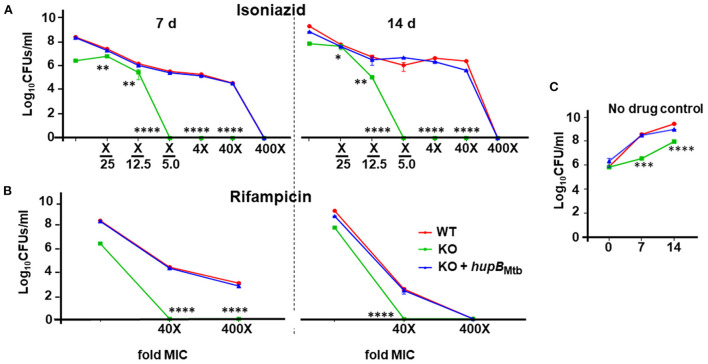
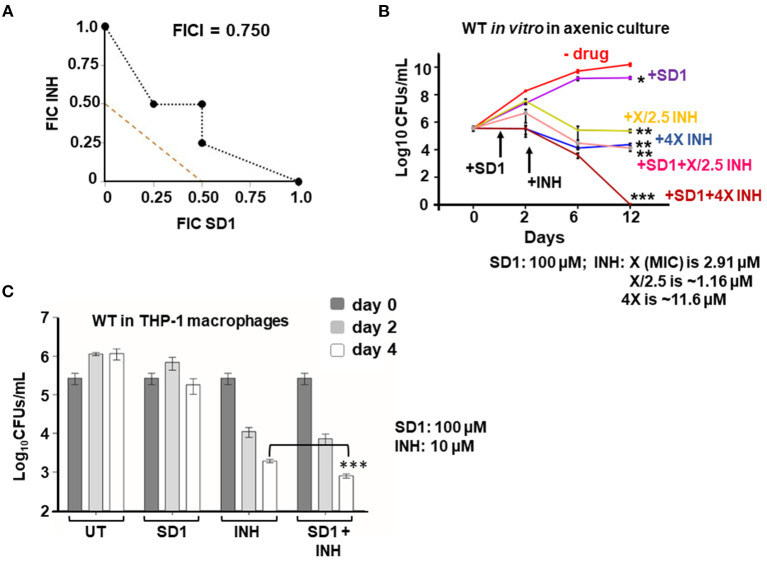
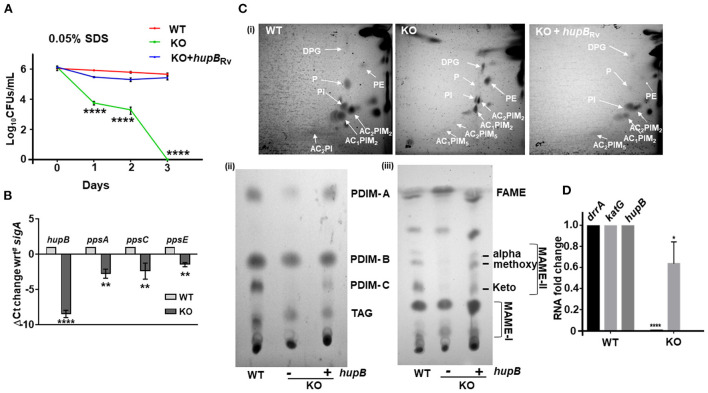
To survive and establish its niche, Mycobacterium tuberculosis (Mtb) engages in a steady battle against an array of host defenses and a barrage of antibiotics. Here, we demonstrate that Mtb employs HupB, a nucleoid-associated protein (NAP) as its key player to simultaneously battle and survive in these two stress-inducing fronts. Typically, NAPs are key to bacterial survival under a wide array of environmental or host-mediated stresses. Here, we report that for Mtb to survive under different macrophage-induced assaults including acidic pH, nutrient depletion, oxidative and nitrosative stresses, HupB presence is critical. As expected, the hupB knockout mutant is highly sensitive to these host-mediated stresses. Furthermore, Mtb aptly modulates HupB protein levels to overcome these stresses. We also report that HupB aids Mtb to gain tolerance to high levels of rifampicin (RIF) and isoniazid (INH) exposure. Loss of hupB makes Mtb highly susceptible to even short exposures to reduced amounts of RIF and INH. Overexpressing hupB in Mtb or complementing hupB in the hupB knockout mutant triggers enhanced survival of Mtb under these stresses. We also find that upon loss of hupB, Mtb significantly enhances the permeability of its cell wall by modulating the levels of several surface lipids including phthiocerol dimycocerosates (PDIMs), thus possibly influencing overall susceptibility to host-mediated stresses. Loss of hupB also downregulates efflux pump expression possibly influencing increased susceptibility to INH and RIF. Finally, we find that therapeutic targeting of HupB with SD1, a known small molecule inhibitor, significantly enhances Mtb susceptibility to INH and THP-1 macrophages and significantly reduces MIC to INH. Thus, our data strongly indicate that HupB is a highly promising therapeutic target especially for potential combinatorial shortened therapy with reduced INH and RIF doses.

Keywords: Hlp; HupB; Mycobacterium smegmatis; Mycobacterium tuberculosis; SD1; antibiotics; stress.


Conflict of interest statement

The authors declare that the research was conducted in the absence of any commercial or financial relationships that could be construed as a potential conflict of interest.

Figures

Figure 1
Figure 1
HupB protein levels significantly alter in response to Mtb exposure to different host-mediated stresses imposed in vitro. (A) WT (H37Rv) grown in different phases in rich (7H9 + 1 × OADC +0.05% Tween-80), and (B) nutrient-depleted/minimal media (Sauton's) or (C–E) grown under different stress conditions (details are shown in Materials and methods#) was pelleted down, washed, and lysed by bead beating. Equal quantity of lysate proteins (~ 30 μg; also refer to Supplementary Figures 1, 2) was boiled for 15 min in 1 × Laemmli sample buffer and resolved (in 15% SDS-PAGE). Western blot analyses were performed with a purified polyclonal anti-HupB antibody [(i) of (A–E)] and a polyclonal anti-GroEL2 antibody [(iii) of (A–E)]. The intensity of HupB bands was semi-quantified with a densitometer scan (GelDoc, BioRad) and plotted as HupB fold change [Y-axis; (ii) of (A–E)]. (A,B) L, lag phase; EL, early Log phase; MLL, mid to late log phase; S, stationary phase. (C) H2O2, oxidative stress imposed for 3 days (d) with 5 mM hydrogen peroxide; NO, nitrosative stress imposed for 3 days with 1 mM sodium nitrite at pH 5.2 (rich medium). (D) pH stress (pH 6.4, 5.6, and 4.2) imposed for 3 days in the rich medium. (E) INH, isoniazid (2.91 μM); RIF, rifampicin (6 nM); EMB, ethambutol (9.79 μM). All antibiotic exposures were for 5 days. kDa, kilo Daltons; C, control (no treatment, bacteria grown in rich medium); M, reference protein marker [for (B) (i) - Genedirex protein marker (Cat # PM007-0500) and for (i) of (A,C–E), BioRad protein marker (Cat # 1610373), respectively]; numericals immediately underneath Western blots i.e., (i) and (iii) of (A–E) indicate lanes. (ii) of (A–E) represents HupB protein level fold change (Y-axis) determined from three independent (biological triplicates) Western blots (only one shown here); control, bacteria grown in rich medium, plotted as fold change value “1.” Significance evaluated by Student t-test (comparative analyses with control). *p < 0.05, **p < 0.01, ***p < 0.005, and ****p < 0.001; ns non-significant. All the experiments were performed at least three independent times. The semi-quantitations of the protein bands [as in (ii) of (A–E) are thus an average of semi-quantitation performed on images from all the three independent experiments (biological triplicates)]. The best representative blots are shown in this Figure. #For protein analyses, Mtb had to be subjected to sub-lethal doses such that the stress is imposed but bacteria do not die.
Figure 2
Figure 2
Loss of hupB significantly restricts Mtb growth in vitro. WT (red), KO (green), KO+hupB (blue), and KO+hlp (blue-dashed line) were grown in vitro in the rich medium, in (A) broth (liquid) and on (B) agar (solid). (A) Growth was initiated at 0.05 OD600 in the rich medium and monitored as OD600 (Y-axis) for 18 days (X-axis). OD600 was recorded in technical duplicates and averaged. Three biological triplicate cultures were monitored for growth. Thus, the OD600 plotted (Y-axis) is an average (plus standard deviation) of three OD600 values. (B) Five μL of 0.05 OD600 cultures (approximately equal number of bacterial cells) were spotted on rich medium agar plates, and colony morphology was observed after 45 days. Approximately equal CFUs were spotted (WT 1.65 × 10⁵ CFUs/ml, KO 1.66 × 10⁵ CFUs/ml, KO+hupB 1.56 × 10⁵ CFUs/ml, and KO+hlp 1.6 × 10⁵ CFUs/ml. The “-” in the 1st spot of (B) indicates KO with plain vector.
Figure 3
Figure 3
Loss of hupB makes Mtb highly sensitive to host-simulated stress conditions. WT (red), KO (green), and KO+hupB (blue) were grown in the rich medium to ~0.8 OD600, washed, and subcultured at 0.05 OD600. When absorbance reached 0.2–0.3 OD600, they were washed and normalized to 0.25 OD600. Five-ml cultures of each strain were subjected to various forms of host-simulated stress. (A–C) pH of the rich medium (pH 7.4) was reduced to pH as denoted; (D) medium was changed to 1X TBST (2.5 mM Tris, 4.2 mM NaCl, and 0.05% Tween 80); (E) oxidative stress was induced with 10 mM H2O2; (F) nitrosative stress was induced with 5 mM nitric oxide; (G) equal number (CFUs/ml) of the WT, KO, and KO+hupB cultures were washed in RPMI and used for infecting PMA (phorbol 12-myristate-13-acetate)-differentiated THP-1 macrophages at 1:10 MOI. After 4 h of infection, extracellular bacteria were killed with amikacin (200 μg/ml), THP-1 macrophages lysed with 0.1% Triton-X-100 at different time points (days on X-axis). The lysates obtained were plated on 7H11 + OADC + cycloheximide (50 μg/ml), CFUs were enumerated, and standard deviation values were calculated and then plotted as Log10 CFUs/ml (Y-axis). Student t-test was performed for comparative analyses, and significance was evaluated. *p < 0.05, ** p < 0.01, *** p < 0.005, and **** p < 0.001. The data are a representation of biological triplicates and technical duplicates.
Figure 4
Figure 4
Loss of hupB makes Mtb highly susceptible in vitro to reduced amount of INH and RIF. WT (red), KO (green), and KO+hupB (blue) were separately grown in the rich medium to ~0.8 OD600, washed, and subcultured at 0.05 OD600. When absorbance reached 0.4–0.6 OD600, they were washed and then normalized to 0.1 OD600. Five-ml cultures were imparted stress with (A) isoniazid and (B) rifampicin for 7 and 14 days (separated by a broken black straight line) with varying concentrations (X-axis, denoted as “fold MIC” (minimum inhibitory concentration; MIC denoted as X) and by dilution of surviving bacteria plated on 7H11 + OADC + cycloheximide (50 μg/ml) and enumerated as Log10CFUs/ml (Y-axis). MIC for isoniazid and rifampicin is 2.91 μM and 6 nM, respectively. Three biological triplicates were set up, CFUs were enumerated by technical duplicates, numbers were averaged, and SD values calculated were curve-plotted. Student t-test was performed for comparative analyses, and significance was evaluated. *p < 0.05, ** p < 0.01, *** p < 0.005, and **** p < 0.001. The data are a representation of biological triplicates and technical duplicates. (C) Growth on days 7 and 14 of the three mycobacterial strains [used in (A) and (B)] without antibiotics (no drug control).
Figure 5
Figure 5
Therapeutic targeting of HupB enhances Mtb's susceptibility in vitro to reduced amount of INH. (A) Isobolograph reflecting the in vitro drug combination of SD1 and INH. Two-drug checkerboard was setup on 96-well “U” bottom plates (broth microdilution method; details in Materials and methods) with two-fold serial dilutions of different concentrations of SD1 (0.39–200 μM) cross-diluted with different concentrations of INH (0.01–0.8 μM). Early logarithmic phase (~0.2 OD600) culture of WT was diluted 1,000-fold, and approximately 103 was added to and incubated at 37°C for 10–14 days. FIC (fractional inhibitory concentration) and FICI (fractional inhibitory concentration index) values for their combination were calculated and plotted. (B) Evaluation of the combination of SD1 and INH on WT growth in vitro and its survival. WT was grown to 0.2–0.3 OD600, washed, and cultured to 0.1 OD600. Approximately 5-ml culture of the WT was subjected to treatment with indicated concentrations of INH alone or in combination with SD1 (details in Materials and methods). Growth/survival (log10CFUs/ml; Y-axis) was monitored for over 12 days (X-axis) and plotted. (C) Evaluation of the combination of SD1 and INH on WT growth in THP-1 macrophages. THP-1 macrophages were infected with the WT at an MOI of 1:10, treated with INH alone or in combination with SD1 (at indicated concentrations), and then monitored for bacterial load after 2 and 4 days. Bacteria were collected by lysing THP-1 macrophages with 0.1% Triton-X-100. Their numbers in CFUs were enumerated 3 weeks after plating. The enumerated CFUs were averaged, SD value was calculated and then plotted (log10 CFUs/ml; Y-axis). Student t-test was performed for comparative analyses, and significance was evaluated. *p < 0.05, ** p < 0.01, and *** p < 0.005. The data are a representation of biological triplicates and technical duplicates.
Figure 6
Figure 6
Loss of hupB in Mtb alters membrane permeability through reduced expression of polyketide synthases and altered levels of polar and apolar lipids. (A) Enhanced permeability of membrane and susceptibility of KO to 0.05% SDS. WT (red), KO (green), and KO+hupB (blue) were grown in the rich medium to 0.6–0.8 OD600, washed, and subcultured to 0.05 OD600. When absorbance reached 0.2–0.3 OD600, cells were washed and normalized to 0.25 OD600. Approximately 15 ml of cultures of each strain were subjected to stress. Membrane permeability was assessed by exposing bacterial strains (biological triplicates) for 72 h (time on X-axis) to 0.05% SDS. Cultures were plated on appropriate medium, CFUs were enumerated and averaged, and SD values were calculated and then plotted as log10 CFUs/ml scale on the Y-axis. Student t-test was performed for comparative analyses, and significance was evaluated. **** p < 0.001. The data are a representation of biological triplicates and technical duplicates for SDS stress, while in the case of lipid, it is perform in biological triplicates. (B) Comparative gene expression analyses of type I polyketide synthases. WT and KO were grown to 0.8 OD600 in vitro, washed, subcultured to 0.05 OD600, and grown to ~1OD600, RNA was isolated (from 10-ml cultures), RT-PCR was performed, and ΔCt value of sigA was plotted. (C) KO exhibits altered levels of polar and apolar lipids. WT, KO, and KO+hupB were grown to 1 OD600 (100-ml cultures), and total lipids were extracted (details in Materials and methods). [(C)-i]: Equal quantity (for WT and KO+hupB) or three times the quantity (for KO) of polar lipid fractions from the three strains were separated by 2-dimensional TLC [in chloroform:methanol:water (60:25:4) in the 1st direction and chloroform:acetic acid:methanol:water (40:25:3:6) for the 2nd direction], and then plates were charred (using hot plate) and detected by 10% phosphomolybdic acid spray. White arrows point to specific lipids. DPG, diphosphatidyl glycerol; PI, phosphatidylinositol, PIMs, phosphatidylinositol mannosides, P, phospholipid. [(C)-ii]: Equal quantity (for WT and KO+hupB) or three times the quantity (for KO) of apolar lipid (PDIM, phthiocerol dimycocerosate; TAG, triacylglycerol) fractions were separated by 1-dimensional TLC [in petroleum ether:diethyl ether (85: 15)], and plates were charred and detected by 10% phosphomolybdic acid spray. [(C)-iii] Equal quantity (for WT and KO+hupB) or three times the quantity (for KO) of mycolic acid (FAME-fatty acid methyl esters; MAMEs I and II, family of mycolic acid methyl esters) fractions were separated by 1-dimensional TLC [using solvent hexane: ethyl acetate (95:5)], and plates were charred and detected by 10% phosphomolybdic acid (in ethanol) spray (Fontán et al., 2009). (D) Comparative gene expression analyses of an efflux pump (drrA) and katG (catalase peroxidase-peroxynitritase). WT and KO were grown to 0.8 OD600 in vitro, washed, subcultured to 0.05 OD600, and grown to ~1 OD600, RNA was isolated (from 10-ml cultures), RT-PCR was performed, and RNA fold change was plotted. *p < 0.05, ** p < 0.01. The data are a representation of biological triplicates and technical duplicates.

Similar articles

Cited by

References

    1. Ali Azam T., Iwata A., Nishimura A., Ueda S., Ishihama A. (1999). Growth phase-dependent variation in protein composition of the Escherichia coli nucleoid. J. Bacteriol. 181, 6361–6370. 10.1128/JB.181.20.6361-6370.1999 - DOI - PMC - PubMed
    1. Ando H., Kitao T., Miyoshi-Akiyama T., Kato S., Mori T., Kirikae T. (2011). Downregulation of katG expression is associated with isoniazid resistance in Mycobacterium tuberculosis. Mol. Microbiol. 79, 1615–1628. 10.1111/j.1365-2958.2011.07547.x - DOI - PubMed
    1. Anil Kumar V., Goyal R., Bansal R., Singh N., Sevalkar R. R., Kumar A., et al. . (2016). EspR-dependent ESAT-6 protein secretion of Mycobacterium tuberculosis requires the presence of virulence regulator PhoP*. J. Biol. Chem. 291, 19018–19030. 10.1074/jbc.M116.746289 - DOI - PMC - PubMed
    1. Anuchin A. M., Goncharenko A. V., Demina G. R., Mulyukin A. L., Ostrovsky D. N., Kaprelyants A. S. (2010). The role of histone-like protein, Hlp, in Mycobacterium smegmatis dormancy. FEMS Microbiol. Lett. 308, 101–107. 10.1111/j.1574-6968.2010.01988.x - DOI - PubMed
    1. Arora G., Bothra A., Prosser G., Arora K., Sajid A. (2021). Role of post-translational modifications in the acquisition of drug resistance in Mycobacterium tuberculosis. FEBS J. 288, 3375–3393. 10.1111/febs.15582 - DOI - PubMed