Next-generation Mobile Cardiac Telemetry: Clinical Value of Combining Electrocardiographic and Physiologic Parameters
- PMID: 36072445
- PMCID: PMC9436405
- DOI: 10.19102/icrm.2022.130807
Next-generation Mobile Cardiac Telemetry: Clinical Value of Combining Electrocardiographic and Physiologic Parameters
Abstract
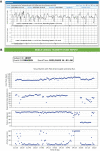
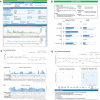
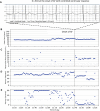
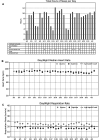
The ZOLL Arrhythmia Monitoring System, a mobile cardiac telemetry (MCT) device from ZOLL Corporation (Chelmsford, MA, USA), records single-channel electrocardiogram (ECG) signals, heart rate, activity, respiratory rate, and posture. Comprehensive reporting from these multiple biometrics may provide a global evaluation of arrhythmic or other cardiovascular risks in individual patients and insights into the patient's overall wellness and health status. The objective of the study was to evaluate the physician-perceived utility of adding biometric data to the traditional ECG-only-based assessment and subject-reported symptoms. This prospective study recruited candidates for MCT. Independent event and end-of-use (EOU) reports based on ECG and biometrics data were provided to physicians. To document whether the biometric data affected treatment plan decisions or added value over the ECG-alone data, physicians completed a questionnaire for each report. Additionally, they completed the questionnaire to understand the utility of the subject wellness information provided in the EOU report. From December 2020 to July 2021, 583 patients were enrolled by 27 physicians from 18 cardiology practices in the United States. When using biometrics data compared to the ECG alone, this study found that 96% of the physicians made changes to the treatment plan that initially was based on the ECG alone. The biometrics-based changes involved 64% of all patients (n = 535), and included modifications to medications, follow-up, and lifestyle in 18%, 19%, and 63% of the subjects, respectively. In this largest MCT study conducted to date, next-generation MCT, by providing multiple biometric parameters along with ECG data, improves physicians' ability to make patient management decisions. This added functionality and clarity may replace traditional "ECG with diary"-based monitoring.
Keywords: Biometrics; patient management; remote monitoring.
Copyright: © 2022 Innovations in Cardiac Rhythm Management.
Conflict of interest statement
The authors report no conflicts of interest for the published content. Funding was provided by ZOLL Corporation.
Figures


References
-
- Bennett DH. Bennett’s Cardiac Arrhythmias Practical Notes on Interpretation and Treatment. 8th ed. London: Hodder Arnold; 2013.
-
- Sampson M. Ambulatory electrocardiography: indications and devices. Br J Card Nurs. 2019;14(3):114–121. doi: 10.12968/bjca.2019.14.3.114. - DOI
-
- Zimetbaum P, Goldman A. Ambulatory arrhythmia monitoring: choosing the right device. Circulation. 2010;122(16):1629–1636. [CrossRef] [PubMed] - DOI - PubMed
-
- Dillier R, Baumann M, Young M, et al. Continuous respiratory monitoring for sleep apnea screening by ambulatory hemodynamic monitor. World J Cardiol. 2012;4(4):121–127. [CrossRef] [PubMed] - DOI - PMC - PubMed
-
- Goetze S, Zhang Y, An Q, Averina V. Ambulatory respiratory rate trends identify patients at higher risk of worsening heart failure in implantable cardioverter defibrillator and biventricular device recipients: a novel ambulatory parameter to optimize heart failure management. J Interv Card Electrophsiology. 2015;(43):21–29. [CrossRef] [PubMed] - DOI - PMC - PubMed
LinkOut - more resources
Full Text Sources
