. 2022 Aug 22:13:958200.
doi: 10.3389/fimmu.2022.958200. eCollection 2022.

Epigenetic regulation of transcription factor binding motifs promotes Th1 response in Chagas disease cardiomyopathy

Affiliations

Epigenetic regulation of transcription factor binding motifs promotes Th1 response in Chagas disease cardiomyopathy

Pauline Brochet et al. Front Immunol. .

Abstract

Chagas disease, caused by the protozoan Trypanosoma cruzi, is an endemic parasitic disease of Latin America, affecting 7 million people. Although most patients are asymptomatic, 30% develop complications, including the often-fatal Chronic Chagasic Cardiomyopathy (CCC). Although previous studies have demonstrated some genetic deregulations associated with CCCs, the causes of their deregulations remain poorly described. Based on bulk RNA-seq and whole genome DNA methylation data, we investigated the genetic and epigenetic deregulations present in the moderate and severe stages of CCC. Analysis of heart tissue gene expression profile allowed us to identify 1407 differentially expressed transcripts (DEGs) specific from CCC patients. A tissue DNA methylation analysis done on the same tissue has permitted the identification of 92 regulatory Differentially Methylated Regions (DMR) localized in the promoter of DEGs. An in-depth study of the transcription factors binding sites (TFBS) in the DMRs corroborated the importance of TFBS's DNA methylation for gene expression in CCC myocardium. TBX21, RUNX3 and EBF1 are the transcription factors whose binding motif appears to be affected by DNA methylation in the largest number of genes. By combining both transcriptomic and methylomic analysis on heart tissue, and methylomic analysis on blood, 4 biological processes affected by severe CCC have been identified, including immune response, ion transport, cardiac muscle processes and nervous system. An additional study on blood methylation of moderate CCC samples put forward the importance of ion transport and nervous system in the development of the disease.

Keywords: Chagas disease; Th1 response; dilated cardiomyopathy; epigenetic; methylation; transcription factors.


Conflict of interest statement

The authors declare that the research was conducted in the absence of any commercial or financial relationships that could be construed as a potential conflict of interest.

Figures

Figure 1
Figure 1
Workflow overview. Heart tissue RNAseq (orange) analysis was performed using classical steps: quality control, alignment, gene expression quantification and normalization. Then, three different analyses were done: deconvolution analysis, differentially expressed genes functional enrichment and non-coding RNAs characterization. Heart tissue (blue) and blood (green) methylation analysis followed the same first steps: quality control, normalization, batch effect correction, differential methylation position (DMP) test and DMPs associated genes functional enrichment. In tissue samples, a transcription factor binding site (TFBS) enrichment was carried out on differentially methylated regions (DMRs).
Figure 2
Figure 2
Analysis of samples clustering based on differentially expressed genes or differentially methylated CpG sites. Control samples identifiers are written in blue whereas case samples identifiers are written in red. (A) Hierarchical Clustering Analysis (HCA) performed on 6 control and 8 case samples, based on expression of 1409 differentially expressed genes. (B) Hierarchical Clustering Analysis (HCA) performed on the same samples as in A), based on methylation level of 16883 differentially methylated position.
Figure 3
Figure 3
Gene Ontology Biological Process affected in severe CCC and/or DCM. Bubble chart of Gene Ontology Biological Process according to percent of severe CCC differentially expressed genes (DEG) and percent of total DEG (severe CCC + DCM) involved in each GO term. The size of each dot is associated to the enrichment of each GO term [-log10(FDR)] and its color to disease specificity (from green for DCM to red for severe CCC).
Figure 4
Figure 4
Analysis of the relation between TFBS (Transcription Factor Binding Site). (A) Schematic illustration of the three approaches used in this analysis. Differentially methylated region (DMR) is highlighted in blue, gene regulatory region in green, and transcription factor (TF) in orange. Analysis 1: TFBS enrichment in regulatory region containing at least one DMR, compared to all genome regulatory region. For each gene, a regulatory region is defined as the region from TSS-1500 to first exon. Analysis 2: TFBS enrichment in DMR compared to all genome regulatory region. Analysis 3: TFBS enrichment in DMR compared to regulatory region containing at least one DMR. (B) Scatter plot of the log2(FC) obtained with the analysis 1 and 2 and Spearman correlation of these values. The fold change is computed according to the observed S value compared to obtained S value, S corresponding to the number of overlapping bases between TFBS and query region. (C) Distribution of the log2(FC) obtained with the 3 approaches.
Figure 5
Figure 5
Predicted regulatory interaction in IFNy-Th1 pathway. Network composed by 19 genes involved in IFNy-Th1 pathway, and the top 7 TF predicted as targeting those 19 genes, according to OLOGRAM based on ReMap database. TF are written in blue in diamond, and genes in black in rectangle. Shapes borders are colored according to the fold change, from green to red.
Figure 6
Figure 6
TFBS affected by methylation in RUNX3 regulatory region. Schematic representation of all TFBS found in RUNX3 regulatory region, using FIMO and Jaspar database. For each TFBS region, all the transcription factor predicted as affected by a differentiation of methylation in this region are rank by FIMO pvalue (***pvalue ≤ 0.001, **pvalue ≤ 0.01, *pvalue ≤ 0.05). The top-rank TF binding profile is shown, as well as the differentially methylated position in the TFBS.
Figure 7
Figure 7
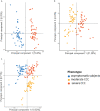
Analysis of samples distribution in the space of differentially methylated CpG sites for asymptomatic, moderate CCC and severe CCC samples. (A) Scatterplot of the two principal components of a PCA executed in the space of the 12624 CpG positions differentially methylated (DMP) between 48 asymptomatic blood samples and 90 CCC blood samples. (B) Scatterplot of the two principal components of a PCA executed in the space of the 6735 DMPs between 47 moderate CCC blood samples and 43 severe CCC blood samples. (C) Scatterplot of the two principal components of a PCA executed in the space of the 18889 CpG positions (union of the two previous sets) for the three groups of samples.
Figure 8
Figure 8
Comparison of differentially expressed genes, genes affected by methylation in tissue dataset and genes affected by methylation in blood dataset. (A) Venn diagram of top 1000 genes differentially expressed or methylated in previous tissue RNA-seq, tissue DNA methylation and blood DNA methylation analysis between control/asymptomatic and severe CCC samples. (B) Graph of the Gene ontology Biological Processes analysis of dysregulated element between control/asymptomatic and severe CCC. Nodes represents biological processes terms and are divided in 3 colors, according to the proportion of genes from RNA-seq (red), tissue methylation (blue) or blood methylation (green) analysis. Edges in the graph link GO terms having gene in common. 3 principal terms are highlighted in this synthesis. More precisely, several groups of gene ontology are enriched, involved in biological process related to: 1) lymphocyte activation; 2) Regulation of immune-system process; 3) Cytokine production; 4) Interferon gamma production; 5) Regulation of interleukin production; 6) Defense response; 7) System development; 8) Anatomical structure morphogenesis; 9) Metal ion transport; 10) Cation homeostasis.

References

    1. Pérez-Molina JA, Molina I. Chagas disease. Lancet (2018) 391(10115):82−94. doi: 10.1016/S0140-6736(17)31612-4 - DOI - PubMed
    1. Freitas HFG, Chizzola PR, Paes ÂT, Lima ACP, Mansur AJ. Risk stratification in a Brazilian hospital-based cohort of 1220 outpatients with heart failure: role of chagas’ heart disease. Int J Cardiol (2005) 102(2):239−47. doi: 10.1016/j.ijcard.2004.05.025 - DOI - PubMed
    1. Morillo CA, Marin-Neto JA, Avezum A, Sosa-Estani S, Rassi A, Rosas F, et al. . Randomized trial of benznidazole for chronic chagas’ cardiomyopathy. New Engl J Med (2015) 373(14):1295−306. doi: 10.1056/NEJMoa1507574 - DOI - PubMed
    1. Abel LC, Rizzo LV, Ianni B, Albuquerque F, Bacal F, Carrara D, et al. . Chronic chagas’ disease cardiomyopathy patients display an increased IFN-gamma response to trypanosoma cruzi infection. J Autoimmun (2001) 17(1):99−107. doi: 10.1006/jaut.2001.0523 - DOI - PubMed
    1. Cunha-Neto E, Dzau VJ, Allen PD, Stamatiou D, Benvenutti L, Higuchi ML, et al. . Cardiac gene expression profiling provides evidence for cytokinopathy as a molecular mechanism in chagas’ disease cardiomyopathy. Am J Pathol (2005) 167(2):305−13. doi: 10.1016/S0002-9440(10)62976-8 - DOI - PMC - PubMed

Publication types

Substances