. 2022 Aug 29:2022:1394088.
doi: 10.1155/2022/1394088. eCollection 2022.

Identification of Signal Pathways and Hub Genes of Pulmonary Arterial Hypertension by Bioinformatic Analysis

Affiliations

Identification of Signal Pathways and Hub Genes of Pulmonary Arterial Hypertension by Bioinformatic Analysis

Rui-Qi Wei et al. Can Respir J. .

Abstract

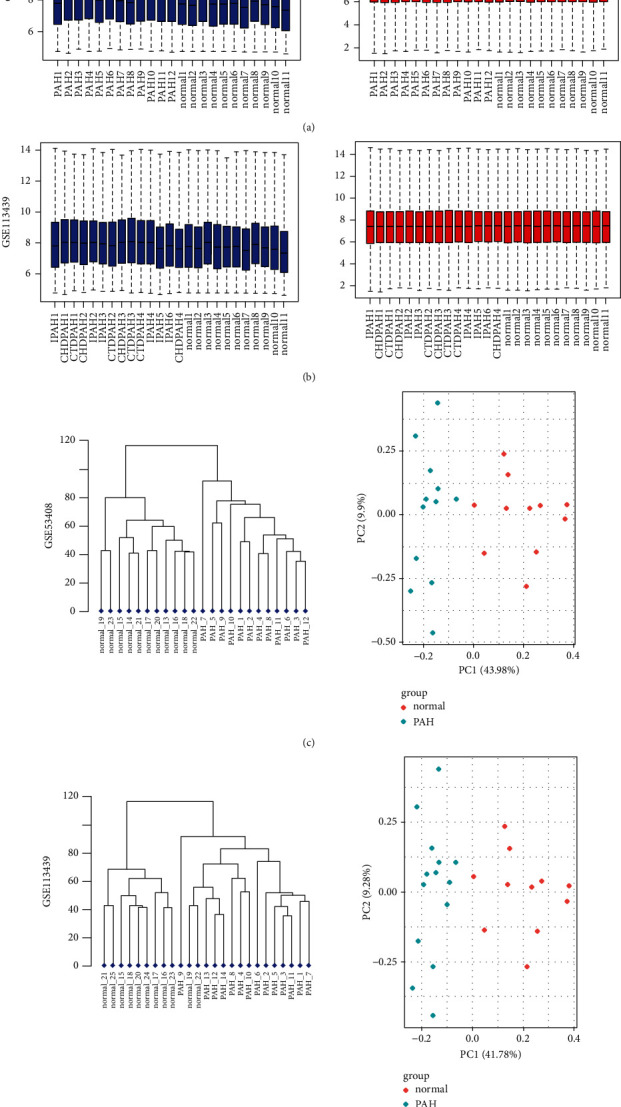
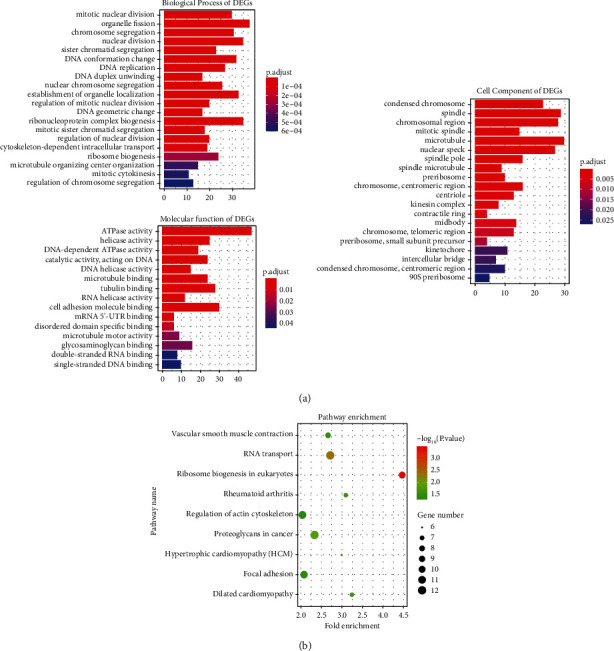
Pulmonary arterial hypertension (PAH) is a progressive and complex pulmonary vascular disease with poor prognosis. The aim of this study was to provide a new understanding of the pathogenesis of disease and potential treatment targets for patients with PAH based on multiple-microarray analysis.Two microarray datasets (GSE53408 and GSE113439) downloaded from the Gene Expression Omnibus (GEO) database were analysed. All the raw data were processed by R, and differentially expressed genes (DEGs) were screened out by the "limma" package. Gene Ontology (GO) and Kyoto Encyclopedia of Genes and Genomes (KEGG) pathway enrichment analyses were performed and visualized by R and Cytoscape software. Protein-protein interactions (PPI) of DEGs were analysed based on the NetworkAnalyst online tool. A total of 442 upregulated DEGs and 84 downregulated DEGs were identified. GO enrichment analysis showed that these DEGs were mainly enriched in mitotic nuclear division, organelle fission, chromosome segregation, nuclear division, and sister chromatid segregation. Significant KEGG pathway enrichment included ribosome biogenesis in eukaryotes, RNA transport, proteoglycans in cancer, dilated cardiomyopathy, rheumatoid arthritis, vascular smooth muscle contraction, focal adhesion, regulation of the actin cytoskeleton, and hypertrophic cardiomyopathy. The PPI network identified 10 hub genes including HSP90AA1, CDC5L, MDM2, LRRK2, CFTR, IQGAP1, CAND1, TOP2A, DDX21, and HIF1A. We elucidated potential biomarkers and therapeutic targets for PAH by bioinformatic analysis, which provides a theoretical basis for future study.


Conflict of interest statement

The authors have no conflicts of interest to declare.

Figures

Figure 1
Figure 1
Normalization of gene expression and cluster analysis and PCA analysis for each sample. (a) Normalization of gene expression for GSE53408 data. (b) Normalization of gene expression for GSE113439 data. Abscissa shows sample lists, and ordinates show the gene expression value (log2 transformed). Blue bars represent the data before normalization, and red bars represent the normalized data. (c) Cluster analysis and PCA analysis for each sample of GSE53408 data. (d) Cluster analysis and PCA analysis for each sample of GSE113439 data. The PAH group data and the normal group data are readily distinguished. Abbreviations: IPAH, idiopathic pulmonary arterial hypertension; CTDPAH, connective tissue disease-associated PAH; CHDPAH, congenital heart disease-associated PAH.
Figure 2
Figure 2
Volcano plots, cluster heatmaps, and Venn diagram of DEGs for GSE53408 and GSE113439 datasets. (a) Volcano plots of GSE53408 and GSE113439 datasets. Red dots represent upregulated genes based on adjusted P value <0.05 and log2FC ≥ 1. Blue dots represent downregulated genes based on adjusted P value<0.05 and log2FC ≤ −1. The black points represent genes with no significant difference. FC is the fold change. (b) Cluster heatmaps of the top 100 significant genes of GSE53408 and GSE113439 data. Red indicates that the gene expression is upregulated, blue indicates that the gene expression is downregulated, and white indicates no significant changes in gene expression. Abbreviations: DEGs, differentially expressed genes. (c) Venn diagram of DEGs, left panel: the upregulated overlapping DEGs in the two datasets are 442; right panel: the downregulated overlapping DEGs in the two datasets are 84.
Figure 3
Figure 3
Barplots of GO enrichment analysis (top 20) and Dotplot of KEGG pathway enrichment analysis. (a) Y-axes show GO enrichment significance items of DEGs in three different functional groups (molecular function, biological processes, and cell composition), and x-axes represent the gene counts enriched in each GO term. Different bar colors represent different adjust P values. Abbreviations: DEGs, differentially expressed genes; GO, gene ontology. (b) Dotplot of KEGG pathway enrichment analysis. Each dot represents a KEGG pathway, and the size of each dot indicates the number of genes in the enrichment pathway.
Figure 4
Figure 4
Significant pathway enrichment of DEGs and PPI network analyses of DEGs in lung tissues of PAH patients. (a) Significant pathway enrichment of DEGs, blue represents the signaling pathway, green represents downregulated genes, and red represents upregulated genes. (b) PPI network analyses of DEGs in lung tissues of PAH patients. DEGs are shown in orange. Most significant hub genes according to the highest number of connections, are arranged in the outermost circle.

Similar articles

Cited by

References

    1. Humbert M., Guignabert C., Bonnet S., et al. Pathology and pathobiology of pulmonary hypertension: state of the art and research perspectives. European Respiratory Journal . 2019;53(1) - PMC - PubMed
    1. Kim D., George M. P. Pulmonary hypertension. Medical Clinics of North America . 2019;103(3):413–423. - PubMed
    1. Klinger J. R., Elliott C. G., Levine D. J., et al. Therapy for pulmonary arterial hypertension in adults: update of the chest guideline and expert panel report. Chest . 2019;155(3):565–586. doi: 10.1016/j.chest.2018.11.030. - DOI - PubMed
    1. Zhang R., Dai L. Z., Xie W. P., et al. Survival of Chinese patients with pulmonary arterial hypertension in the modern treatment era. Chest . 2011;140(2):301–309. doi: 10.1378/chest.10-2327. - DOI - PubMed
    1. Galie N., Humbert M., Vachiery J. L., et al. Esc/ers guidelines for the diagnosis and treatment of pulmonary hypertension: the joint task force for the diagnosis and treatment of pulmonary hypertension of the European society of cardiology (esc) and the European respiratory society (ers): endorsed by: association for European paediatric and congenital cardiology (aepc), international society for heart and lung transplantation (ishlt) European Heart Journal . 2015;37(1):67–119. doi: 10.1093/eurheartj/ehv317. - DOI - PubMed

MeSH terms