

Genome-wide identification, structural analysis and expression profiles of short internodes related sequence gene family in quinoa
- PMID: 36072673
- PMCID: PMC9443693
- DOI: 10.3389/fgene.2022.961925
Genome-wide identification, structural analysis and expression profiles of short internodes related sequence gene family in quinoa
Abstract
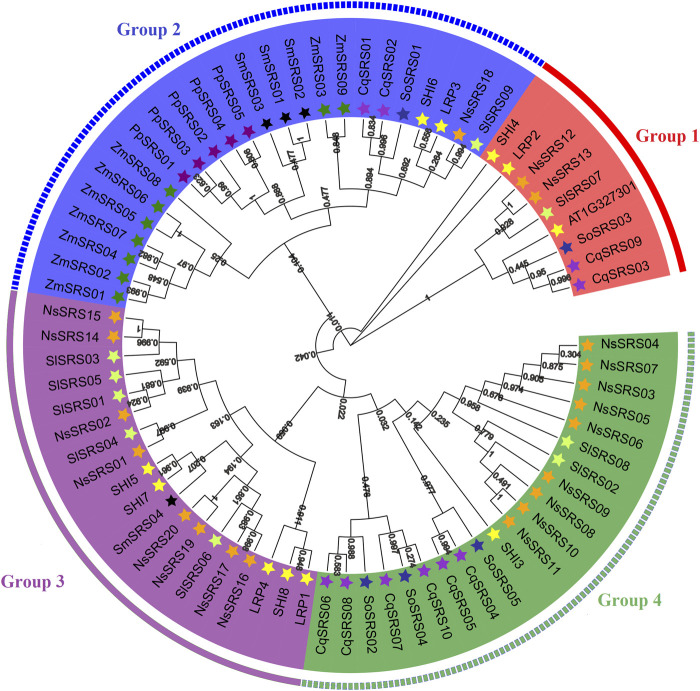
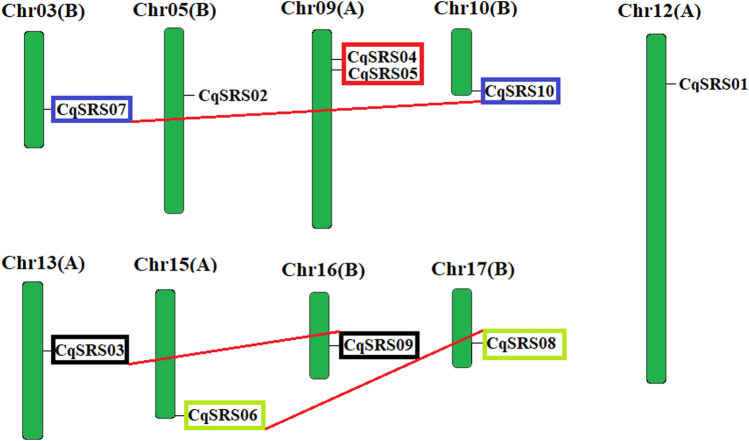
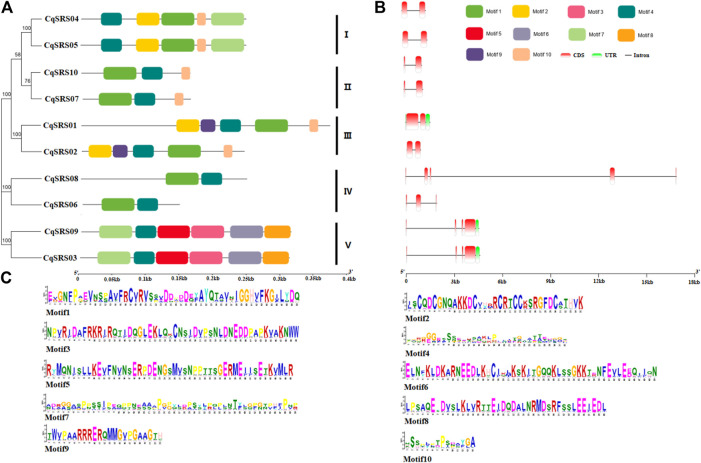
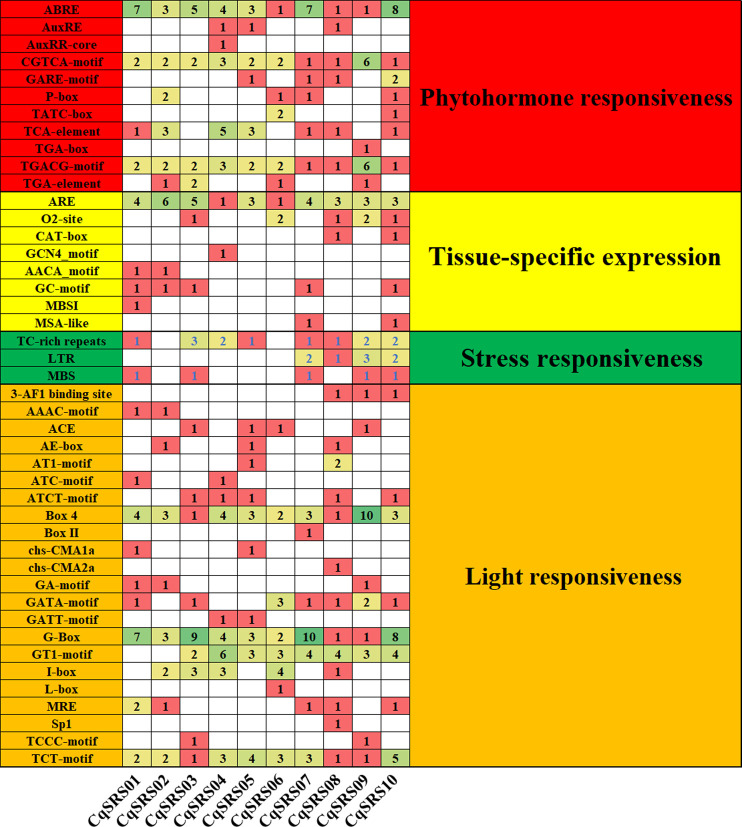
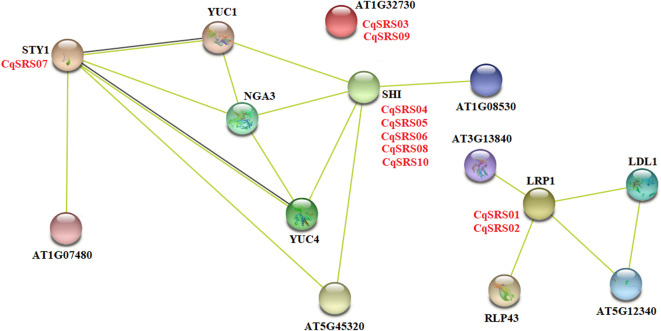
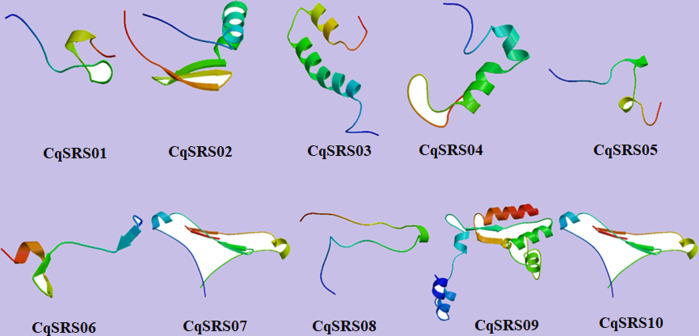
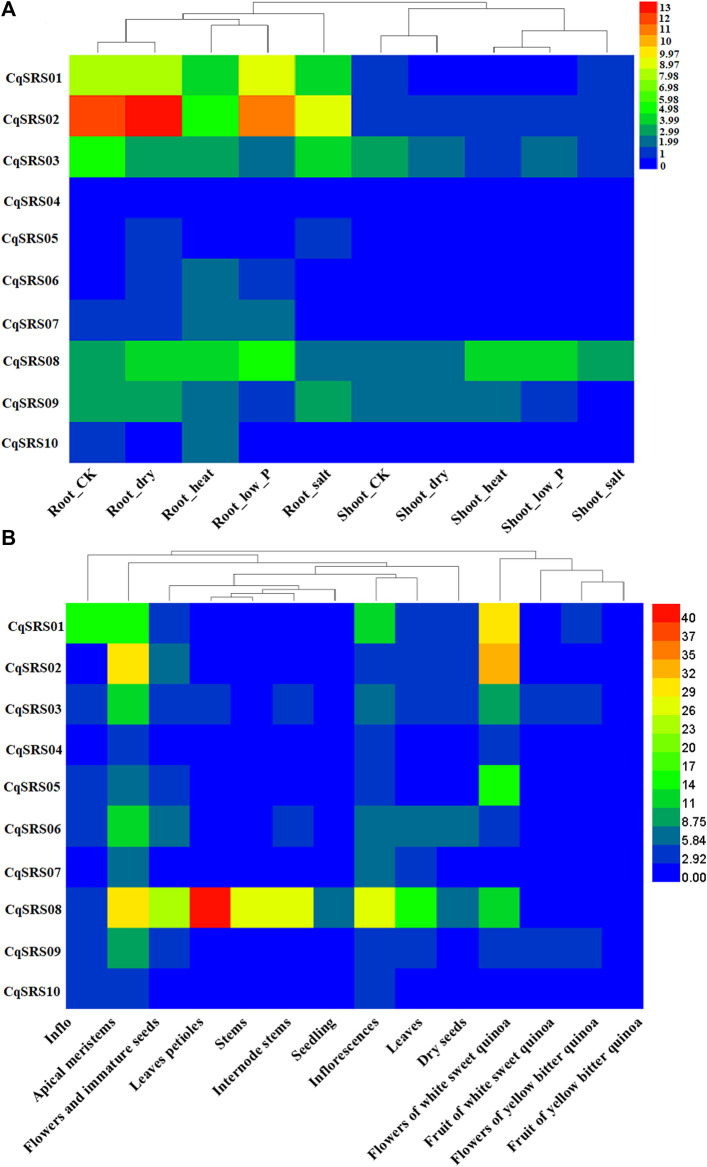
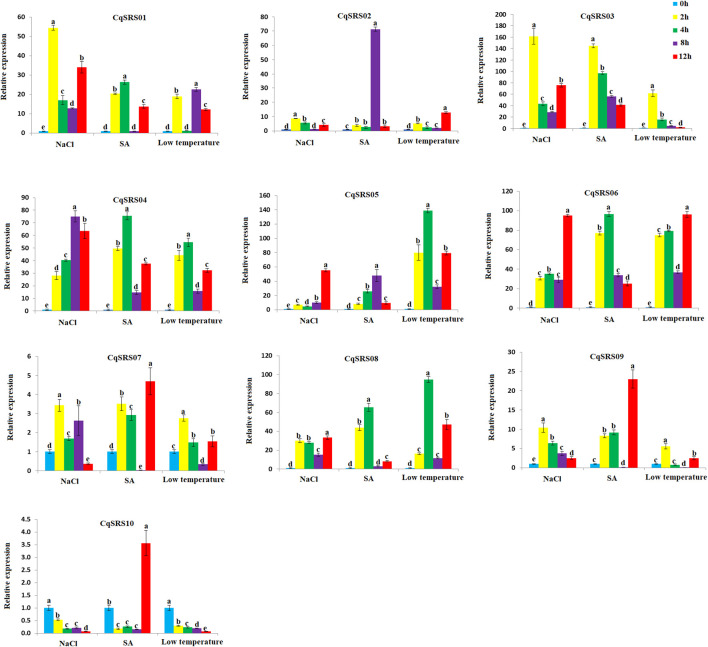
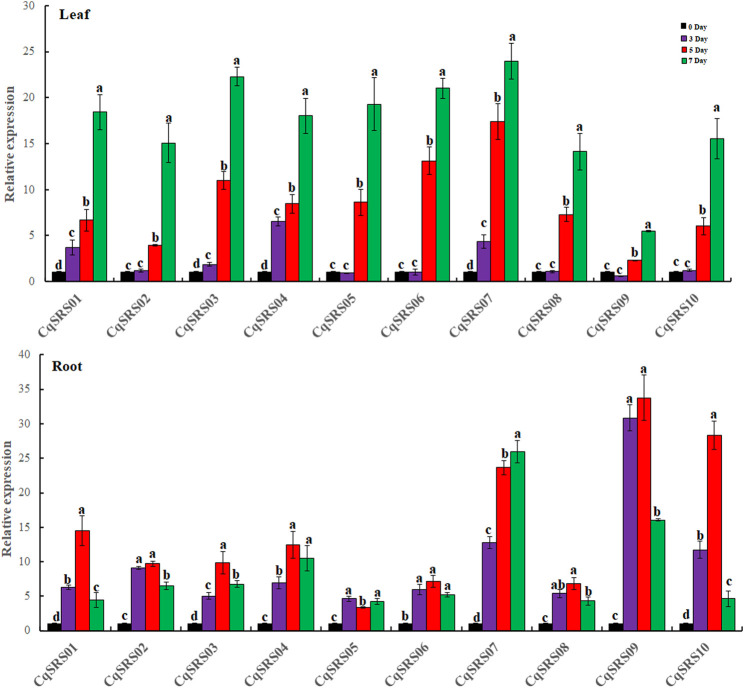
Based on the whole genome data information of Chenopodium quinoa Willd, the CqSRS gene family members were systematically identified and analyzed by bioinformatics methods, and the responses of CqSRS genes to NaCl (100 mmol/L), salicylic acid (200 umol/L) and low temperature (4°C) were detected by qRT-PCR. The results showed that a total of 10 SHI related sequence genes were identified in quinoa, and they were distributed on 9 chromosomes, and there were four pairs of duplicated genes. The number of amino acids encoded ranged from 143 aa to 370 aa, and the isoelectric point ranged from 4.81 to 8.90. The secondary structure was mainly composed of random coil (Cc). Most of the SRS gene encoding proteins were located in the cytoplasm (5 CqSRS). Phylogenetic analysis showed that the CqSRS genes were divided into three groups, and the gene structure showed that the number of exons of CqSRS was between two-five. Promoter analysis revealed that there are a total of 44 elements related to plant hormone response elements, light response elements, stress response elements and tissue-specific expression in the upstream regin of the gene. Protein interaction showed that all 10 CqSRS proteins appeared in the known protein interaction network diagram in Arabidopsis. Expression profile analysis showed that CqSRS genes had different expression patterns, and some genes had tissue-specific expression. qRT-PCR showed that all SRS family genes responded to ABA、NaCl、drought and low-temperature treatments, but the expression levels of different CqSRS genes were significantly different under various stresses. This study lays a foundation for further analyzed the function of CqSRS genes.
Keywords: SRS gene family; evolutionary analysis; expression pattern; genome-wide analysis; quinoa.
Copyright © 2022 Zhu, Wang, Wang and Wei.
Conflict of interest statement
The authors declare that the research was conducted in the absence of any commercial or financial relationships that could be construed as a potential conflict of interest.
Figures
References
-
- Airoldi C. A., Davies B. (2012). Gene duplication and the evolution of plant MADS-box transcription factors. J. Genet. Genomics 39, 157–165. 10.1016/j.jgg.2012.02.008 PubMed Abstract | 10.1016/j.jgg.2012.02.008 | Google Scholar - DOI - PubMed
-
- Bert D. R., Dominique A., Wei X., Paul O., Lucia C. S., Stefan K. (2012). A role for the root cap in root branching revealed by the non-auxin probe naxillin. Nat. Chem. Biol. 8, 798–805. 10.1038/nchembio.1044 PubMed Abstract | 10.1038/nchembio.1044 | Google Scholar - DOI - PMC - PubMed
-
- Boyer J. S. (1982). Plant productivity and environment. Science 218, 443–448. 10.1126/science.218.4571.443 PubMed Abstract | 10.1126/science.218.4571.443 | Google Scholar - DOI - PubMed
-
- Büyük İ., Okay A., Aras S. (2022). Identification and characterization of SRS genes in Phaseolus vulgaris genome and their responses under salt stress. Biochem. Genet. 60 (2), 482–503. 10.1007/s10528-021-10108-0 PubMed Abstract | 10.1007/s10528-021-10108-0 | Google Scholar - DOI - PubMed
-
- Cao S. Q., Guo M. J., Wang C., Xu W. J., Shi T. Y., Tong G. (2019). Genome-wide characterization of aspartic protease (AP) gene family in Populus trichocarpa and identification of the potential PtAPs involved in wood formation. BMC Plant Biol. 19, 276. 10.1186/s12870-019-1865-0 PubMed Abstract | 10.1186/s12870-019-1865-0 | Google Scholar - DOI - PMC - PubMed
LinkOut - more resources
Full Text Sources