Epithelial-Mesenchymal Transition Gene Signature Is Associated with Neoadjuvant Chemoradiotherapy Resistance and Prognosis of Esophageal Squamous Cell Carcinoma
- PMID: 36072903
- PMCID: PMC9442501
- DOI: 10.1155/2022/3534433
Epithelial-Mesenchymal Transition Gene Signature Is Associated with Neoadjuvant Chemoradiotherapy Resistance and Prognosis of Esophageal Squamous Cell Carcinoma
Abstract
Background: Neoadjuvant chemoradiotherapy (neo-CRT) in combination with surgery increases survival compared to surgery alone, as indicated by the esophageal squamous cell carcinoma (ESCC) treatment recommendations. However, the benefits of neo-CRT are diverse among patients. Consequently, the development of new biomarkers that correlate with neo-CRT might be important for the treatment of ESCC.
Methods: The differentially expressed genes (DEG) between responsive and resistant samples from the GSE45670 dataset were obtained. On the TCGA dataset, survival analysis was performed to identify prognosis-related-EMT-genes. For EMT score model construction, lasso regression analysis in the TCGA cohort was used to identify the genes. In the TCGA-ESCC cohort, age, stage, and EMT score were used to construct a nomogram.
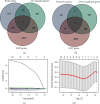
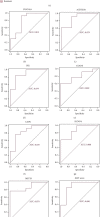
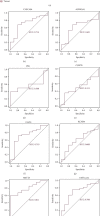
Results: In total, 10 prognosis-related-EMT-genes were obtained. These 10 genes consisted of 6 risky genes and 4 protective genes. Based on the lasso analysis and univariate Cox regression, an EMT score model consisting of 7 genes (CLEC18A, PIR, KCNN4, MST1R, CAPG, ALDH5A1, and COX7B) was identified. ESCC patients with a high EMT score have a worse prognosis. These genes were differentially expressed between responsive and resistant patients and had a high accuracy for distinguishing resistant and responsive patients.
Conclusions: The identified genes have the potential to function as molecular biomarkers for predicting ESCC patients' resistance to neo-CRT. This research may aid in the elucidation of the molecular processes driving resistance and the identification of targets for improving the prognosis for ESCC.
Copyright © 2022 Kewei Song et al.
Conflict of interest statement
The authors declare that they have no conflicts of interest.
Figures


Similar articles
-
Gene expression analysis of pretreatment biopsies predicts the pathological response of esophageal squamous cell carcinomas to neo-chemoradiotherapy.Ann Oncol. 2014 Sep;25(9):1769-1774. doi: 10.1093/annonc/mdu201. Epub 2014 Jun 6. Ann Oncol. 2014. PMID: 24907633 Clinical Trial.
-
A tumor immune microenvironment-related integrated signature can predict the pathological response and prognosis of esophageal squamous cell carcinoma following neoadjuvant chemoradiotherapy: A multicenter study in China.Int J Surg. 2022 Nov;107:106960. doi: 10.1016/j.ijsu.2022.106960. Epub 2022 Oct 17. Int J Surg. 2022. PMID: 36257585
-
Identification of Epithelial-Mesenchymal Transition- (EMT-) Related LncRNA for Prognostic Prediction and Risk Stratification in Esophageal Squamous Cell Carcinoma.Dis Markers. 2021 Oct 19;2021:5340240. doi: 10.1155/2021/5340240. eCollection 2021. Dis Markers. 2021. PMID: 34712369 Free PMC article.
-
RACK1 predicts poor prognosis and regulates progression of esophageal squamous cell carcinoma through its epithelial-mesenchymal transition.Cancer Biol Ther. 2015;16(4):528-40. doi: 10.1080/15384047.2015.1016687. Epub 2015 Feb 26. Cancer Biol Ther. 2015. PMID: 25719728 Free PMC article.
-
A fibroblast-associated signature predicts prognosis and immunotherapy in esophageal squamous cell cancer.Front Immunol. 2023 May 29;14:1199040. doi: 10.3389/fimmu.2023.1199040. eCollection 2023. Front Immunol. 2023. PMID: 37313409 Free PMC article.
Cited by
-
Radiation dose escalation in locally advanced oesophageal cancer: a systematic review and hierarchical Bayesian meta-analysis.EClinicalMedicine. 2025 Aug 13;87:103432. doi: 10.1016/j.eclinm.2025.103432. eCollection 2025 Sep. EClinicalMedicine. 2025. PMID: 40838203 Free PMC article.
-
Systematic gene expression analysis of putative target genes linked to miR-31 in 83 oral squamous cell carcinoma samples.Head Face Med. 2025 Feb 25;21(1):10. doi: 10.1186/s13005-024-00443-z. Head Face Med. 2025. PMID: 39994808 Free PMC article.
References
MeSH terms
Substances
LinkOut - more resources
Full Text Sources
Other Literature Sources
Medical
Research Materials
Miscellaneous

