

A Genomic Instability-Related Long Noncoding RNA Signature for Predicting Hepatocellular Carcinoma Prognosis
- PMID: 36072979
- PMCID: PMC9444385
- DOI: 10.1155/2022/3090523
A Genomic Instability-Related Long Noncoding RNA Signature for Predicting Hepatocellular Carcinoma Prognosis
Abstract
Background: Long noncoding RNAs (lncRNAs) are found to be novel biomarkers for hepatocellular carcinoma (HCC) and play an important role in tumor progression. We established a genomic instability-related long noncoding RNA signature (GIlncSig) as an independent prognosis factor and also investigated its impact on prognosis significance.
Method: Somatic mutation profiles, clinical characteristics, and RNA sequencing data were obtained from The Cancer Genome Atlas (TCGA) database. Lasso regression was used to construct GIlncSig. KEGG was used to identify the possible biological pathways. ESTIMATE and CIBERSORT algorithms were used to calculate the immune microenvironment scores and proportion of immune cells in HCC patients. The expression of LINC00501 was conducted by qRT-PCR. Cell proliferation was measured by EdU, CCK-8, and colony formation assay, and cell migration and invasion ability were measured by wound healing and transwell assay.
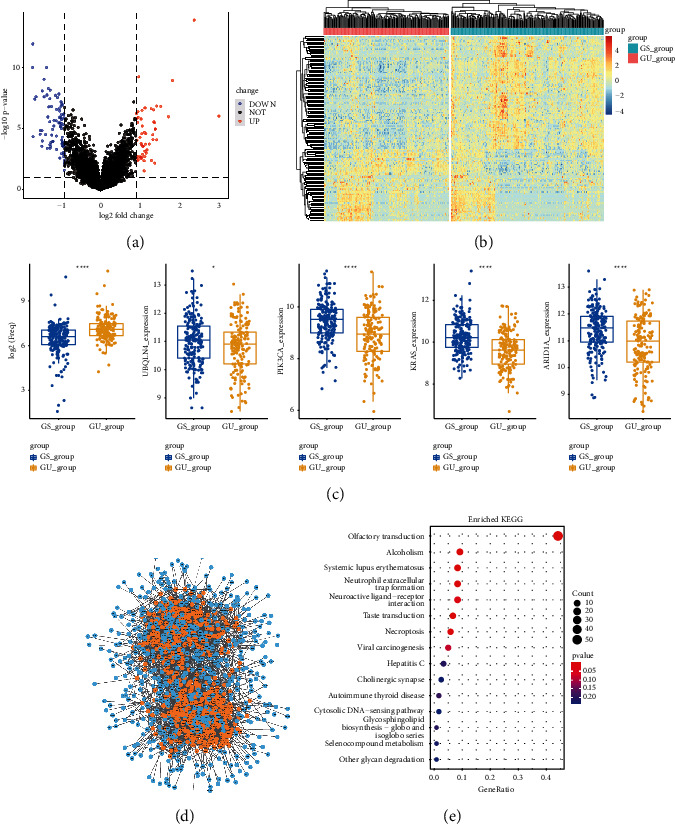
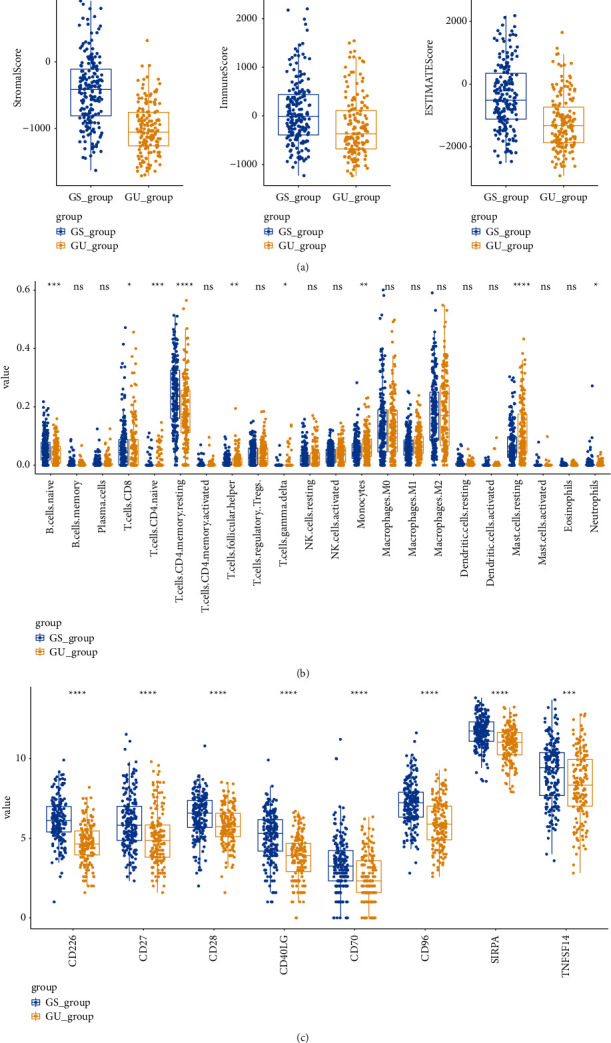
Results: 135 genomic instability-related lncRNAs were identified, and GIlncSig was constructed using 13 independent lncRNAs with significant prognosis values. Based on the GIlncSig, high-risk group had worse clinical outcomes than low-risk group, while high-risk group also had higher UBQLN4, KRAS, ARID1A, and PIK3CA expression. Moreover, the efficiency of GIlncSig combining single-gene mutation was higher than single-gene mutation alone such as TP53. The results of CIBERSORT and ESTIMATE showed that GS group and GU group had significantly different immune infiltration. In addition, LINC00501 was identified as a potential biomarker in HCC with strong relationship with clinical characteristics. In vitro assays validated that LINC00501 promoted proliferation and migration of HCC cell lines.
Conclusion: Our results showed that GIlncSig serves as a potential independent prognosis factor to predict HCC patients' prognosis for exploring potential mechanism and therapy strategy. Besides, LINC00501 plays an important role in the progression of HCC, which may be a potential therapy target.
Copyright © 2022 Jing Lu et al.
Conflict of interest statement
The authors declare that they have no conflicts of interest.
Figures


Similar articles
-
Construction of a Novel LncRNA Signature Related to Genomic Instability to Predict the Prognosis and Immune Activity of Patients With Hepatocellular Carcinoma.Front Immunol. 2022 Apr 8;13:856186. doi: 10.3389/fimmu.2022.856186. eCollection 2022. Front Immunol. 2022. PMID: 35479067 Free PMC article.
-
A Mutation-Related Long Noncoding RNA Signature of Genome Instability Predicts Immune Infiltration and Hepatocellular Carcinoma Prognosis.Front Genet. 2021 Nov 22;12:779554. doi: 10.3389/fgene.2021.779554. eCollection 2021. Front Genet. 2021. PMID: 34880908 Free PMC article.
-
Genomic Instability Promotes the Progression of Clear Cell Renal Cell Carcinoma Through Influencing the Immune Microenvironment.Front Genet. 2021 Oct 12;12:706661. doi: 10.3389/fgene.2021.706661. eCollection 2021. Front Genet. 2021. PMID: 34712264 Free PMC article.
-
Construction of a genome instability-derived lncRNA-based risk scoring system for the prognosis of hepatocellular carcinoma.Aging (Albany NY). 2021 Nov 18;13(22):24621-24639. doi: 10.18632/aging.203698. Epub 2021 Nov 18. Aging (Albany NY). 2021. PMID: 34799469 Free PMC article.
-
Construction and validation of somatic mutation-derived long non-coding RNAs signatures of genomic instability to predict prognosis of hepatocellular carcinoma.World J Gastrointest Surg. 2024 Mar 27;16(3):842-859. doi: 10.4240/wjgs.v16.i3.842. World J Gastrointest Surg. 2024. PMID: 38577085 Free PMC article.
Cited by
-
A novel PANoptosis-related long non-coding RNA index to predict prognosis, immune microenvironment and personalised treatment in hepatocellular carcinoma.Aging (Albany NY). 2024 Jan 26;16(3):2410-2437. doi: 10.18632/aging.205488. Epub 2024 Jan 26. Aging (Albany NY). 2024. PMID: 38284890 Free PMC article.
References
LinkOut - more resources
Full Text Sources
Research Materials
Miscellaneous
