. 2022 Sep 8;7(17):e161820.
doi: 10.1172/jci.insight.161820.

Targeting BCL-XL in fibrolamellar hepatocellular carcinoma

Affiliations

Targeting BCL-XL in fibrolamellar hepatocellular carcinoma

Bassem Shebl et al. JCI Insight. .

Abstract

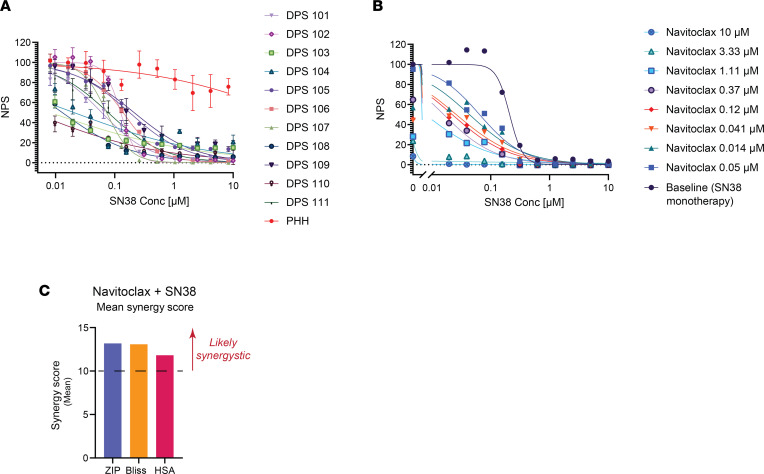
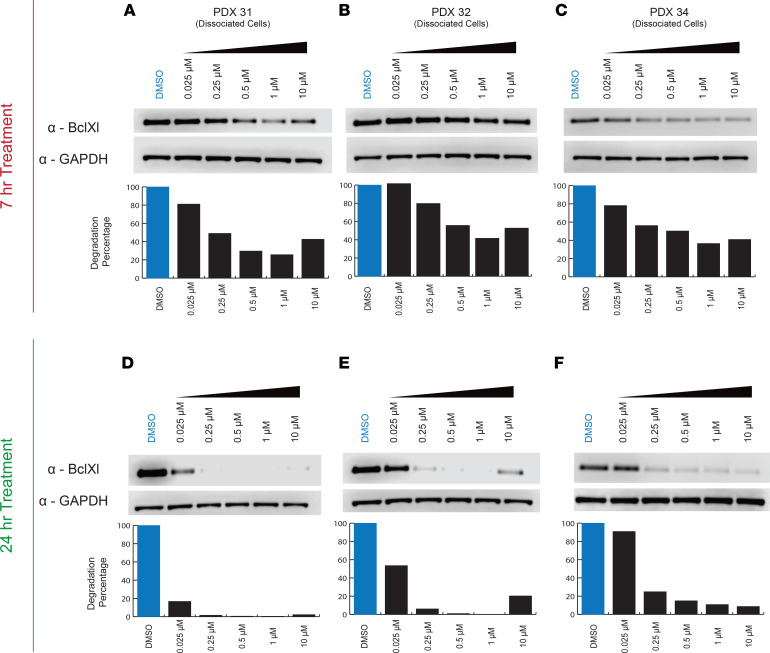
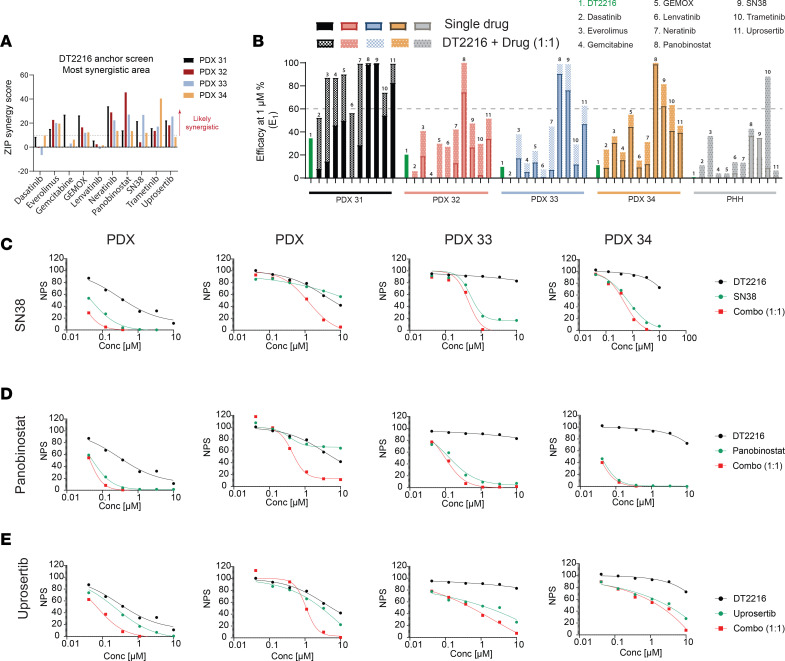
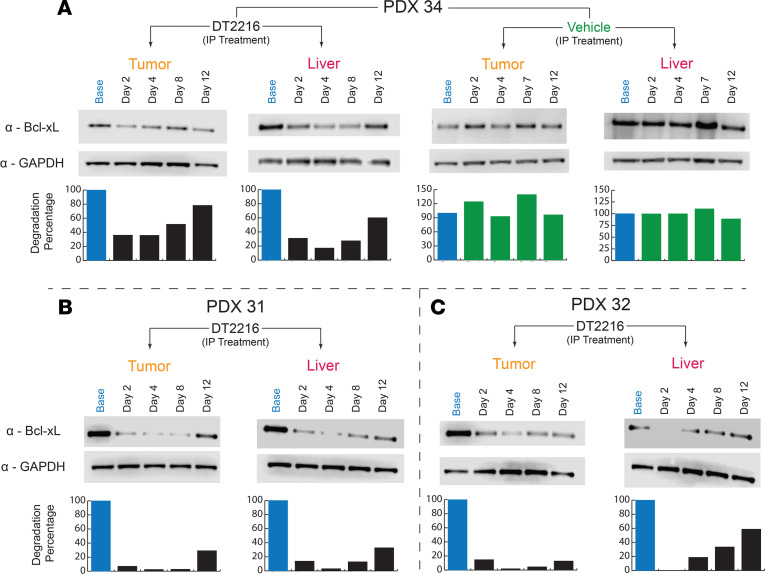
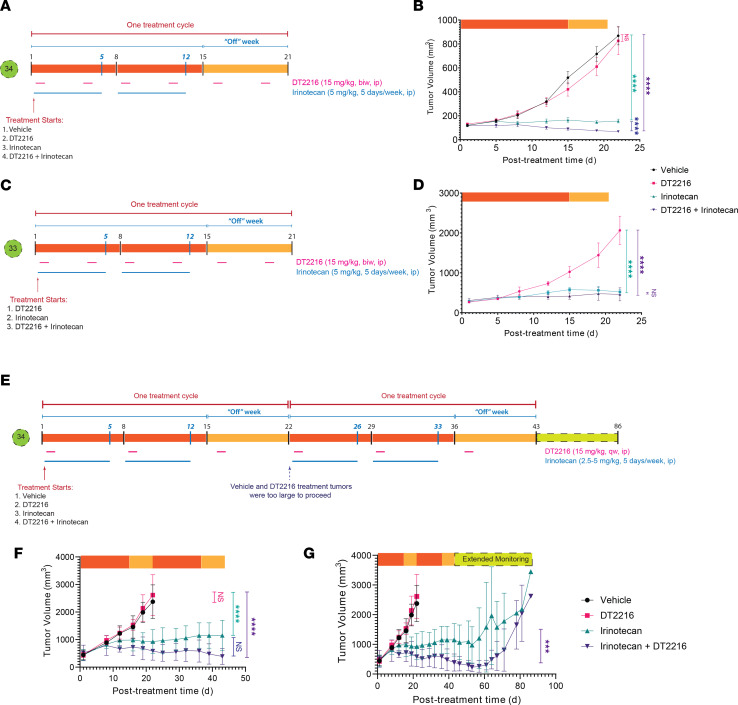
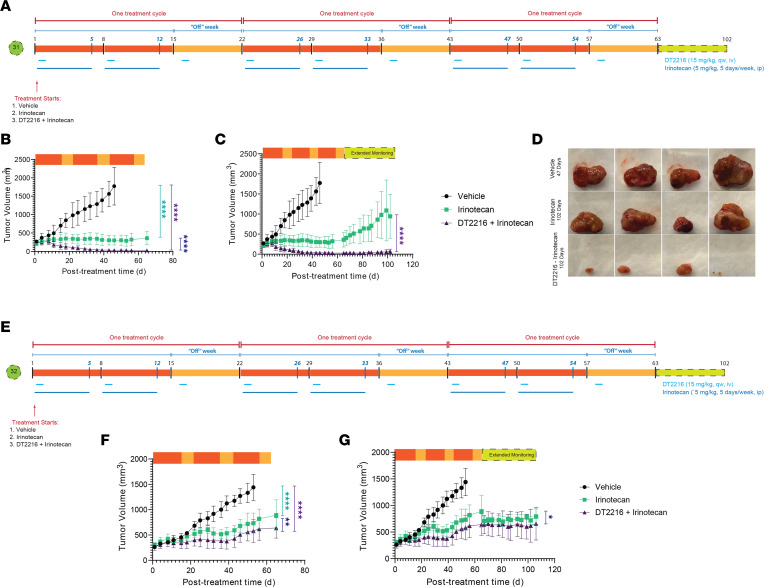
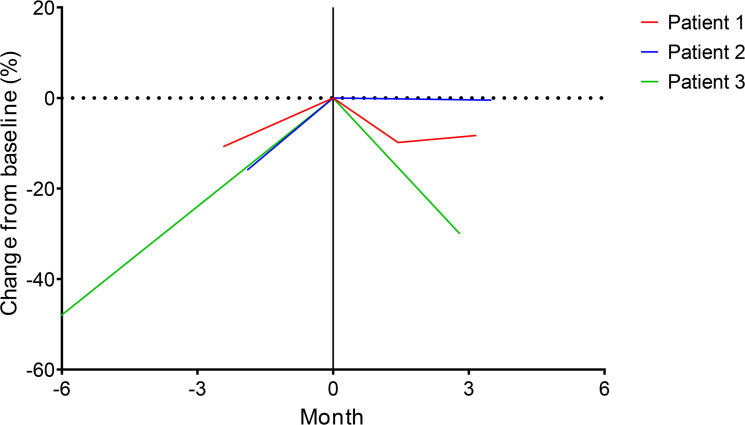
Fibrolamellar hepatocellular carcinoma (FLC) is a rare and often lethal liver cancer with no proven effective systemic therapy. Inhibition of the antiapoptotic protein BCL-XL was found to synergize with a variety of systemic therapies in vitro using cells dissociated from patient-derived xenografts (PDX) of FLC or cells dissociated directly from surgical patient resections. As BCL-XL is physiologically expressed in platelets, prior efforts to leverage this vulnerability in other cancers have been hampered by severe thrombocytopenia. To overcome this toxicity, we treated FLC models with DT2216, a proteolysis targeting chimera (PROTAC) that directs BCL-XL for degradation via the von Hippel-Lindau (VHL) E3 ligase, which is minimally expressed in platelets. The combination of irinotecan and DT2216 in vitro on cells directly acquired from patients or in vivo using several xenografts derived from patients with FLC demonstrated remarkable synergy and at clinically achievable doses not associated with significant thrombocytopenia.

Keywords: Apoptosis inhibitors; Drug therapy; Hepatology; Liver cancer; Oncology.


Figures

Figure 1
Figure 1. Direct-from-patient screening (DPS) of SN38.
(A) Dose-response curves of SN38 (TOPO1 inhibitor) against 11 patient samples (samples 101–111) and PHH. Cells were treated at 10 μM–10 nM with 2-fold serial dilution. The y axis shows normalized percentage survival calculated as ([positive control – drug response at a given dose]/[positive control – negative control]) × 100. The x axis shows the concentration in μM. Data are presented as mean ± SD (n = 3). (B) Dose-response curves of SN38 in the presence of increasing concentrations of navitoclax. Synergy screening was done on patient sample DPS 102. (C) Comparison of synergy models for SN38-navitoclax combo from B. NPS, normalized percentage survival.
Figure 2
Figure 2. Immunoblot analysis of BCL-XL in dissociated cells from FLC PDX.
(AF) Cell lysates were blotted after treatment with indicated concentrations of DT2216 for 7 hours (AC) or 24 hours (DF). GAPDH was used as a loading control for all immunoblot analysis presented. Data were corrected with a normalization factor against GAPDH and are presented as a percentage of the DMSO treated cells (control). The upper panel shows the immunoblots, and the lower panel shows the densiometric analysis performed using LI-COR.
Figure 3
Figure 3. DT2216 Anchor Screen.
(A) The most synergistic area scores (synergy score for the most synergistic 2 × 2 dose region) out of the matrix for each drug combination, (B) The efficacy of selected drugs as single agents or in combination with DT2216 at a ratio of 1:1 at 1 μM. Dose-response curves of selected DT2216 combinations. (CE) Dose-response curves of selected drugs tested against 4 FLC PDX lines and a PHH control. Drugs are plotted either as single agents or in combination with DT2216 in a ratio of 1:1. Drugs were tested at 10 μM–41 nM with 3-fold serial dilution. The y axis shows normalized percentage survival calculated as ([positive control – drug response at a given dose]/[positive control – negative control]) × 100. The x axis shows the concentration in μM. Topoisomerase I inhibitors (SN38) (C), HDAC inhibitors (panobinostat) (D), and Kinase inhibitors (uprosertib) (E). NPS, normalized percentage survival.
Figure 4
Figure 4. DT2216 induces degradation in vivo in FLC PDX.
PDX mice were treated with a single dose of the i.p. formulation, and tumor tissue was collected from the tumor and liver of each mouse. Each time point represents an independent mouse. BCL-XL level was monitored using Western blotting. GAPDH was used as a loading control for all immunoblot analysis presented. Data were corrected with a normalization factor against GAPDH and are presented as a percentage of the vehicle-treated (Base) cells as a control. The upper panel shows the immunoblots, and the lower panel shows the densiometric analysis performed using LI-COR. (A) PDX 34 treated with the i.p. formulation in tumor and liver samples, along with the vehicle control. (B) PDX 31 treated with the i.p. formulation in tumor and liver samples. (C) PDX 32 treated with the i.p. formulation in tumor and liver samples.
Figure 5
Figure 5. DTT216 administered i.p. twice a week combined with irinotecan.
(A and C) Illustration of treatment timeline for PDX 34 and PDX 33. DT2216 was administered i.p. twice a week for the entire treatment cycle; irinotecan was administered for 5 days a week for 2 weeks. The third week, the mice were off the treatment with irinotecan. (B and D) Changes in tumor volume over the course of treatment. Data are presented as the mean ± SEM (n = 7 for vehicle and irinotecan treatment groups, n = 6 for DT2216, n = 9 for other treatment groups at the start of the treatment for PDX 34, n = 3 for DT2216 and irinotecan, and n = 4 for the combo treatment at the start of treatment for PDX 33). ****P < 0.0001 in indicated comparisons. DT2216 with 2 cycles of treatment. (E) Illustration of treatment timeline for PDX 34. DT2216 was administered i.p. twice a week for the entire treatment cycle. A low dose of irinotecan (2.5 mg/kg) was administered i.p. for 5 days a week for the first treatment cycle, followed by an intermediate dose of irinotecan (5 mg/kg) administered for the second treatment cycle. The third week of each treatment cycle, the mice were off irinotecan. (F) Changes in tumor volume over the course of the treatment cycle. Data are presented as the mean ± SEM (n = 4 for all treatment groups at the start of the treatment for PDX 34). (G) Changes in tumor volume over the entire timeline (treatment cycle + extended monitoring beyond treatment). ***P < 0.001 in indicated comparisons, as determined by Linear mixed-effects regression model.
Figure 6
Figure 6. The i.v. formulation of DT2216 synergizes with irinotecan, leading to a sustained complete remission in FLC PDX.
(A) Illustration of treatment timeline for PDX 31. DT2216 was administered i.v. once a week for the entire treatment cycle; an intermediate dose of irinotecan (5 mg/kg) was administered for 2 treatment cycles, 5 days a week. The third week of each treatment cycle, the mice were off irinotecan. (B) Changes in tumor volume over the course of the treatment cycle. Data are presented as the mean ± SEM (n = 4 for vehicle group and n = 5 for the rest of the treatment groups at the start of the treatment for PDX 31). (C) Changes in tumor volume over the entire timeline (treatment cycle + extended monitoring beyond treatment). (D) Tumor images of FLC PDX–engrafted mice after the end of treatment and monitoring at day 47 for vehicle and day 102 for the irinotecan and irinotecan + DT2216 cohorts. ****P < 0.0001 in indicated comparisons. Resistant FLC models exhibit durable clinical benefit to DT2216 and irinotecan. (E) Illustration of treatment timeline for PDX 32. DT2216 was administered i.v. once a week for the entire treatment cycle; an intermediate dose of irinotecan (5 mg/kg) was administered for 2 treatment cycles, 5 days a week. The third week of each treatment cycle, the mice were off irinotecan. (F) Changes in tumor volume over the course of the treatment cycle. Data are presented as the mean ± SEM (n = 5 for vehicle group, n = 6 for the irinotecan treatment group, and n = 7 for the combo treatment group at the start of the treatment for PDX 32). (G) Changes in tumor volume over the entire timeline (treatment cycle + extended monitoring beyond treatment). *P < 0. 05, **P < 0.01, and ****P < 0.0001, as determined by Linear mixed-effects regression model.
Figure 7
Figure 7. Irinotecan clinical activity in patients with advanced FLC.
Change in tumor target lesions by RECIST 1.1 is shown before and after commencement of irinotecan-based systemic therapy for 3 patients identified through the Fibrolamellar Registry. All 3 patients had tumor progression prior to starting irinotecan in month 0. Patient 1 received irinotecan monotherapy, whereas patients 2 and 3 received irinotecan in combination with other systemic therapies. By RECIST 1.1, patients 1 and 2 achieved stable disease as a best response to therapy, and patient 3 had an unconfirmed partial response.

References

    1. Lalazar G, Simon SM. Fibrolamellar carcinoma: recent advances and unresolved questions on the molecular mechanisms. Semin Liver Dis. 2018;38(1):51–59. doi: 10.1055/s-0037-1621710. - DOI - PMC - PubMed
    1. O’Neill AF, et al. Fibrolamellar carcinoma: an entity all its own. Curr Probl Cancer. 2021;45(4):100770. doi: 10.1016/j.currproblcancer.2021.100770. - DOI - PubMed
    1. Graham RP, et al. DNAJB1-PRKACA is specific for fibrolamellar carcinoma. Mod Pathol. 2015;28(6):822–829. doi: 10.1038/modpathol.2015.4. - DOI - PubMed
    1. Darcy DG, et al. The genomic landscape of fibrolamellar hepatocellular carcinoma: whole genome sequencing of ten patients. Oncotarget. 2015;6(2):755–770. doi: 10.18632/oncotarget.2712. - DOI - PMC - PubMed
    1. Honeyman JN, et al. Detection of a recurrent DNAJB1-PRKACA chimeric transcript in fibrolamellar hepatocellular carcinoma. Science. 2014;343(6174):1010–1014. doi: 10.1126/science.1249484. - DOI - PMC - PubMed

Publication types

Supplementary concepts