. 2022 Nov;9(31):e2202633.
doi: 10.1002/advs.202202633. Epub 2022 Sep 8.

Transcript Engineered Extracellular Vesicles Alleviate Alloreactive Dynamics in Renal Transplantation

Affiliations

Transcript Engineered Extracellular Vesicles Alleviate Alloreactive Dynamics in Renal Transplantation

Jinwen Lin et al. Adv Sci (Weinh). 2022 Nov.

Abstract

Direct contact of membrane molecules and cytokine interactions orchestrate immune homeostasis. However, overcoming the threshold of distance and velocity barriers, and achieving adhesion mediated immune interaction remain difficult. Here, inspired by the natural chemotaxis of regulatory T cells, multifunctionalized FOXP3 genetic engineered extracellular vesicles, termed Foe-TEVs, are designed, which display with adhesive molecules, regulatory cytokines, and coinhibitory contact molecules involving CTLA-4 and PD-1, by limited exogenous gene transduction. Foe-TEVs effectively adhere to the tubular, endothelial, and glomerular regions of allogeneic injury in the renal allograft, mitigating cell death in situ and chronic fibrosis transition. Remarkably, transcript engineering reverses the tracking velocity of vesicles to a retained phenotype and enhanced arrest coefficient by a factor of 2.16, directly interacting and attenuating excessive allosensitization kinetics in adaptive lymphoid organs. In murine allogeneic transplantation, immune adhesive Foe-TEVs alleviate pathological responses, restore renal function with well ordered ultrastructure and improved glomerular filtration rate, and prolong the survival period of the recipient from 30.16 to 92.81 days, demonstrating that the delivery of extracellular vesicles, genetically engineered for immune adhesive, is a promising strategy for the treatment of graft rejection.

Keywords: allograft rejection; genetic engineering; immune adhesion; renal transplantation.


Conflict of interest statement

The authors declare no conflict of interest.

Figures

Scheme 1
Scheme 1
Schematic illustration of the immune adhesive FOXP3 genetic engineering extracellular vesicles alleviates renal allograft rejection via contact dependent and secretory cytokines pathways.
Figure 1
Figure 1
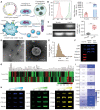
Establishment and characterization of Foe‐TEVs. A) The schematic illustration of Foe‐TEVs establishment. B) Mean fluorescence intensity and relative count of the reporter in Th cells and Foe‐Th. C) The mRNA level of FOXP3 relative with GAPDH analyzed by northern blot in Th cells and Foe‐Th. D) Transmission electron microscopy imaging of Foe‐TEVs. E) Nanoparticle tracking analysis of Foe‐TEVs. F) Western blot analysis of CD9, CD63, TSG101, Calnexin, Histone 3, and GM130 expression in Foe‐Th cells, Vector‐TEVs, and Foe‐TEVs. G) Proteomic characterization of cytokines in Vector‐TEVs and Foe‐TEVs. H) Western blotting analysis of the expression of IL‐10, TGF‐β1, CTLA‐4, PDCD1, CD35, CD73, LAG3, TIGIT, and subunits of integrins including ITGA4, ITGAL, ITGB1, and ITGB2 on Foe‐TEVs with different concentrations. I) Analysis of various protein contents in Vector‐TEVs and Foe‐TEVs at 1 × 10⁹ particles. ***P < 0.001; Values are presented as mean ± SEM, n = 6. Statistical analysis was determined by two‐tailed Student's t‐test.
Figure 2
Figure 2
Biocompatibility evaluation of Foe‐TEVs in vitro. A) Live/dead fluorescence results of Vector‐TEVs and Foe‐TEVs cocultured with HUVECs at day 1, 5, and 7, respectively. B) Cell viability of control, Vector‐TEVs, and Foe‐TEVs cocultured with HUVECs at day 1, 5, and 7, respectively. C) CCK‐8 quantification results in control, Vector‐TEVs, and Foe‐TEVs cocultured with HUVECs at day 1, 5, and 7, respectively. D) Live/dead fluorescence results of Vector‐TEVs and Foe‐TEVs cocultured with KFBs at day 1, 5, and 7, respectively. E) Cell viability of control, Vector‐TEVs, and Foe‐TEVs cocultured with KFBs at day 1, 5, and 7, respectively. F) CCK‐8 quantification results in control, Vector‐TEVs, and Foe‐TEVs cocultured with KFBs at day 1, 5, and 7, respectively. HUVECs, human umbilical vein endothelial cells; KFBs, kidney fibroblasts. n.s., not significant; *P < 0.05, ***P < 0.001; Values are presented as mean ± SEM, n = 6. Statistical analysis was performed by the one‐way analysis of variance.
Figure 3
Figure 3
Foe‐TEVs targeted into the allograft, ADLNs, and spleen mediated by immune adhesion. A) Confocal imaging and statistical data of DiD‐labeled Foe‐TEVs adhere to ICAM‐1 on HK‐2 cells in control group, stimulated group, and VCAM‐1 monoclonal antibody blocking group (n = 25). *P < 0.05, ***P < 0.001. B) Radiance changes and distribution of DiD alone, Vector‐TEVs, and Foe‐TEVs in indicated organs at 6, 12, 24, 48, 96, and 192 h after injection. C) Quantitative radiant efficiency in spleen, ADLNs, and renal allograft at different time series (n = 3). # P < 0.05, ## P < 0.01, and ### P < 0.001 compared to the DiD group; ††† P < 0.001 compared to the Vector‐TEVs group; n.s., no significance. D) The distribution of Foe‐TEVs in both isograft and allograft groups detected by immunofluorescence (n = 20). E) Quantification by flow cytometry of Foe‐TEVs+ CD54+ cells in different groups (n = 6). F) Quantification by flow cytometry of Foe‐TEVs+ CD106+ cells in isograft and allograft groups, respectively (n = 6). ***P < 0.001; Values are showed as mean ± SEM. Statistical analysis was determined by two‐tailed Student's t‐test.
Figure 4
Figure 4
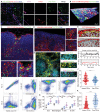
The immune adhesion of Foe‐TEVs via enhanced subcapsular capturing and effector interacting. A) The distribution of Foe‐TEVs in lymphatic vessels and blood vessels presented by immunofluorescence staining in allograft. B) Confocal imaging of Foe‐TEVs distribution in subcapsular sinus of draining lymph node. C) The distribution of Foe‐TEVs under the capsule and in the corticomedullary junction shown by multiple immunofluorescence staining. D) The interaction between Foe‐TEVs and medullary macrophage in the medulla shown by multiple immunofluorescence staining. E) The interaction of Foe‐TEVs with T cells (CD3+), marginal zone B cells (CD19+), and follicular B cells (CD21+) in germinal centers. F) Flow cytometry analysis of adhesion of Foe‐TEVs to CD11b+CD11c+DCs, F4‐80+macrophages, CD45+CD3+T cells, and CD45+CD19+B cells. G) Quantification of leukocyte percentage with Dil+ TEVs 1 and 6 h after intravenous injection of Vector‐TEVs or Foe‐TEVs (n = 6). *P < 0.05, **P < 0.01, and ***P < 0.001 compared to the Vector‐TEVs 6 h group; ### P < 0.001 compared to the Foe‐TEVs 1 h group. H) Confocal images showing tracks of Foe‐TEVs and Vector‐TEVs contacting with SCS macrophages under subcapsular sinus of lymph nodes. I) The instant velocity of individual Vector‐TEVs and Foe‐TEVs. J) The mean velocity of Vector‐TEVs and Foe‐TEVs under subcapsular sinus of lymph nodes (n = 300). K) The arrest coefficient of Vector‐TEVs and Foe‐TEVs (n = 300). ***P < 0.001. Values are presented as mean ± SEM. Statistical analysis was determined by two‐tailed Student's t‐test.
Figure 5
Figure 5
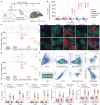
Foe‐TEVs attenuated excessive allosensitization kinetics in secondary lymphoid organ. A) Schematic diagram revealing the administration of EVs in sham, isograft, Vector‐TEVs, Foe‐TEVs, and FK506 groups. B) MFI detection of total DSA levels in serum at day 0, day 7, day 21, day 42, and day 56 post‐transplant, respectively (n = 6). C) Kinetics of allospecific T cell responses 7 days post‐transplant (n = 6). D) Kinetics of allospecific T cell responses 21 days post‐transplant (n = 6). E) immunofluorescence staining of GL7+ GCs located within the follicle (B220+) in spleen at 7 days and 21 days post‐transplant, respectively. F) Gating strategy for isolating GL7+ FAS+ GCB cells, CD138+ SPPCs, and CD4+ Th cells. G) The quantitative statistics of GL7+ germinal centers in E) at day 7 and day 21 post‐transplant (n = 8). H–J) The quantitative statistics of GL7+ FAS+ GCB cells (H), CD138+ SPPCs (I), and CD4+ Th cells (J) at day 7 and day 21 post‐transplant respectively (n = 8). DSA, donor specific antibody; GC, germinal center; SPPC, splenic plasma cell; n.s., not significant, ***P < 0.001, ###P < 0.001 compared with the Foe‐TEVs group. Values are presented as mean ± SEM. Statistical analysis was determined by two‐tailed Student's t‐test.
Figure 6
Figure 6
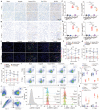
Foe‐TEVs improved inflammatory infiltration and biased polarization in renal allograft. A) Immunohistochemistry of IFN‐γ in sham, isograft, Vector‐TEVs, Foe‐TEVs, and FK506 groups at 7 days and 21 days post‐transplant. B) Immunohistochemistry of C4d in sham, isograft, Vector‐TEVs, Foe‐TEVs, and FK506 groups at 7 days and 21 days post‐transplant. C) Quantification of IFN‐γ positive ratio in (A) (n = 8). D) Quantification of C4d positive ratio in (B) (n = 8). E) Representative immunofluorescence staining of F4/80+ macrophages, CD3+ T cells as well as CD11c+ DCs in the kidney at 7 days and 21 days post‐transplant. F–H) Quantification of the infiltration of T cells, DCs, and macrophages in the kidney (n = 6). *P < 0.05, **P < 0.01, ***P < 0.001, ### P < 0.001, compared with the Foe‐TEVs. I) Representative plots and quantitative analysis of FOXP3+ T cells in the kidney of different groups with flow cytometry at 7 days and 21 days post‐transplant (n = 8). J) Flow histogram showing the number of p‐STAT‐1+ macrophages in graft tissues at 7 days and 21 days post‐transplant. K) Quantitative assay of p‐STAT‐1+ polarized macrophages in renal allograft (n = 8). n.s., not significant compared to the Foe‐TEVs group; ***P < 0.001 compared to the Vector‐TEVs group; ### P < 0.001 compared to the FK506 group. Values are presented as mean ± SEM. Statistical analysis was performed by two‐tailed Student's t‐test.
Figure 7
Figure 7
Foe‐TEVs improved the renal fibrosis, graft function, and survival period of recipients. A) Representative images of H&E and PAS staining of glomerulus as well as renal tubules in sham, isograft, Vector‐TEVs, Foe‐TEVs, and FK506 groups after the 4th and the 8th week post operation. B) The estimation of GFR in each group 4th (left) and the 8th week (right) after transplantation (n = 8). C) Analysis of urinary protein/creatinine ratio in each group the 4th (left) and the 8th (right) week post operation (n = 8). D) Immunofluorescence of AQP‐1, Podocalyxin, and TUNEL showing the morphology and distribution of renal tubules and glomerulus in each group after the 8th week postoperative. E) Quantitative fluorescence intensity of AQP‐1+ tubules and PODO+ glomerulus (n = 8). F) Quantification of the apoptotic cells of glomerulus and renal tubules respectively (n = 8). G) TEM images of the ultrastructure of allograft tissue after the 8th week postoperative. H) Masson staining and representative immunohistochemical evaluation of α‐SMA and collagen I after 8th week postoperative. I) Fibrotic index of renal interstitial fibrosis 8 weeks postoperation (n = 8). J–K) The analysis of α‐SMA and type I Collagen positive area ratio in each group after 8th week postoperative (n = 8). L) Survival percentage of allograft recipients with different treatments (n = 6). n.s., not significant compared to the Foe‐TEVs group; ***P < 0.001 compared to the Vector‐TEVs group; ###P < 0.001 compared to the FK506 group. Values are presented as mean ± SEM. Statistical analysis was determined by two‐tailed Student's t‐test.

Similar articles

Cited by

References

    1. a) Gray‐Owen S. D., Blumberg R. S., Nat. Rev. Immunol. 2006, 6, 433; - PubMed
    2. b) Lin J. X., Leonard W. J., Annu. Rev. Immunol. 2019, 37, 295. - PMC - PubMed
    1. a) Doberer K., Duerr M., Halloran P. F., Eskandary F., Budde K., Regele H., Reeve J., Borski A., Kozakowski N., Reindl‐Schwaighofer R., Waiser J., Lachmann N., Schranz S., Firbas C., Muhlbacher J., Gelbenegger G., Perkmann T., Wahrmann M., Kainz A., Ristl R., Halleck F., Bond G., Chong E., Jilma B., Bohmig G. A., J. Am. Soc. Nephrol. 2021, 32, 708; - PMC - PubMed
    2. b) Lu X., Ru Y., Chu C., Lv Y., Gao Y., Jia Z., Huang Y., Zhang Y., Zhao S., Theranostics 2020, 10, 8446. - PMC - PubMed
    1. a) Louveau A., Smirnov I., Keyes T. J., Eccles J. D., Rouhani S. J., Peske J. D., Derecki N. C., Castle D., Mandell J. W., Lee K. S., Harris T. H., Kipnis J., Nature 2015, 523, 337; - PMC - PubMed
    2. b) Swartz M. A., Lund A. W., Nat. Rev. Cancer 2012, 12, 210. - PubMed
    1. Belardi B., Son S., Felce J. H., Dustin M. L., Fletcher D. A., Nat. Rev. Mol. Cell Biol. 2020, 21, 750. - PubMed
    1. Dustin M. L., Cancer Immunol. Res. 2014, 2, 1023. - PMC - PubMed

Publication types

LinkOut - more resources