

Double-multilayer monochromators for high-energy and large-field X-ray imaging applications with intense pink beams at SPring-8 BL20B2
- PMID: 36073886
- PMCID: PMC9455199
- DOI: 10.1107/S1600577522006610
Double-multilayer monochromators for high-energy and large-field X-ray imaging applications with intense pink beams at SPring-8 BL20B2
Abstract
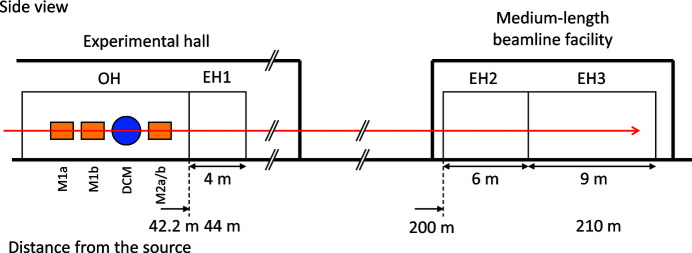
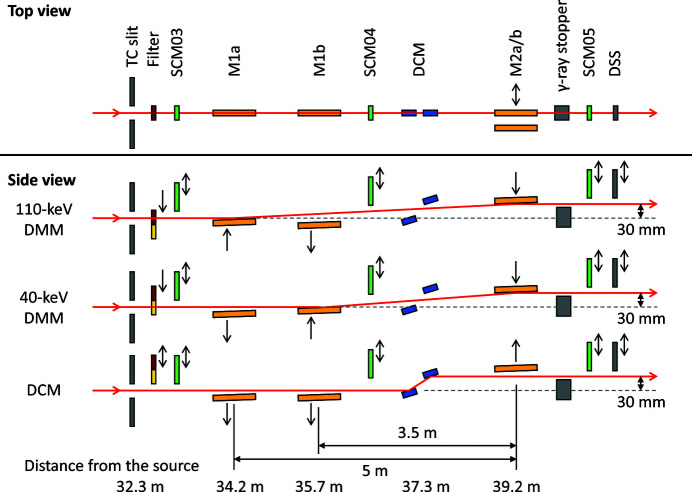
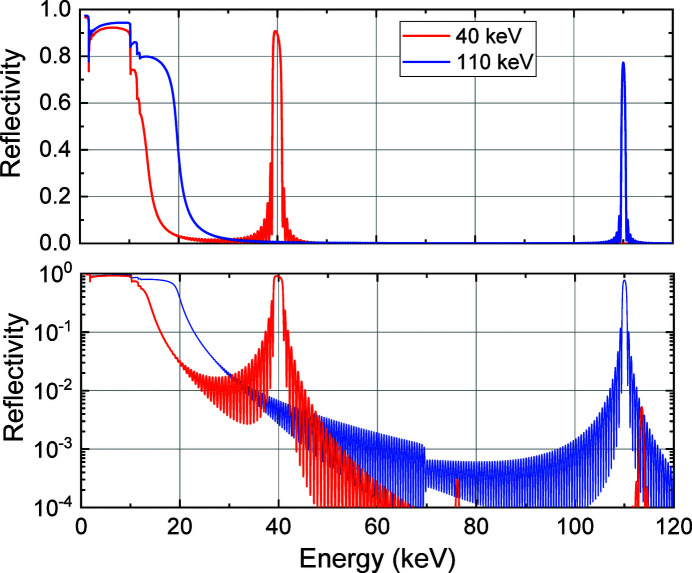
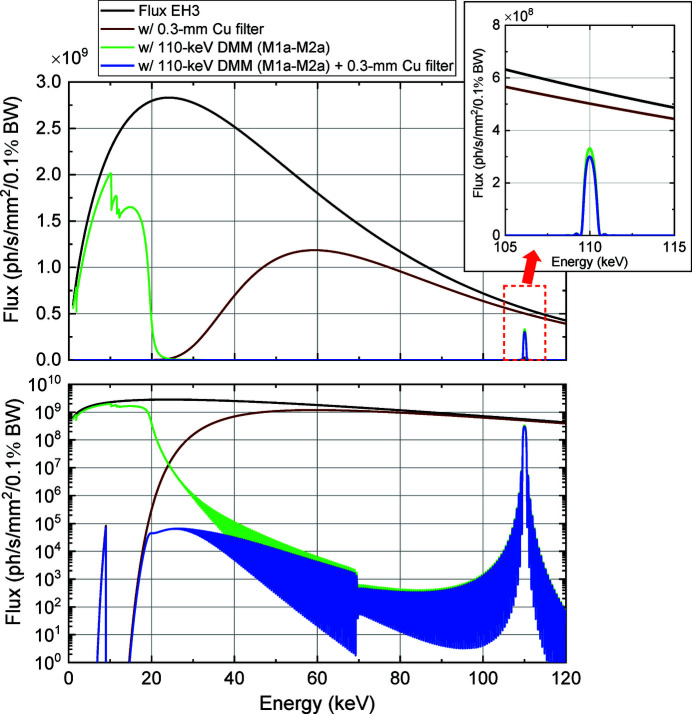
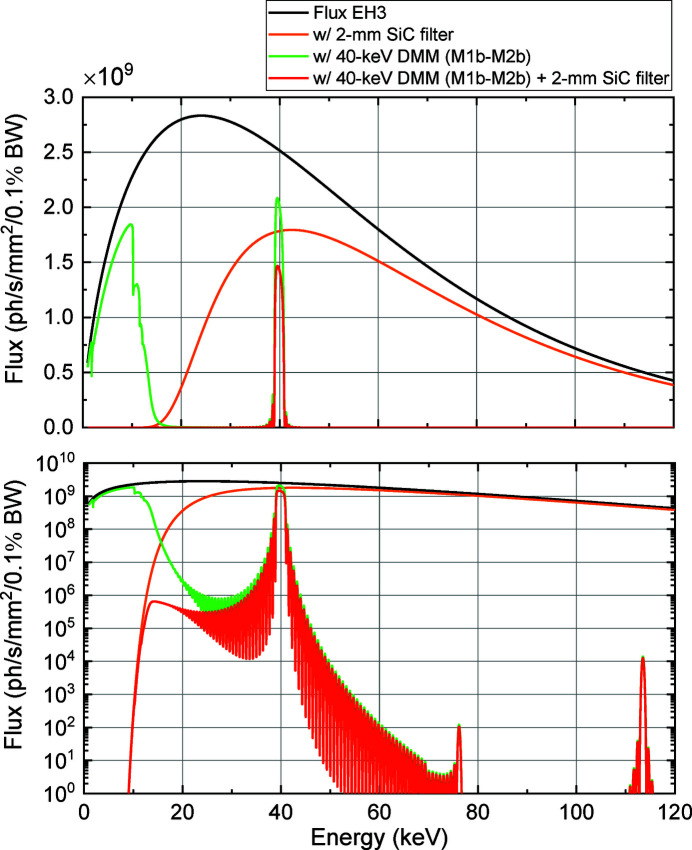
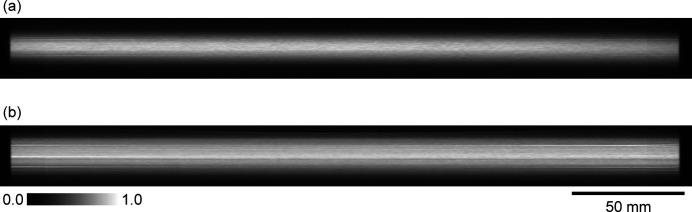
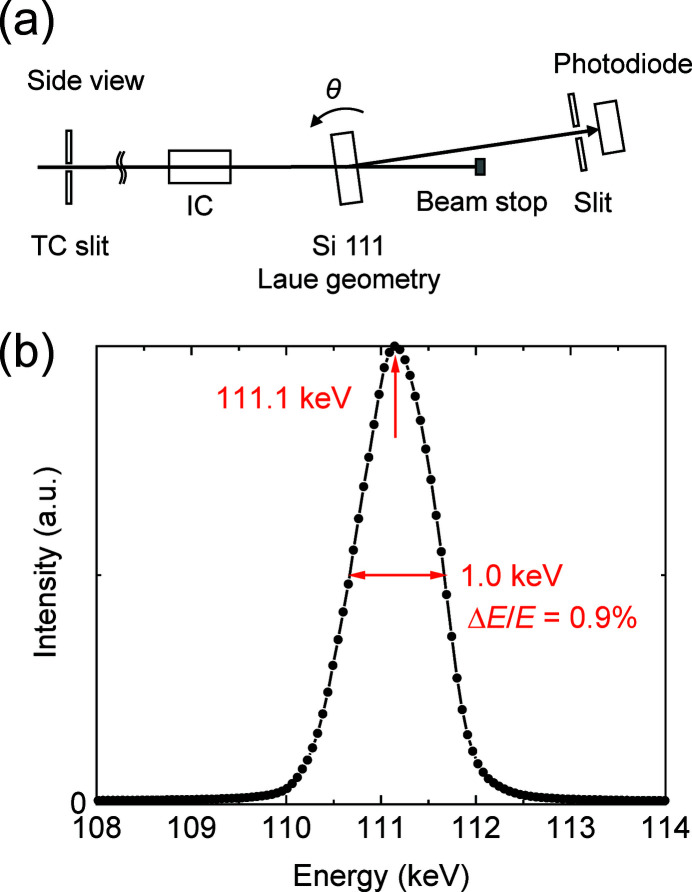
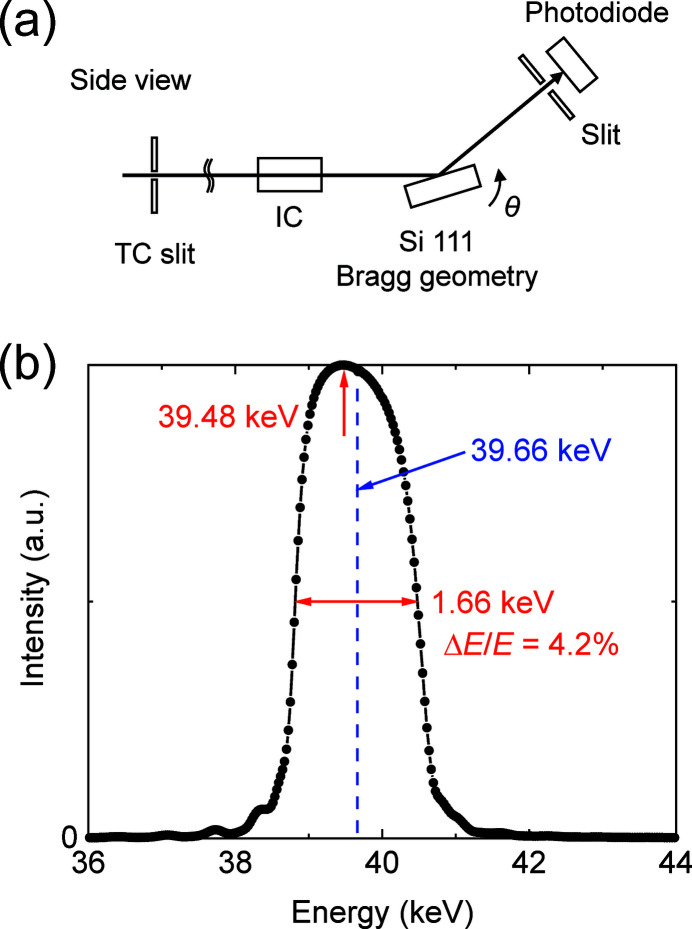
In this study, double-multilayer monochromators that generate intense, high-energy, pink X-ray beams are designed, installed and evaluated at the SPring-8 medium-length (215 m) bending-magnet beamline BL20B2 for imaging applications. Two pairs of W/B4C multilayer mirrors are designed to utilize photon energies of 110 keV and 40 keV with bandwidths of 0.8% and 4.8%, respectively, which are more than 100 times larger when compared with the Si double-crystal monochromator (DCM) with a bandwidth of less than 0.01%. At an experimental hutch located 210 m away from the source, a large and uniform beam of size 14 mm (V) × 300 mm (H) [21 mm (V) × 300 mm (H)] was generated with a high flux density of 1.6 × 10⁹ photons s-1 mm-2 (6.9 × 10¹⁰ photons s-1 mm-2) at 110 keV (40 keV), which marked a 300 (190) times increase in the photon flux when compared with a DCM with Si 511 (111) diffraction. The intense pink beams facilitate advanced X-ray imaging for large-sized objects such as fossils, rocks, organs and electronic devices with high speed and high spatial resolution.
Keywords: X-ray imaging; double-multilayer monochromator; high energy; large field of view; multilayer mirror.
open access.
Figures
Similar articles
-
Optical design and performance of the biological small-angle X-ray scattering beamline at the Taiwan Photon Source.J Synchrotron Radiat. 2021 Nov 1;28(Pt 6):1954-1965. doi: 10.1107/S1600577521009565. Epub 2021 Oct 18. J Synchrotron Radiat. 2021. PMID: 34738951 Free PMC article.
-
Sub-micrometre focusing of intense 100 keV X-rays with multilayer reflective optics.J Synchrotron Radiat. 2024 Mar 1;31(Pt 2):276-281. doi: 10.1107/S1600577524000213. Epub 2024 Feb 22. J Synchrotron Radiat. 2024. PMID: 38385278 Free PMC article.
-
A dedicated small-angle X-ray scattering beamline with a superconducting wiggler source at the NSRRC.J Synchrotron Radiat. 2009 Jan;16(Pt 1):97-104. doi: 10.1107/S0909049508034134. Epub 2008 Nov 14. J Synchrotron Radiat. 2009. PMID: 19096180
-
The beamlines of ELETTRA and their application to structural biology.Genetica. 1999;106(1-2):171-80. doi: 10.1023/a:1003757718266. Genetica. 1999. PMID: 10710723 Review.
-
Computed tomography with monochromatic x rays.Am J Physiol Imaging. 1992 Jul-Dec;7(3-4):175-93. Am J Physiol Imaging. 1992. PMID: 1343214 Review.
Cited by
-
The IMAGE beamline at the KIT Light Source.J Synchrotron Radiat. 2025 Jul 1;32(Pt 4):1036-1051. doi: 10.1107/S1600577525003777. Epub 2025 Jun 2. J Synchrotron Radiat. 2025. PMID: 40455641 Free PMC article.
-
Scaling and merging time-resolved pink-beam diffraction with variational inference.Struct Dyn. 2024 Nov 6;11(6):064301. doi: 10.1063/4.0000269. eCollection 2024 Nov. Struct Dyn. 2024. PMID: 39629168 Free PMC article.
-
X-ray phase contrast reveals soft tissue and shell growth lines in mollusks.Commun Biol. 2024 Jan 3;7(1):17. doi: 10.1038/s42003-023-05457-y. Commun Biol. 2024. PMID: 38172227 Free PMC article.
-
Scaling and Merging Time-Resolved Laue Data with Variational Inference.bioRxiv [Preprint]. 2024 Jul 31:2024.07.30.605871. doi: 10.1101/2024.07.30.605871. bioRxiv. 2024. Update in: Struct Dyn. 2024 Nov 06;11(6):064301. doi: 10.1063/4.0000269. PMID: 39131362 Free PMC article. Updated. Preprint.
-
Investigation of structural and reflective characteristics of short-period Mo/B4C multilayer X-ray mirrors.J Synchrotron Radiat. 2024 Mar 1;31(Pt 2):268-275. doi: 10.1107/S1600577524000419. Epub 2024 Feb 9. J Synchrotron Radiat. 2024. PMID: 38335149 Free PMC article.
References
-
- Chantler, C. T., Olsen, K., Dragoset, R. A., Chang, J., Kishore, A. R., Kotochigova, S. A. & Zucker, D. S. (2005). X-ray form factor, attenuation and scattering tables (Version 2.1) [Online]. Available: http://physics.nist.gov/ffast [14 January 2022]. Gaithersburg, MD: National Institute of Standards and Technology.
-
- Chu, Y. S., Liu, C., Mancini, D. C., De Carlo, F., Macrander, A. T., Lai, B. & Shu, D. (2002). Rev. Sci. Instrum. 73, 1485–1487.
-
- Di Michiel, M., Merino, J. M., Fernandez-Carreiras, D., Buslaps, T., Honkimäki, V., Falus, P., Martins, T. & Svensson, O. (2005). Rev. Sci. Instrum. 76, 043702.
-
- Goto, S., Takeshita, K., Suzuki, Y., Ohashi, H., Asano, Y., Kimura, H., Matsushita, T., Yagi, N., Isshiki, M., Yamazaki, H., Yoneda, Y., Umetani, K. & Ishikawa, T. (2001). Nucl. Instrum. Methods Phys. Res. A, 467–468, 682–685.
-
- Hoshino, M., Uesugi, K., Shikaku, R. & Yagi, N. (2017). AIP Adv. 7, 105122.
MeSH terms
LinkOut - more resources
Full Text Sources
