. 2022 Jan-Mar;63(1):83-97.
doi: 10.47162/RJME.63.1.08.

Maternal alloxan exposure induces damage in rat offspring lumbar vertebrae and protective role of arachidonic acid

Affiliations

Maternal alloxan exposure induces damage in rat offspring lumbar vertebrae and protective role of arachidonic acid

Ayman Salaheldeen Amer et al. Rom J Morphol Embryol. 2022 Jan-Mar.

Abstract

Background: Vertebral abnormalities in offspring of diabetic mothers make major challenges worldwide and were not sufficiently studied before.

Aim: To investigate the effects of alloxan-induced diabetes on rats' lumbar vertebrae, and to assess the potential beneficial impact of arachidonic acid.

Materials and methods: Pregnant rats were randomly equally divided into four groups: control, alloxan-induced diabetes received alloxan injection 150 mg∕kg, alloxan + arachidonic acid group received arachidonic acid 10 μg∕animal then given alloxan injection, and arachidonic acid group received it, until offspring age of three weeks. Six male offspring from each group were included in this study at ages of newborn, three-week-old, two-month-old, and their body measurements were recorded. Lumbar vertebrae and pancreas specimens were examined by light microscopy, morphometry, transmission electron microscopy (TEM), and immunohistochemistry for insulin expression.

Results: In alloxan-induced diabetes newborn, three-week-old, and two-month-old rats, body measurements were significantly declined, histomorphometry of 6th lumbar vertebrae revealed disorganized chondrocytes, with vacuolated cytoplasm, empty lacunae, diminished matrix staining, with areas devoid of cells. TEM showed shrunken reserve and proliferative cells, with irregular nuclei, and damaged mitochondria. In contrast, alloxan + arachidonic acid group had cytoarchitecture of lumbar vertebrae that were like control group. Histomorphometry of pancreas in alloxan-induced diabetes group showed significant reduction in pancreatic islets number and surface area, damaged pancreatic islet cells appeared atrophied with apoptotic nuclei, and very weak insulin immunostaining. Whereas alloxan + arachidonic acid group displayed healthy features of pancreatic islets, which resembled control group, with strong insulin immunostaining.

Conclusions: Arachidonic acid mitigated alloxan-induced diabetes by its antidiabetic activity.


Conflict of interest statement

The authors declare that there is no conflict of interests.

Figures

Figure 1
Figure 1
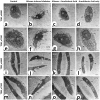
Photomicrographs of sagittal sections in the newborn rats’ 5th and 6th lumbar vertebrae showed the protective effect of arachidonic acid on alloxan-induced diabetes. Control group in (a, e, i and m) showed the normal histology of epiphyseal growth plates (E5 and E6) of the vertebrae, which had four zones of growing chondrocytes. The epiphyseal growth plates show normal homogenous distribution of green color (tailed arrow), and Toluidine blue staining in the cartilage matrix (thick arrow) between the growing chondrocytes. Alloxan-induced diabetes group in (b, f, j and n) showed apparent reduction in thickness of E5 and E6, with distortion and disorganization of small-sized chondrocytes with vacuolated cytoplasm (arrow). Diminished staining of the matrix (tailed arrow), empty lacunae (wavy arrow), areas of the matrix devoid of cells (arrowhead), and less developed primary ossification centers were seen. Alloxan + arachidonic acid in (c, g, k and o) showed healthy epiphyseal growth plates (E5 and E6) of the vertebrae, with four zones of growing chondrocytes, and well-developed primary ossification centers in centrum. Arachidonic acid group in (d, h, l and p) showed normal histology of epiphyseal growth plates (E5 and E6) of the vertebrae, with well-developed primary ossification centers. Note the intervertebral disk with nucleus pulposus (N) and annulus fibrosus (A). HE staining: (a–d and i–l) ×100, scale bar 100 μm. Masson’s trichrome technique: (e–h) ×100, scale bar 100 μm. Toluidine blue staining: (m–p) ×400, scale bar 20 μm. 1: Reserve (R) cells; 2: Proliferative (P) cells; 3: Hypertrophied (H) cells; 4: Calcification (C) zone with well-developed primary ossification centers in centrum; HE: Hematoxylin–Eosin
Figure 2
Figure 2
Transmission electron micrographs of ultrathin sections in the newborn rats’ 6th lumbar vertebrae showing the protective effect of arachidonic acid on alloxan-induced diabetes. Control group showed the normal ultrastructure of reserve zone cells (a and e) and proliferative zone cells (i and m) of the epiphyseal plates. The reserve cell had oval nucleus (N), rough endoplasmic reticulum (R), lipid granules (L), many mitochondria (M), multiple cytoplasmic processes (curved arrows), pericellular space (asterisk) and extracellular matrix (ECM) rich in collagen fibrils. The proliferative cells appear flattened and enclosed in lacunae (asterisk). The lacunae are separated from each other by transverse septa (TS). The cells show well-formed nucleus (N), multiple cytoplasmic processes (curved arrows), with surrounding ECM rich in collagen fibrils. Alloxan-induced diabetes group showed shrunken reserve cells (b and f) with irregular nucleus (N), cytoplasmic vacuolations (V), damaged mitochondria (M), typical of cell undergoing apoptosis, widened pericellular space (asterisk) and less collagen fibrils in the ECM. The proliferative cells (j and n) showed irregular outline with irregular nucleus (N), cytoplasmic vacuolations (V), widened lacunae (asterisk), and less developed rough endoplasmic reticulum (R). Alloxan + arachidonic acid group in (c, g, k and o) showed healthy appearance of the reserve and proliferative cells, which had oval nuclei (N), multiple cytoplasmic processes (curved arrows), many mitochondria (M), pericellular space (asterisk) and ECM rich in collagen fibrils. The proliferative cells were enclosed in lacunae (asterisk), which were separated from each other by TS. Arachidonic acid group in (d, h, l and p) showed the normal features of reserve and proliferative cells. Uranyl acetate and Lead citrate staining, transmission electron microscopy (TEM): (a–d and i–l) ×4800; (e–h and m–p) ×7200; scale bar 2 μm
Figure 3
Figure 3
Photomicrographs of sagittal sections in the three weeks old rats’ 5th and 6th lumbar vertebrae showed the protective effect of arachidonic acid on alloxan-induced diabetes. Control group in (a, e, i and m) showed the epiphyseal growth plates (E5 and E6), with normal appearance of the vertebrae, which had zones of growing chondrocytes. The epiphyseal growth plates show normal homogenous distribution of green color (tailed arrow), and Toluidine blue staining in the cartilage matrix (thick arrow) between the growing chondrocytes. Alloxan-induced diabetes group in (b, f, j and n) showed reduced thickness of E5 and E6, with distortion of small-sized chondrocytes, which had vacuolated cytoplasm (arrow). Diminished staining of the matrix (tailed arrow), empty lacunae (wavy arrow), and areas of the matrix devoid of cells (arrowhead) suggestive of cellular disintegration, and less developed primary ossification centers (C) were seen. Alloxan + arachidonic acid in (c, g, k and o) showed healthy epiphyseal growth plates (E5 and E6) of the vertebrae, with zones of growing chondrocytes, and homogenous distribution of staining in the cartilage matrix. Arachidonic acid group in (d, h, l and p) showed normal histological appearance of the epiphyseal growth plates (E5 and E6). Note the intervertebral disk with nucleus pulposus (N) and annulus fibrosus (A). HE staining: (a–d and i–l) ×100, scale bar 100 μm. Masson’s trichrome technique: (e–h) ×100, scale bar 100 μm. Toluidine blue staining: (m–p) ×400, scale bar 20 μm. 1: Reserve (R) cells; 2: Proliferative (P) cells; 3: Hypertrophied (H) cells; HE: Hematoxylin–Eosin
Figure 4
Figure 4
Transmission electron micrographs of ultrathin sections in the three weeks old rats’ 6th lumbar vertebrae showing the protective effect of arachidonic acid on alloxan-induced diabetes. Control group showed the ultrastructure of reserve zone cells (a and e) and proliferative zone cells (i and m) of the epiphyseal plates. The reserve cell had triangular shape with large oval nucleus (N) occupying most of the cytoplasm, rough endoplasmic reticulum (R), lipid granules (L), many mitochondria (M), multiple cytoplasmic processes (curved arrows), pericellular space (asterisk), and extracellular matrix (ECM) rich in collagen fibrils. The proliferative cells were flattened and enclosed in lacunae (asterisk), which were separated from each other by transverse septa (TS). The cells showed oval nuclei (N), multiple cytoplasmic processes (curved arrows), lipid granules (L) evident in the cytoplasm, with surrounding ECM rich in collagen fibrils. Alloxan-induced diabetes group in (b, f, j and n) showed shrunken irregular-shaped reserve cells (b and f), with irregular nucleus (N), cytoplasmic vacuolations (V), damaged mitochondria (M); typical of cells undergoing apoptosis, with widened pericellular space (asterisk) and less collagen fibrils in the ECM. The proliferative cells (j and n) were reduced in size with irregular nucleus (N), cytoplasmic vacuolations (V), and less developed rough endoplasmic reticulum (R). Alloxan + arachidonic acid group in (c, g, k and o) showed the cellular structure returned to normal with healthy appearance of the reserve and proliferative cells, which had oval nuclei (N), multiple cytoplasmic processes (curved arrows), many mitochondria (M), preserved pericellular space (asterisk) and ECM rich in collagen fibrils. The proliferative cells were enclosed in lacunae, which were separated from each other by TS. Arachidonic acid group in (d, h, l and p) showed the normal features of reserve and proliferative cells. Uranyl acetate and Lead citrate staining, transmission electron microscopy (TEM): (a–d and i–l) ×4800; (e–h and m–p) ×7200; scale bar 2 μm
Figure 5
Figure 5
Photomicrographs of the sagittal sections in the two months old rats’ 5th and 6th lumbar vertebrae showed the protective effect of arachidonic acid on alloxan-induced diabetes. Control group in (a, e, i and m) showed the epiphyseal growth plates (E5 and E6), with healthy normal appearance of the vertebrae that had zones of growing chondrocytes. The epiphyseal growth plates show normal homogenous distribution of green color (tailed arrow), and Toluidine blue staining in the cartilage matrix (thick arrow) between the growing chondrocytes. Alloxan-induced diabetes group in (b, f, j and n) showed decreased thickness of E5 and E6, with disorganization of growing chondrocytes. Diminished staining of the matrix (tailed arrow), empty lacunae (wavy arrow), and areas of the matrix devoid of cells (arrowhead), and less developed primary (C5 and C6) and secondary ossification (O) centers (C) were seen. Alloxan + arachidonic acid in (c, g, k and o) showed healthy epiphyseal growth plates (E5 and E6) of the vertebrae, with zones of growing chondrocytes, well developed primary (C5 and C6) and secondary ossification (O) centers (C), and homogenous distribution of staining in the cartilage matrix. Arachidonic acid group in (d, h, l and p) showed normal histological appearance of the epiphyseal growth plates (E5 and E6) and ossification (O) centers (C). Note the intervertebral disk with nucleus pulposus (N) and annulus fibrosus (A). HE staining: (a–d and i–l) ×100, scale bar 100 μm. Masson’s trichrome technique: (e–h) ×100, scale bar 100 μm. Toluidine blue staining: (m–p) ×400, scale bar 20 μm. H: Hypertrophied cells; HE: Hematoxylin–Eosin; P: Proliferative cells; R: Reserve cells
Figure 6
Figure 6
Photomicrographs of paraffin cross-sections in the rats’ pancreas of the mothers of the studied groups showed the protective effect of arachidonic acid on alloxan-induced diabetes. Control group in (a, e and i) showed pancreatic islets (thick arrow), which were interspersed between pancreatic acini (arrow), with distinct border (arrowhead), and normal islets cells with vesicular nuclei (tailed arrow). Immunohistochemistry showed localization of β-cells in the islets as intense brown color of insulin immunoexpression (double arrows). Alloxan-induced diabetes group in (b, f and j) showed shrinkage of the pancreatic islets (thick arrow), with faint border between islets and pancreatic acini (arrowhead). Islets cells were atrophied, with apoptotic nuclei (wavy arrow), vacuolations (short arrows), and showed weak insulin immunoexpression (curved arrow). Alloxan + arachidonic acid group in (c, g and k) showed restoration of the healthy features of pancreatic islets, with strong positive insulin immunoreactivity presented as intense brown color (double arrows). Arachidonic acid group in (d, h and l) showed normal appearance of the pancreatic islets, and strong positive insulin immunoreactivity was seen as intense brown color (double arrows). Hematoxylin–Eosin (HE) staining: (a–d) ×200, scale bar 50 μm; (e–h) ×400, scale bar 20 μm. Anti-insulin antibody immunostaining, counterstained with Hematoxylin: (i–l) ×200, scale bar 50 μm
Figure 7
Figure 7
Pancreatic morphometric results of the rats’ mothers obtained in the current study analyzed using GraphPad Prism Software version 5 (GraphPad Software Inc., La Jolla, CA, USA): https://www.graphpad.com/scientific-software/prism/. (a) Alloxan significantly decreased the number of pancreatic islets, and the addition of arachidonic acid kept the normal number of islets. (b) Alloxan significantly reduced the surface area of the islets, and the use of arachidonic acid maintained the normal surface area of pancreatic islets. (c) Alloxan significantly decreased the number of β-cells per islet, and the addition of arachidonic acid kept the normal number of β-cells. Results are expressed as the mean ± SD of six rats per group. &,#Different symbols indicate significant differences at p<0.05 (one-way ANOVA followed by Bonferroni’s post hoc test). ANOVA: Analysis of variance; SD: Standard deviation

References

    1. Bell R, Bailey K, Cresswell T, Hawthorne G, Critchley J, Lewis-Barned N, Northern Diabetic Pregnancy Survey Steering Group Trends in prevalence and outcomes of pregnancy in women with pre-existing type I and type II diabetes. BJOG. 2008;115(4):445–452. - PubMed
    1. Eriksson UJ, Wentzel P. The status of diabetic embryopathy. Ups J Med Sci. 2016;121(2):96–112. - PMC - PubMed
    1. Dabelea D, Mayer-Davis EJ, Lamichhane AP, D’Agostino RB, Liese AD, Vehik KS, Narayan KMV, Zeitler P, Hamman RF. Association of intrauterine exposure to maternal diabetes and obesity with type 2 diabetes in youth: the SEARCH case-control study. Diabetes Care. 2008;31(7):1422–1426. - PMC - PubMed
    1. Knight KM, Pressman EK, Hackney DN, Thornburg LL. Perinatal outcomes in type 2 diabetic patients compared with non-diabetic patients matched by body mass index. J Matern Fetal Neonatal Med. 2012;25(6):611–615. - PubMed
    1. Vinceti M, Malagoli C, Rothman KJ, Rodolfi R, Astolfi G, Calzolari E, Puccini A, Bertolotti M, Lunt M, Paterlini L, Martini M, Nicolini F. Risk of birth defects associated with maternal pregestational diabetes. Eur J Epidemiol. 2014;29(6):411–418. - PubMed