. 2022 Dec 19;145(12):4349-4367.
doi: 10.1093/brain/awac325.

Regulation of mitophagy by the NSL complex underlies genetic risk for Parkinson's disease at 16q11.2 and MAPT H1 loci

Affiliations

Regulation of mitophagy by the NSL complex underlies genetic risk for Parkinson's disease at 16q11.2 and MAPT H1 loci

Marc P M Soutar et al. Brain. .

Abstract

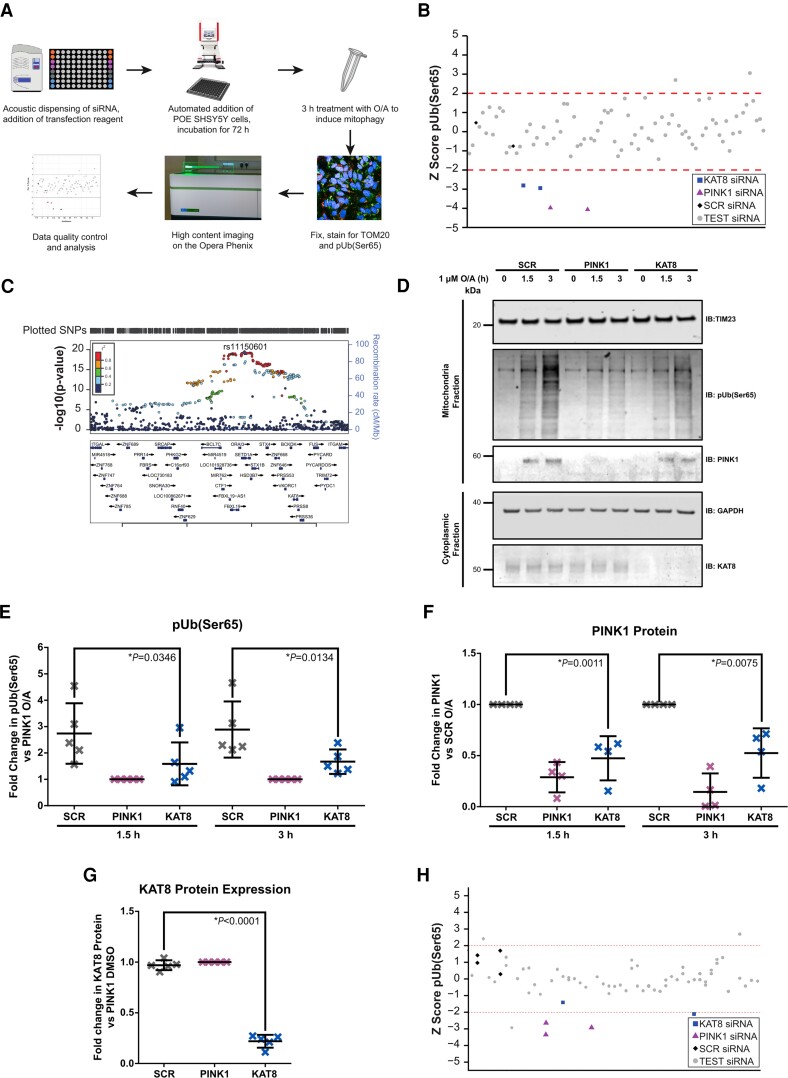
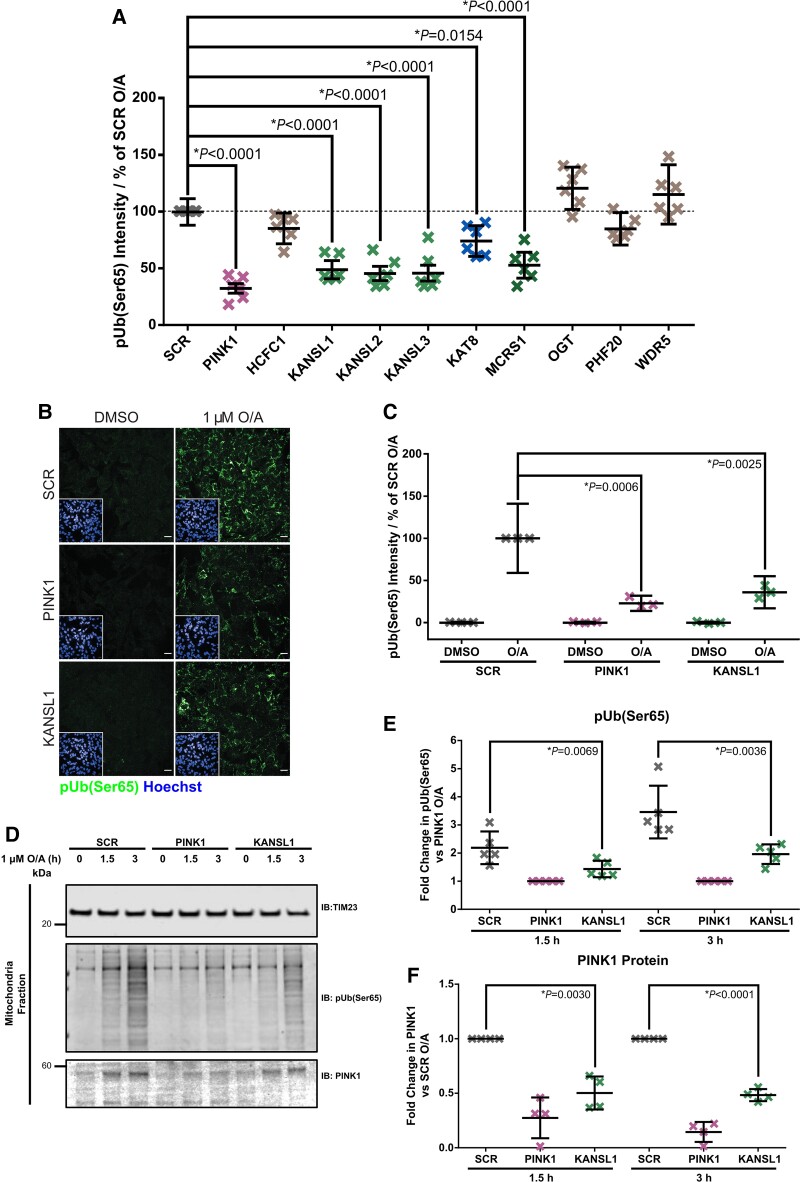
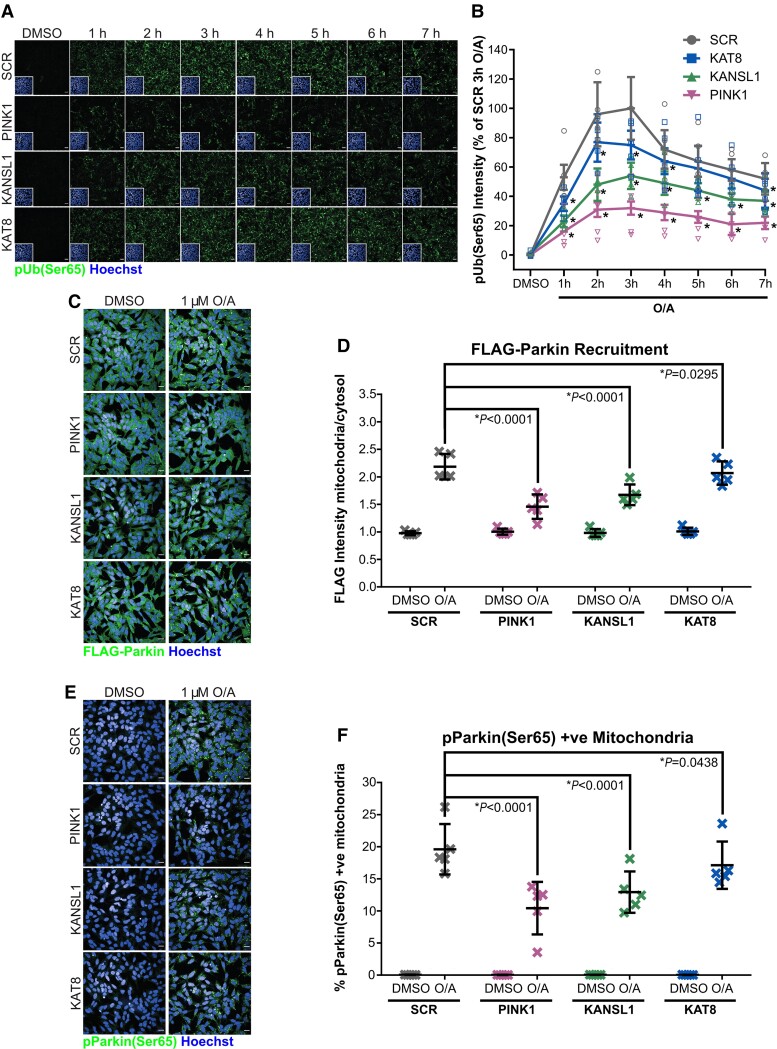
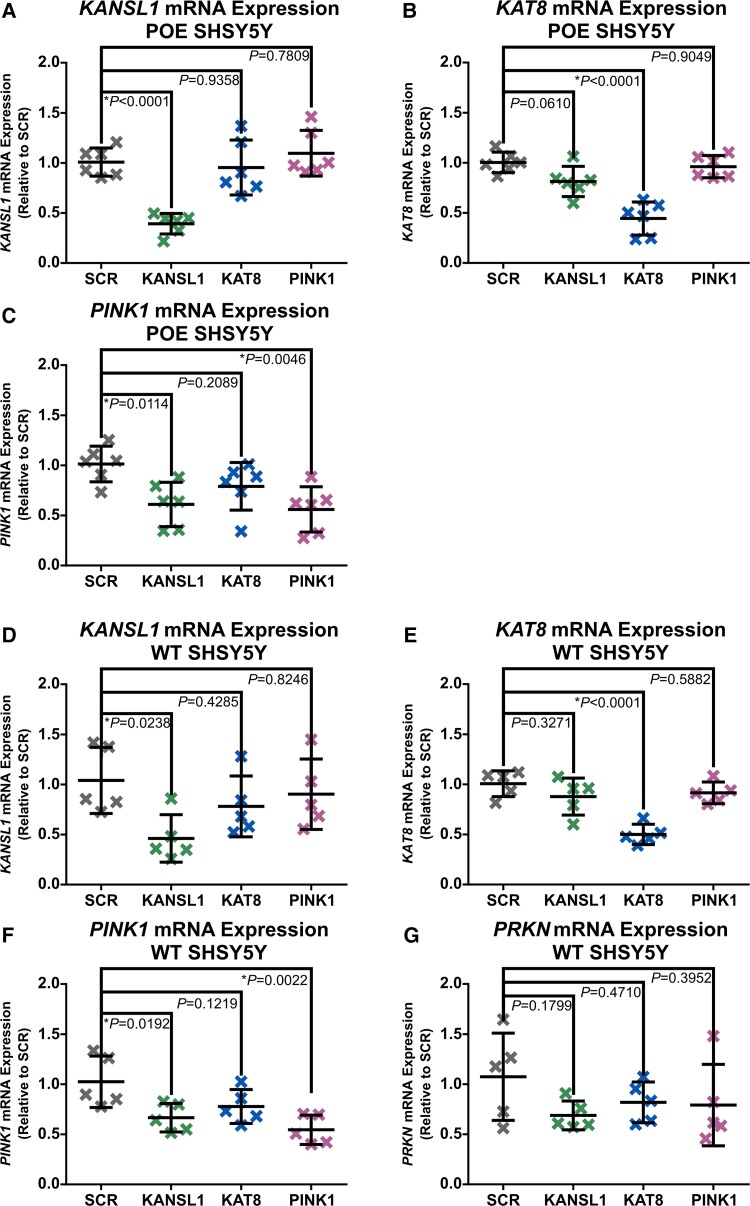
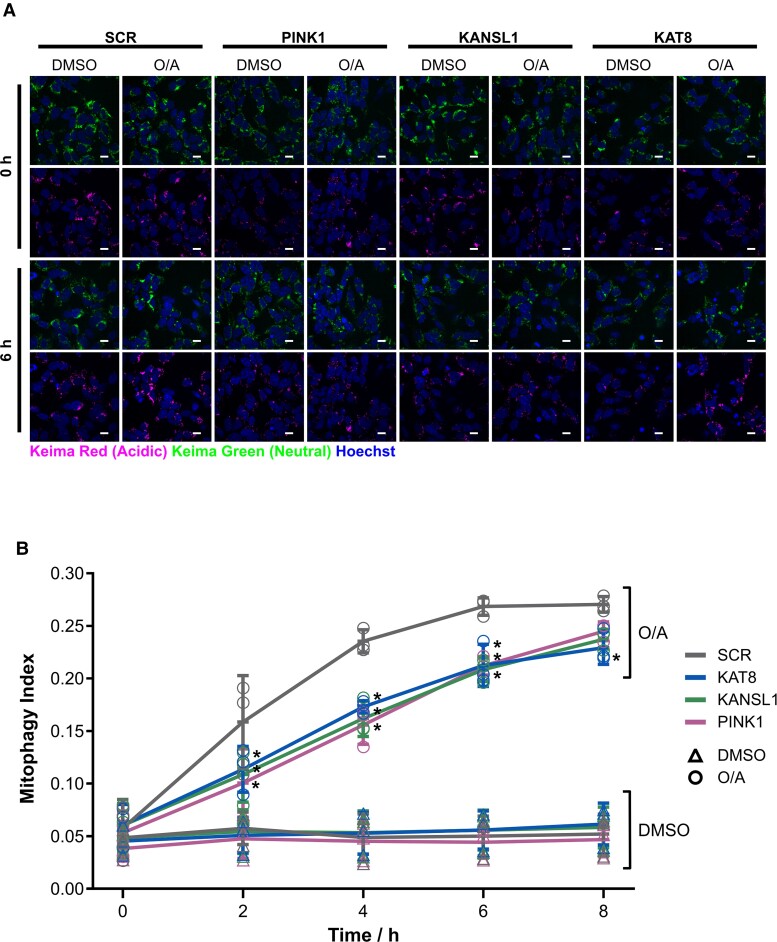
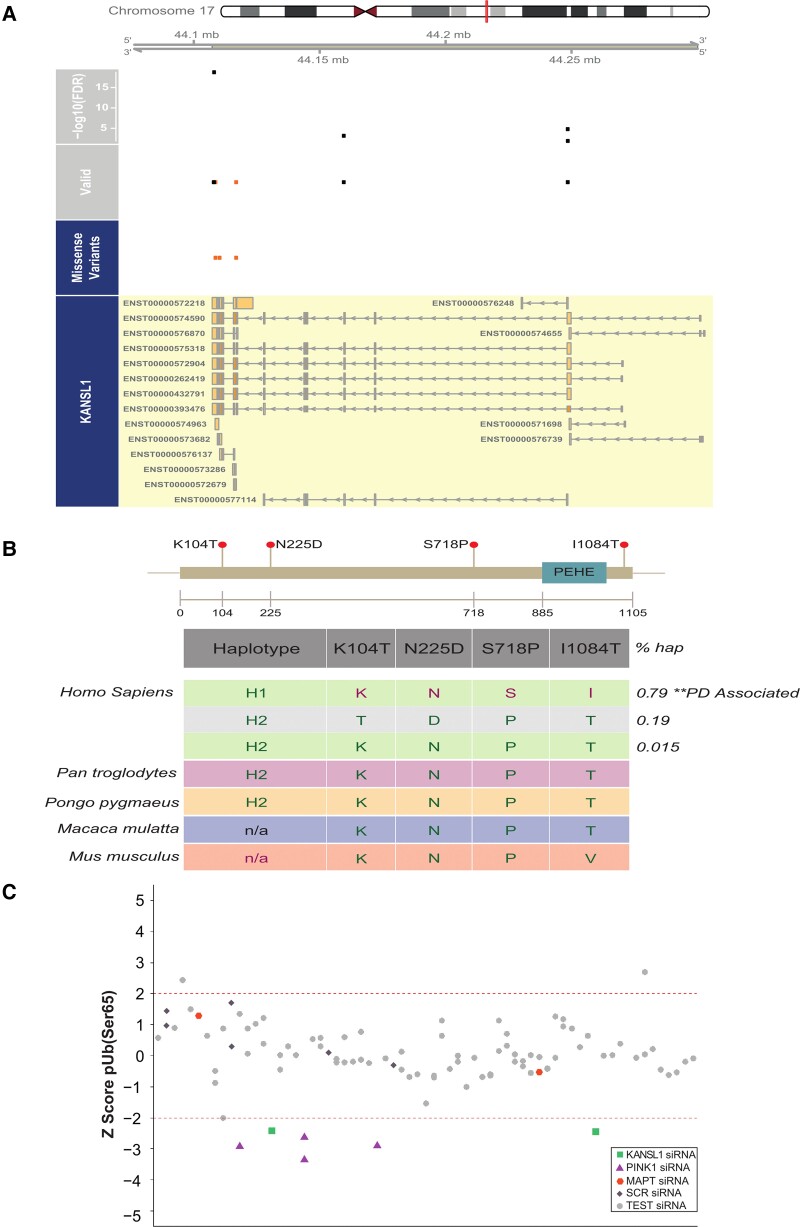
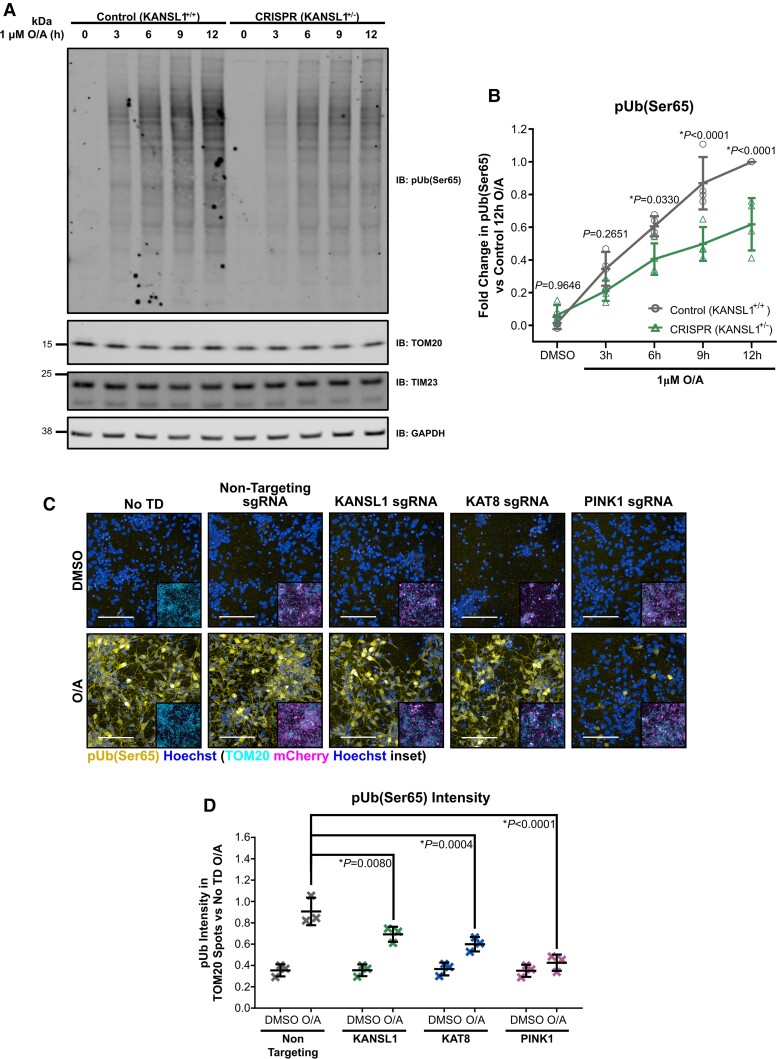
Parkinson's disease is a common incurable neurodegenerative disease. The identification of genetic variants via genome-wide association studies has considerably advanced our understanding of the Parkinson's disease genetic risk. Understanding the functional significance of the risk loci is now a critical step towards translating these genetic advances into an enhanced biological understanding of the disease. Impaired mitophagy is a key causative pathway in familial Parkinson's disease, but its relevance to idiopathic Parkinson's disease is unclear. We used a mitophagy screening assay to evaluate the functional significance of risk genes identified through genome-wide association studies. We identified two new regulators of PINK1-dependent mitophagy initiation, KAT8 and KANSL1, previously shown to modulate lysine acetylation. These findings suggest PINK1-mitophagy is a contributing factor to idiopathic Parkinson's disease. KANSL1 is located on chromosome 17q21 where the risk associated gene has long been considered to be MAPT. While our data do not exclude a possible association between the MAPT gene and Parkinson's disease, they provide strong evidence that KANSL1 plays a crucial role in the disease. Finally, these results enrich our understanding of physiological events regulating mitophagy and establish a novel pathway for drug targeting in neurodegeneration.

Keywords: GWAS; KANSL1; KAT8; Parkinson’s disease; mitophagy.


Conflict of interest statement

The authors declare that they have no conflict of interest

Figures

Figure 1
Figure 1
High-content mitophagy screening of Parkinson’s disease risk genes identifies KAT8 as a modulator of pUb(Ser65) levels. (A) Workflow of the high-content screen for O/A-induced pUb(Ser65) levels. (B) pUb(Ser65) Z scores of one representative mitophagy screen plate. (C) Overview of the Parkinson’s disease GWAS genetic signal at the KAT8 locus. (D) Representative IB of mitochondrial fractions from SCR, PINK1 and KAT8 KD POE SHSY5Y treated with 1 µM O/A for 1.5 or 3 h. (E) Quantification of pUb(Ser65) in E (n = 5, one-way ANOVA with Dunnett’s correction). (F) Quantification of PINK1 in E (n = 4, one-way ANOVA with Dunnett’s correction). (G) Quantification of KAT8 in E (n = 5, one-way ANOVA with Dunnett’s correction). (H) pUb(Ser65) Z scores of one representative lysine acetyltransferase screen plate. See Supplementary Table 5 for the complete list of the genes screened. Data are shown as mean ± SD.
Figure 2
Figure 2
Knockdown of KANSL1 affects pUb(Ser65) levels. (A) Quantification of pUb(Ser65) following treatment of SCR, PINK1 or NSL components siRNA KD POE SHSY5Y cells with 1 μM O/A for 1.5 h. Data are shown as mean ± SD; n = 6, one-way ANOVA with Dunnett’s correction. (B) Representative images of pUb(Ser65) (green) following treatment of SCR, PINK1 and KANSL1 KD POE SHSY5Y cells with 1 µM O/A for 3 h. Insets show the nuclei (blue) for the same fields. Scale bar = 20 μm. (C) Quantification of pUb(Ser65) in B (n = 3, two-way ANOVA with Dunnett’s correction). (D) Representative IB of mitochondrial fractions from SCR, PINK1 and KANSL1 KD POE SHSY5Y treated with 1 μM O/A for 1.5 or 3 h. (E) Quantification of pUb(Ser65) in D (n = 5, one-way ANOVA with Dunnett’s correction). (F) Quantification of PINK1 in D (n = 4, one-way ANOVA with Dunnett’s correction). Data are shown as mean ± SD.
Figure 3
Figure 3
KAT8 and KANSL1 knockdown decreases PINK1-dependent mitophagy initiation. (A) Representative images of pUb(Ser65) (green) following treatment of SCR, PINK1, KAT8 and KANSL1 KD POE SHSY5Y cells with 1 μM O/A for 0–7 h. Insets show the nuclei (blue) for the same fields. Scale bar = 20 μm. (B) Quantification of pUb(Ser65) in A (n = 6, two-way ANOVA with Dunnett’s correction). For details on the statistical test, see Supplementary Table 6. (C) Representative images of FLAG-Parkin (green) with Hoechst nuclei counterstain (blue) following treatment of SCR, PINK1 and KAT8 siRNA KD POE SHSY5Y with 1 µM O/A for 3 h. Scale bar = 20 µm. (D) Quantification of FLAG-Parkin recruitment to the mitochondria as a ratio of FLAG intensity in the mitochondria and in the cytosol in C (n = 5, two-way ANOVA with Dunnett’s correction). (E) Representative images of pParkin (green) with Hoechst nuclei counterstain (blue) following treatment of SCR, PINK1 and KAT8 siRNA KD POE SHSY5Y with 1 µM O/A for 3 h. Scale bar = 20 µm. (F) Quantification of pParkin levels in E (n = 5, two-way ANOVA with Dunnett’s correction). Data are shown as mean ± SD.
Figure 4
Figure 4
Real-time qPCR Assessments of KANSL1, KAT8, PINK1 and PRKN gene expression in POE and WT SHSY5Ys. (AC) Real-time qPCR quantification of KANSL1 mRNA (A), KAT8 mRNA (B) and PINK1 mRNA (C) in POE SHSY5Ys (n = 6, one-way ANOVA with Dunnett’s correction). (DG) Real-time qPCR quantification of KANSL1 mRNA (D), KAT8 mRNA (E), PINK1 mRNA (F) and PRKN mRNA (G) in WT SHSY5Ys (n = 5, one-way ANOVA with Dunnett’s correction). Data are shown as mean ± SD.
Figure 5
Figure 5
KANSL1 and KAT8 knockdown decrease mitochondrial clearance. (A) Representative images of mt-Keima following treatment of SCR, PINK1 and KAT8 siRNA KD POE SHSY5Y with 1 µM O/A for 0–8 h. The first and third rows show the neutral Keima-green signal (green) counterstained with Hoechst (blue) after 0 and 6 h, respectively, of DMSO versus O/A. The second and fourth rows show the acidic lysosomal Keima-red signal (red) counterstained with Hoechst (blue) after 0 and 6 h, respectively, of DMSO versus O/A. Scale bar = 25 µm. (B) Quantification of the mitophagy index, calculated as the ratio of the area of lysosomal mt-Keima signal and total mt-Keima signal in A (n = 3, one-way ANOVA with Dunnett’s correction). For details on the statistical test, see Supplementary Table 7. Data are shown as mean ± SD.
Figure 6
Figure 6
KANSL1 presents ASE sites in LD with the H1/H2 SNP, and pUb(Ser65) levels are altered by siRNA KD of KANSL1 but not other genes present at the 17q21 locus. (A) ASEs derived from putamen and substantia nigra in high LD with the H1/H2 tagging SNP, rs12185268 and their position along the KANSL1 gene. The missense variants track displays the variants annotated as missense by gnomAD v.2.1.1. The valid track displays the heterozygous sites (orange = missense) with an average read depth >15 reads across all samples, which were examined for ASE. The topmost track displays the false discovery rate-corrected minimum −log10P-value across samples for the sites that show an ASE in at least one sample. (B) Conservation of the KANSL1 protein across species. The four coding variants (NM_001193465) in the KANSL1 gene are in high LD (r2 > 0.8) with the H1/H2 haplotypes. (C) pUb(Ser65) Z scores of one representative 17q21 locus screen plate. See Supplementary Table 10 for the complete list of the genes screened.
Figure 7
Figure 7
pUb(Ser65) levels are reduced in isogenic iNeurons with heterozygous KANSL1+/- loss of function and CRISPRi-i3N iNeurons with KANSL1 and KAT8 sgRNA KD. (A) Representative IB of isogenic d17 iNeurons with/without heterozygous LoF frameshift mutation in KANSL1 treated with 1 µM O/A over a 12 h extended time-course. (B) Quantification of pUb(Ser65) in A (n = 4 inductions, two-way ANOVA with Dunnett’s correction). (C) Representative images of pUb(Ser65) (yellow) with Hoechst nuclei counterstain (blue) following treatment of non-transduced (No TD), non-targeting, KANSL1, KAT8 and PINK1 sgRNA KD d17 CRISPRi-i3N iNeurons with 1 µM O/A versus DMSO for 9 h. Inserts show staining for TOM20 (cyan) and mCherry transduction reporter (magenta) with Hoechst nuclei counterstain (blue) for the same field of view. Scale bar = 100 µm. (D) Quantification of pUb(Ser65) intensity in TOM20 defined mitochondrial area in D (n = 3 inductions, two-way ANOVA with Dunnett’s correction). Data are shown as mean ± SD.

Comment in

References

    1. Hardy J, Lewis P, Revesz T, Lees A, Paisan-Ruiz C. The genetics of Parkinson’s syndromes: A critical review. Curr Opin Genet Dev. 2009;19:254–265. - PubMed
    1. Connolly BS, Lang AE. Pharmacological treatment of Parkinson disease: A review. JAMA. 2014;311:1670–1683. - PubMed
    1. Chang D, Nalls MA, Hallgrímsdóttir IB, et al. . A meta-analysis of genome-wide association studies identifies 17 new Parkinson’s disease risk loci. Nat Genet. 2017;49:1511–1516. - PMC - PubMed
    1. Nalls MA, Blauwendraat C, Vallerga CL, et al. . Identification of novel risk loci, causal insights, and heritable risk for Parkinson’s disease: A meta-analysis of genome-wide association studies. Lancet Neurol. 2019;18:1091–1102. - PMC - PubMed
    1. Nalls MA, Plagnol V, Hernandez DG, et al. . Imputation of sequence variants for identification of genetic risks for Parkinson’s disease: A meta-analysis of genome-wide association studies. Lancet. 2011;377:641–649. - PMC - PubMed

Publication types