. 2022 Oct 6;82(19):3538-3552.e5.
doi: 10.1016/j.molcel.2022.08.007. Epub 2022 Sep 7.

S1-END-seq reveals DNA secondary structures in human cells

Affiliations

S1-END-seq reveals DNA secondary structures in human cells

Gabriel Matos-Rodrigues et al. Mol Cell. .

Abstract

DNA becomes single stranded (ssDNA) during replication, transcription, and repair. Transiently formed ssDNA segments can adopt alternative conformations, including cruciforms, triplexes, and quadruplexes. To determine whether there are stable regions of ssDNA in the human genome, we utilized S1-END-seq to convert ssDNA regions to DNA double-strand breaks, which were then processed for high-throughput sequencing. This approach revealed two predominant non-B DNA structures: cruciform DNA formed by expanded (TA)n repeats that accumulate in microsatellite unstable human cancer cell lines and DNA triplexes (H-DNA) formed by homopurine/homopyrimidine mirror repeats common across a variety of cell lines. We show that H-DNA is enriched during replication, that its genomic location is highly conserved, and that H-DNA formed by (GAA)n repeats can be disrupted by treatment with a (GAA)n-binding polyamide. Finally, we show that triplex-forming repeats are hotspots for mutagenesis. Our results identify dynamic DNA secondary structures in vivo that contribute to elevated genome instability.

Keywords: DNA secondary structures; END-seq; Friederichs ataxia; H-DNA; cruciforms; genome instability; mutations; non B-DNA; triplexes.


Conflict of interest statement

Declaration of interests The authors declare no competing interests.

Figures

Figure 1:
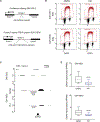
Figure 1:. S1-END-seq reveals cruciform structures at expanded (TA)n repeats in microsatellite unstable cells.
(A) Schematic representation of the S1-END-seq method. Cells are embedded in agarose, S1 endonuclease converts ssDNA gaps/breaks into DSBs and the DSB ends are ligated to biotinylated adaptors. After DNA sonication, DSBs are captured by streptavidin magnetic beads, Illumina sequencing adaptors are added to the DNA ends, and the samples are subject to sequencing. Left end reads are aligned to minus stand and right end reads are aligned to the plus strand. A typical two-ended DSB is displayed. (B) Genome browser screenshots as normalized read density (reads per million, RPM) for END-seq in KM12 cells after WRN knockdown (shWRN) for 48h (top track) and S1-END-seq in MSI (KM12, SW48 and RKO) and MSS (SW620 and SW837) colon cancer cell lines (2nd to 6th tracks). Plus- and minus-strand reads are displayed in black and grey, respectively. MSI: microsatellite unstable. MSS: microsatellite stable. Black triangle represent the plus strand repeat annotation. Statistical analysis: Student’s t-test, *p<0,05. (C) Number of (TA)n repeats detected at S1-END-seq peaks in each cell line. (D) Venn-diagram comparing END-seq breaks at (TA)n repeats in KM12 cells after WRN knockdown and S1-END-seq peaks at (TA)n repeats in WRN-proficient KM12 cells.
Figure 2:
Figure 2:. S1-END-seq reveals S1-sensitive homopurine/homopyrimidine (hPu/hPy) repeats genome wide.
(A) Number of S1-END-seq peaks at hPu/hPy repeats (red), (TA)n repeats (grey) and other peaks (black) in MSI (KM12, SW48 and RKO) and MSS (SW620 and SW837) colon cancer cell lines. (B) Quantification of S1-END-seq vs. END-seq intensities (RPKM, reads per kilobase per million mapped reads) at hPu/Py repeat peaks in two independent experimental replicates in KM12 cells performed in parallel. The top, center mark, and bottom hinges of the box plots, respectively, indicate the 90th, median, and 10th percentile values. Statistical analysis: Wilcoxon rank sum test, **** p<0,0001. (C) Genome browser screenshots as normalized read density (reads per million, RPM) for S1-END-seq and END-seq in KM12 cells. Plus- and minus-strand reads are displayed in black and grey, respectively.
Figure 3:
Figure 3:. S1-END-seq peaks in hPu/hPy mirror repeats display asymmetric strand polarity.
(A) Representative genome browser screenshots as normalized read density (reads per million, RPM) for S1-END-seq peaks at hPu/hPy repeats (GAAA and TTTC) in five different colon cancer cell lines KM12, SW48, RKO, SW620 and SW837. Black triangle represent the plus strand repeat annotation. Plus- and minus-strand reads are displayed in black and grey, respectively. (B) Aggregate plots (top) and heatmaps (bottom) of S1-END-seq intensity flanking 500bp at the center of S1 sensitive hPu/hPy mirror repeats in KM12. The data displays S1-ENDseq intensity using full read length (left) or using the first (5’) nucleotide sequenced (right). (C) Schematic representation of potential H-DNA structures (H-r5 and H-y3) that are consistent with the strand bias observed in S1-END-seq peaks. Homopurine (hPu) mirror repeats are represented in red and homopyrimidine (hPy) mirror repeats are represented in blue.
Figure 4:
Figure 4:. H-DNA formation in (GAA)n repeats are suppressed by (GAA)n binding polyamide in vivo.
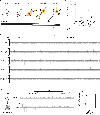
(A) Schematic representation of (GAA)n repeat size within the first intron of the FXN locus in lymphoblasts cell lines derived from a FRDA patient (GM15850) and its unaffected sibling (GM15851). (B) Analysis of cell cycle distribution by EdU (S-phase) and DAPI (nucleus) staining after the treatment with the polyamide PA1 (1μM) or vehicle (DMSO) for 48 hours. (C) Genome browser screenshots shown as RPM, reads per million for S1-END-seq at the FXN intron 1 of GM15851 and GM15850 treated with PA1 or DMSO for 48 hours. Plus- and minus-strand reads are displayed in black and grey, respectively. Black triangle represent the plus strand repeat annotation. (GAA)n repeat annotated in reference genome is shown. (D) Quantitative analysis of reads per kilo million (RPKM) of S1-END-seq in peaks in (GAA)n repeats from GM15851 or GM15850 cells treated with PA1 or DMSO for 48 hours. The top, center mark, and bottom hinges of the box plots, respectively, indicate the 90th, median, and 10th percentile values. Statistical analysis: Wilcoxon rank sum test, **** p<0,0001.
Figure 5:
Figure 5:. H-DNA is formed during replication.
(A, B and C) Analysis of cell cycle distribution by EdU (S-phase) and DAPI (nucleus) staining (left panel) and quantification of S1-END-seq peaks in hPu/hPy mirror repeats (right panel) after the treatment with (A) aphidicolin (APH, 600nM) (B) CDK4/6 inhibitor (Palbociclib, 10μM) or (C) CDK1 inhibitor (RO-3306, 10μM) or or vehicle (DMSO) for 24 hours. Experiments were performed in KM12 cells. The top, centre mark, and bottom hinges of the box plots, respectively, indicate the 90th, median, and 10th percentile values. Statistical analysis: Wilcoxon rank sum test, **** p<0,0001.
Figure 6:
Figure 6:. DNA triplexes are transiently created during the induction of iPSC differentiation into neurons.
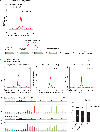
(A) Schematic representation of human induced pluripotent stem cells (iPSC) differentiation and cell cycle exit upon neuronal induction via i3N protocol. (B) Quantification of peaks at hPu/hPy repeats in reads per kilo million (RPKM) and (C) genome browser screenshots shown as RPM, reads per million from S1-END-seq performed in asynchronous iPSCs and iPSCs after induction of neuronal differentiation via i3N protocol for 1, 2, 3 or 5 days. Plus- and minus-strand reads are displayed in black and grey, respectively. (D) (left) S1-END-seq genome browser screenshots shown as RPM, reads per million and (right) quantification of peaks at hPu/hPy repeats in reads per kilo million (RPKM) in primary normal human epithelial keratinocytes (NHEK) and in the transformed cell line derived from human epithelial keratinocytes- HACAT. Plus- and minus-strand reads are displayed in black and grey, respectively.
Figure 7:
Figure 7:. H-DNA forming repeats are hotspots for genome instability.
(A) Aggregate plot comparing the frequency of somatic single nucleotide variation (SNV) in cancer genomes from the International Cancer Genome Consortium at S1-sensitive H-motifs (shared peaks- see Figure S3) versus S1-insensitive H-motifs (annotated hPu/hPy repeats excluding peaks detected by S1 in the 5 colon cancer cell lines) relative to the center of the hPu/hPy repeats. (B) RPE-MLH1 knockout cells were plated on 10 cm plates and treated next day with 200 nM of APH for 24 hours. Cells were allowed to recover in APH free medium for two to three days. This cycle of APH treatment was repeated 20 times before picking single cell clones. Whole genome sequencing was then performed using PacBio long-read sequencing. (C) Aggregate plots comparing the frequency of somatic mutations (left), structure variation breakpoints (middle) and indels (right) at the center of S1-sensitive H-motifs versus S1-insensitive H-motifs for one of the APH pulsed clones. Analyses of two other clones are shown in Figure S6B. (D) Base substitutions profile in S1-sensitive H-motifs (top) and genome wide (bottom) in RPE-MLH1 knockout cells pulsed with APH. (E) Comparision of the fraction of large (>20 bp) deletions and insertions in S1-sensitive H-motifs, S1-insensitive H-motifs and total larger deletions and insertions (All) in RPE-MLH1 knockout cells pulsed with APH. Analyses of two other clones are shown in Figure S7A and B.

References

    1. Agazie YM, Burkholder GD, and Lee JS (1996). Triplex DNA in the nucleus: direct binding of triplex-specific antibodies and their effect on transcription, replication and cell growth. Biochem J 316 (Pt 2), 461–466. - PMC - PubMed
    1. Agazie YM, Lee JS, and Burkholder GD (1994). Characterization of a new monoclonal antibody to triplex DNA and immunofluorescent staining of mammalian chromosomes. J Biol Chem 269, 7019–7023. - PubMed
    1. Alexandrov LB, Kim J, Haradhvala NJ, Huang MN, Tian Ng AW, Wu Y, Boot A, Covington KR, Gordenin DA, Bergstrom EN, et al. (2020). The repertoire of mutational signatures in human cancer. Nature 578, 94–101. - PMC - PubMed
    1. Arlt MF, Mulle JG, Schaibley VM, Ragland RL, Durkin SG, Warren ST, and Glover TW (2009). Replication stress induces genome-wide copy number changes in human cells that resemble polymorphic and pathogenic variants. Am J Hum Genet 84, 339–350. - PMC - PubMed
    1. Belotserkovskii BP, Mirkin SM, and Hanawalt PC (2013). DNA sequences that interfere with transcription: implications for genome function and stability. Chem Rev 113, 8620–8637. - PubMed

Publication types