. 2022 Sep;24(9):1378-1393.
doi: 10.1038/s41556-022-00988-8. Epub 2022 Sep 8.

Heat-shock chaperone HSPB1 regulates cytoplasmic TDP-43 phase separation and liquid-to-gel transition

Affiliations

Heat-shock chaperone HSPB1 regulates cytoplasmic TDP-43 phase separation and liquid-to-gel transition

Shan Lu et al. Nat Cell Biol. 2022 Sep.

Abstract

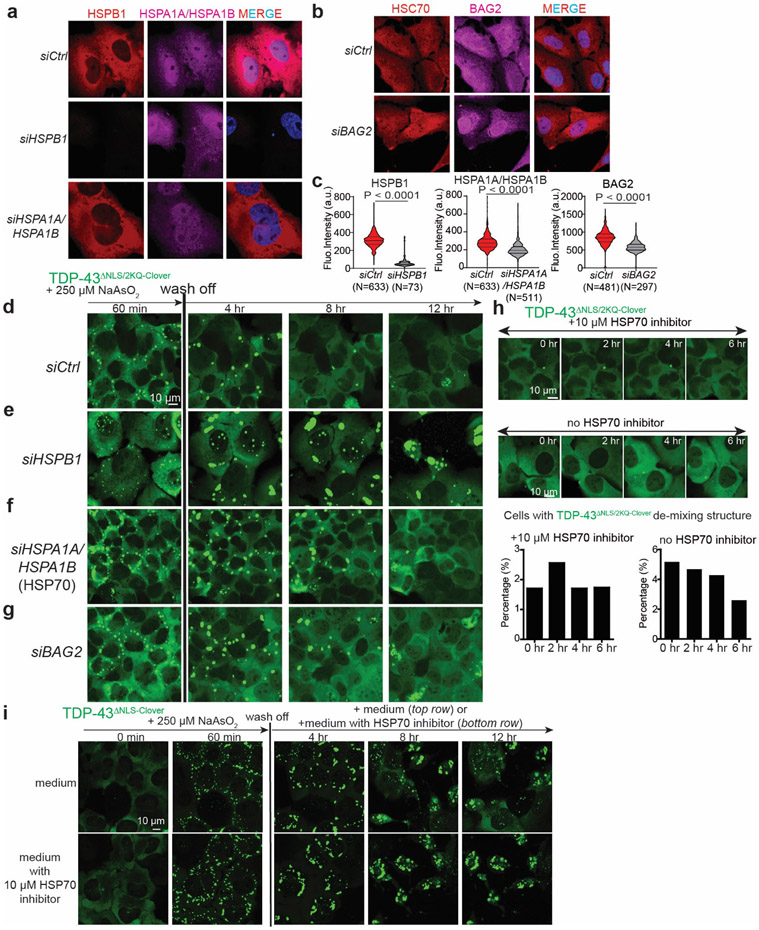
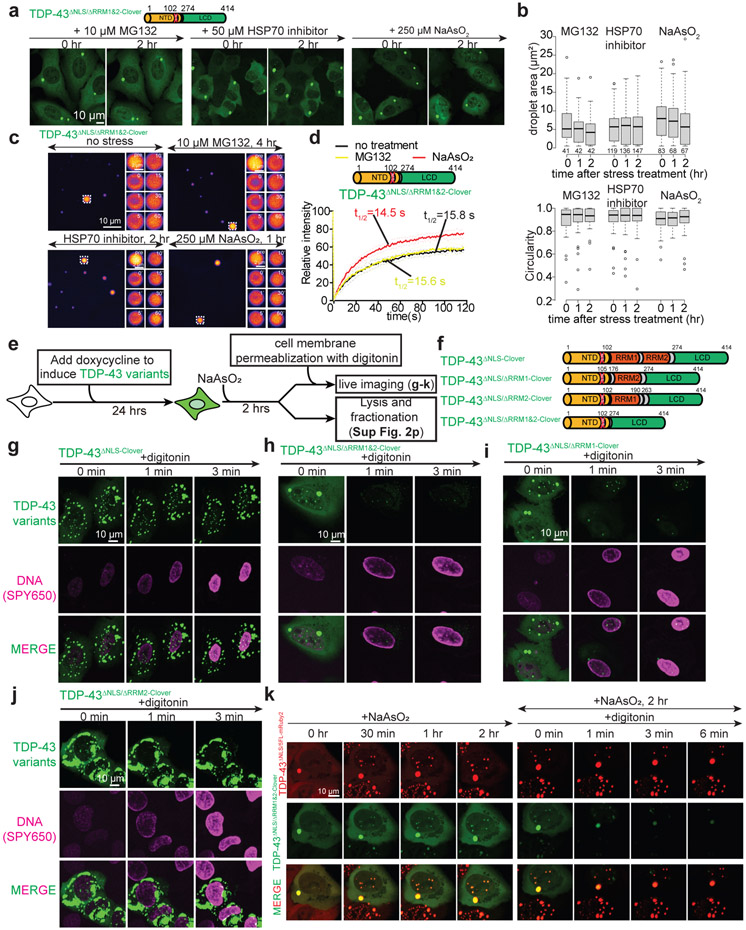
While acetylated, RNA-binding-deficient TDP-43 reversibly phase separates within nuclei into complex droplets (anisosomes) comprised of TDP-43-containing liquid outer shells and liquid centres of HSP70-family chaperones, cytoplasmic aggregates of TDP-43 are hallmarks of multiple neurodegenerative diseases, including amyotrophic lateral sclerosis (ALS). Here we show that transient oxidative stress, proteasome inhibition or inhibition of the ATP-dependent chaperone activity of HSP70 provokes reversible cytoplasmic TDP-43 de-mixing and transition from liquid to gel/solid, independently of RNA binding or stress granules. Isotope labelling mass spectrometry was used to identify that phase-separated cytoplasmic TDP-43 is bound by the small heat-shock protein HSPB1. Binding is direct, mediated through TDP-43's RNA binding and low-complexity domains. HSPB1 partitions into TDP-43 droplets, inhibits TDP-43 assembly into fibrils, and is essential for disassembly of stress-induced TDP-43 droplets. A decrease in HSPB1 promotes cytoplasmic TDP-43 de-mixing and mislocalization. HSPB1 depletion was identified in spinal motor neurons of patients with ALS containing aggregated TDP-43. These findings identify HSPB1 to be a regulator of cytoplasmic TDP-43 phase separation and aggregation.


Figures

Extended Data Fig. 1 ∣
Extended Data Fig. 1 ∣. HSP70 inhibition, proteasome inhibition, or arsenite-mediated stress induces cytoplasmic TDP-43 de-mixing independent of stress granule.
(a) Schematic of experimental design to characterize stress induced TDP-43 de-mixing droplets independent of stress granules or RNA binding. (b) Representative images of induced expression of cytoplasmic TDP-43 (TDP-43ΔNLS-Clover) for 1 day or 2 days in U2OS cells. (c) Boxplot of relative mean fluorescence intensity of diffuse TDP-43 in the U2OS cells. Number of cells quantified are 70 and 41, respectively. The cells are from one experiment. (d) Fluorescence intensity curve of recombinant TDP-43Clover at different concentration. (e) Concentration of TDP-43ΔNLS/5FL-Clover in the diffuse pool of cells with de-mixing droplets calculated based on the standard curve. Seven cells are analyzed. (f) Representative images of induction of cytoplasmic RNA binding deficient TDP-43 (TDP-43ΔNLS/2KQ-Clover) droplets by 10 μM proteasome inhibitor (MG132), 50 μM HSP70 inhibitor (VER155008) or 250 μM NaAsO2 treatment. (g) Representative images of stress granules (EIF3η) and cytoplasmic TDP-43ΔNLS-Clover or TDP-43ΔNLS/2KQ-Clover de-mixing droplets under NaAsO2, NaAsO2/cycloheximide, VER155008 or MG132 treatment. Percent of TDP-43 droplets showing no recruitment of EIF3η was labeled on the top of merged images. (h) Representative fluorescence images of TDP-43ΔNLS-Clover de-mixing droplets (green) and Poly-A RNA (oligo-dT FISH; red). Percent of TDP-43 droplets showing no enrichment of Poly-A RNA was labeled on the top of merged images. (i) Representative images of the induction of TDP-43ΔNLS/5FL-Clover (green) de-mixing droplets and stress granules (red) by live cell imaging. (j-k) Circularity of TDP-43 droplets formed after 1 hr, 2 hr, 3 hr and 4 hr of 250 μM NaAsO2 treatment. j: TDP-43ΔNLS-Clover; k: TDP-43ΔNLS/2KQ-Clover (l-m) Area of TDP-43 droplets formed after 1 hr, 2 hr, 3 hr and 4 hr of sodium arsenite treatment. l: TDP-43ΔNLS-Clover; m: TDP-43ΔNLS/2KQ-Clover. Number of droplets quantified are indicated on the figures. Images are from one live cell imaging experiment. (c,e,l,m) Medians, 25th and 75th percentiles are shown in the boxes; whiskers extend 1.5 times the interquartile range from the 25th and 75th percentiles.
Extended Data Fig. 2 ∣
Extended Data Fig. 2 ∣. Proteasome inhibition, or arsenite-mediated stress rapidly converts liquid droplets of cytoplasmic TDP-43 into gels/solids.
(a-c) Representative images of FRAP analysis of cytoplasmic TDP-43ΔNLS/5FL-Clover droplets under (a) no stress but at higher accumulated level, (b) proteasome inhibition, and (c) arsenite stress. (d) FRAP curves of cytoplasmic TDP-43ΔNLS/5FL-Clover droplets in (a-c). Light color lines, S.D.; Number of droplets analyzed in no stress, proteasome inhibition, HSP70 chaperone inhibition and arsenite stress conditions are 5, 3, 6 and 11, respectively, from three independent experiments. (e) Schematic of experimental design for TDP-43 droplet dissolution assay by mild cell permeabilization. (f-h) Representative images of U2OS cells containing TDP-43ΔNLS-Clover droplets which recruit nuclear TDP-43mRuby2 under no stress (f, h) or 2 hour of 250 μM NaAsO2 treatment (g) after permeabilization with 50 μg/mL digitonin. (i) Relative level of TDP-43 in U2OS cells that did or did not form TDP-43ΔNLS-Clover de-mixing droplets after 2 hour of 250 μM NaAsO2 treatment comparing to the endogenous TDP-43 level in naïve U2OS nucleus. N: 211, 106, 51, respectively, from an experiment. (j) Representative image of dynamical arrest of liquid TDP-43 into droplets after arsenite treatment. (k) Examples of U2OS cells that form large, elongated droplets when cytoplasmic TDP-43ΔNLS/5FL-Clover is accumulated with time. (l) Area of the droplets increased with time. N: 32, 150, 390, 488. Data are from one live cell imaging experiment. (m) Circularity of the droplets in different sizes. N: 244, 158, 28, 15, 13, 11. Data are from an experiment. (n) FRAP of small and big TDP-43 droplets. FRAP curve are from three big droplets formed after three days of expression. (o) Circularity of RRM-del TDP-43 droplets were not changed by size of the droplets. Numbers quantified are indicated in the figure. Data are from an experiment (p) Solubility of TDP-43 variants after arsenite-induced phase separation. Fluorescence images of TDP-43 variants in lysates from U2OS cells treated with 250 μM sodium arsenite and lysed with RIPA buffer. Western blot of the solution and insoluble fractions. Images were taken at 10 frames with similar results in two independent experiments. (l,m,o) Medians, 25th and 75th percentiles are shown in the boxes; whiskers extend 1.5 times the interquartile range from the 25th and 75th percentiles.
Extended Data Fig. 3 ∣
Extended Data Fig. 3 ∣. Proximity labelling of cytoplasmic TDP-43 de-mixing structures and verification of HSPB1 partition into cytoplasmic TDP-43 de-mixing structures in iPSC-cortical and motor neurons.
(a) Representative images of proximity labeling by cytoplasmic TDP-43ΔNLS-Clover-APEX2 in diffuse (no stress) and de-mixed state (sodium arsenite, MG132). Images represents 10 independent images taken for each condition. (b) Representative images of proximity labeling by Clover-APEX2NES under no stress, sodium arsenite and MG132 treatment conditions. Images represents 10 independent images taken for each condition. (c) Volcano plots of statistical significance against fold-change (TDP-43ΔNLS-Clover-APEX v.s. Clover-APEX2NES) of each protein under no stress, sodium arsenite and MG132 treatment conditions. P-value is calculated by one-sample t-test. (d) Representative immunofluorescence images of HSPB1 enriched in cytoplasmic TDP-43ΔNLS-Clover droplets induced by sodium arsenite. Images represents 10 independent images taken for each condition. (e) Representative immunofluorescence images of HSPB1 enriched in cytoplasmic TDP-43ΔNLS/2KQ-Clover droplets in iPSC-derived cortical neurons and motor neurons. Images represents 5 independent images taken for each condition.
Extended Data Fig. 4 ∣
Extended Data Fig. 4 ∣. HSPB1 inhibits TDP-43 phase separation at higher molecular ratio.
(a) SDS-PAGE analysis of all TDP-43 variants and HSPB1 variants used for in vitro phase separation assay and NMR analysis in figure 4 and supplementary figure 4, 5. Images represent analysis from three independent runs. (b) SDS-PAGE analysis of TDP-43 and HSPB1 phase separation samples after adding TEV protease to cleave MBP tag off. Images represent analysis from three independent runs. (c) Fluorescence images of in vitro phase separated droplets of untagged TDP-43 (2% NHS-Alexa488 labeled) and HSPB1 (2% NHS-Alexa555 labeled). (d) DIC images of mixtures of TDP-43 and HSPB1 at different concentrations. (e) Measurement of the size of de-mixed droplets in different conditions. Data of over 20 droplets from three independent experiments are presented as mean values ± SD. *** p<0.001 one-way ANOVA analysis. (f) Phase diagram of TDP-43 in (e). The size of dots represents the size of droplets formed at that condition.
Extended Data Fig. 5 ∣
Extended Data Fig. 5 ∣. HSPB1 binds to TDP-43 LCD through the conserved transient α-helix region (320-340 aa) and binds to RRM1 domain.
(a) Fluorescence images of in vitro phase separated TDP-43 (2% NHS-Alexa488 labeled) droplets with or without phosphor-mimetic HSPB13SD (2% NHS-Alexa555 labeled). Phase separation of 50 μM TDP-43-MBP was conducted by adding 7.5% dextran with or without 10 μM HSPB13SD. (b) Fluorescence images of in vitro phase separated TDP-43 LCD (50 μM, 2% NHS-Alexa488 labeled) droplets with or without HSPB13SD (50 μM, 2% NHS-Alexa555 labeled). (c) Thioflavin T aggregation assay to monitor the TDP-43 LCD (10 μM) amyloid assembly over time in the presence or absence of HSPB13SD at different molecular ratios. Data are collected from three biological replicates. Data are presented as mean values ± SD. (d) The 2D 1H15N HSQC spectra of 15N-labeled TDP-43 LCD titrated with increasing concentrations of HSPB1 (left). The representative residues that are markedly attenuated by HSPB1 titration are shown in right panel. (e-f) Profiles of the intensity changes (top) and chemical shift perturbations (bottom) of 20 μM 15N-labeled TDP-43 LCD in the presence of 20 (e) and 10 μM (f) HSPB13D, respectively. (g) Intensity changes of signals in the 2D 1H15N HSQC spectra of 20 μM 15N-labeled TDP-43 LCDA326P with 20 μM or 10 μM HSPB1. Data represents analysis from three independent runs. (h-i) Representative fluorescence images of (h) TDP-43ΔNLS/ΔRRM1-Clover (green) and (i) TDP-43ΔNLS/ΔRRM2-Clover (green) and HSPB1 (red) in U2OS cells. Images represent 10 independent images for each condition. (j) Immunoprecipitation of HSPB1 by full-length TDP-43 and RRM1-containing variant TDP-43ΔNLS/ΔRRM2-Clover but not RRM1-deletion variant TDP-43ΔNLS/ΔRRM1-Clover.
Extended Data Fig. 6 ∣
Extended Data Fig. 6 ∣. HSPB1, HSP70/HSC70 and BAG2 are partitioned into the sodium arsenite-induced TDP-43 gels/solids.
(a) Live imaging of TDP-43ΔNLS-Clover and HSPB1mCherry in U2OS cells treated by NaAsO2. (b-j) Immunofluorescence images of TDP-43ΔNLS-Clover and (b) HSPB1, (c) HSP70/HSC70, (d) BAG2, (e) HSPB8, (f) HSPH1, (g) BAG3, (h) DNAJA1, (i) DNAJB1 and (j) BAG1 in U2OS cells treated with sodium arsenite for 80 min or 120 min. Images represent 10 independent images for each condition. (k) Summary of the result in (b-j).
Extended Data Fig. 7 ∣
Extended Data Fig. 7 ∣. Reduction in HSPB1, HSPA1A, BAG2 or mild inhibition of HSP70 activity inhibits or delays the disassembly of cytoplasmic TDP-43 de-mixed droplets.
(a) Immunofluorescence images of HSPB1 and HSP70 in U2OS cells transfected with control siRNA, siHSPB1 or siHSPA1A. (b) Immunofluorescence images of BAG2 in U2OS cells transfected with control siRNA, siBAG2. (c) Quantification of fluorescence intensity of HSPB1, HSP70 and BAG2 in cells transfected with control siRNA, siHSPB1, siHSPA1A or siBAG2. Number of cells for quantification are indicated in the figure (633, 73, 633, 511, 481, 297, respectively). Images are from one experiment. P < 0.0001 (student t-test, two-tailed). Medians, 25th and 75th percentiles are labeled as lines in the plots. (d-g) Time lapse images of the disassembly of cytoplasmic TDP-43ΔNLS/2KQ-Clover de-mixing droplets in U2OS cells transfected with (d) control siRNA, (e) siHSPB1, (f) siHSPA1A, (g) siBAG2. (h) Time lapse images of TDP-43ΔNLS/2KQ-Clover in U2OS cells after 10 μM VER155008 treatment. Quantification of U2OS cells containing cytoplasmic TDP-43ΔNLS/2KQ-Clover de-mixing droplets after 10 μM VER155008 treatment. The number of cells for quantification is 117. (i) Time lapse images of the disassembly of cytoplasmic TDP-43ΔNLS-Clover de-mixing droplets in U2OS cells after washing off sodium arsenite with or without 10 μM VER155008 in the medium.
Extended Data Fig. 8 ∣
Extended Data Fig. 8 ∣. Reduction in HSC70/HSPA8 induces the expression of the HSP70 family member HSPA1A, inhibits the arsenite-induced de-mixing of cytoplasmic TDP-43, and promotes droplet/gel disassembly.
(a) Immunofluorescence images of HSC70 (HSPA8) and HSP70 (HSPA1A/HSPA1B) in U2OS cells transfected with control siRNA, siHSPA8, siHSPA1A or co-transfected with siHSPA8 and siHSPA1A. (b-c) Quantification of fluorescence intensity of (b) HSP70 and (c) HSC70 in (a). Each dot represents a single cell and orange lines represent mean value and standard error (S.E.M.) of fluorescence intensity. The number of cells quantified are 407, 261, 220 and 149, respectively. Images are taken from one experiment. (d-e) Time lapse imaging of TDP-43ΔNLS-Clover de-mixing droplets induction by arsenite stress and disassembly after removal of sodium arsenite in cells transfected with (d) siHSPA8 or (e) control siRNA. (f) Quantification of U2OS cells containing cytoplasmic TDP-43ΔNLS/2KQ-Clover de-mixing droplets after arsenite treatment (left) and quantification of U2OS cells that have TDP-43 de-mixing droplets disassembled after stress removal (right) in (d-e). Cells are quantified from four independent replicates. N: 346, 425, 309, 354 for siRNA control group; 86,88, 86, 69 for siHSPA8 group. (g) Fluorescence intensity of TDP-43ΔNLS-Clover in U2OS cells transfected with siRNA control or siHSPA8 (up) and percentage of TDP-43ΔNLS-Clover in de-mixing droplets (bottom). ***P < 0.0001, n.s. P=0.2159 (student t-test, two-tailed). Data are presented as mean values ± SEM. Number of cells quantified in siRNA control group are 42 and in siHSPA8 group are 39. Cells are pooled from four independent experiments. (h) Time lapse images of TDP-43ΔNLS/2KQ-Clover expressing U2OS cells transfected with siHSPA8 after sodium arsenite treatment and wash-off. (i) Representative images of U2OS cells expressing TDP-43ΔNLS-Clover together with HSPA1AmRuby2 or HSPA8mRuby2 after 2 hour of sodium arsenite treatment. Images represent 10 independent images.
Extended Data Fig. 9 ∣
Extended Data Fig. 9 ∣. enhanced recruitment of HSP70 and its co-chaperones DNAJB1 and BAG3 to phase separated cytoplasmic TDP-43 droplets after stress removal and assembled microtubule array is required for disassembly of TDP-43 droplets
(a) Fluorescence images of TDP-43ΔNLS-Clover (green) with BAG3 (red), HSP70/HSC70 (red), DNAJB1 (red), and DNAJA1 (red), respectively, in U2OS cells treated with sodium arsenite for 1 hour followed by 4-hour wash-off. Images represent 10 independent images for each condition. (b-c) Microtubule disassembly by nocodazole treatment. Microtubule structures are imaged by sir-Tubulin dye. (d) Schematic design of testing if microtubule disassembly affects TDP-43 droplets fuse/aggregate/coalesce. (e) Microtubule disassembly does not strongly affect TDP-43 droplet fusion/aggregation but affect the resolution of the droplets.
Extended Data Fig. 10 ∣
Extended Data Fig. 10 ∣. Reduction in HSPB1 induces cytoplasmic TDP-43 de-mixing and mislocalization.
(a) Experimental design for testing the effect of HSPB1 depletion on cytoplasmic TDP-43 de-mixing in cell cycle arrested U2OS cells. (b) DNA content analysis by FACS. U2OS cells are treated by reduced serum medium and 1 μM G1 cell cycle blocker palbociclib to block cell cycle. Line is drawn to separate 2-N and 4-N cells based on FACS plot of cell population. (c) Fluorescence images of TDP-43ΔNLS/5FL-Clover (upper), TDP-43ΔNLS-Clover (medium) and Clover (bottom) in cell cycle arrested U2OS cells transfected with siRNA control or siHSPB1 after induction with doxycycline for 1 day or 2 days. (d) Quantification of the percentage of cells forming cytoplasmic TDP-43 de-mixing droplets in (c). Numbers of cells quantified are 4108, 3632, 3897 (TDP-43ΔNLS/5FL-Clover, siRNA control, 1 day) and 2901, 2978, 2897 (TDP-43ΔNLS/5FL-Clover, siRNA control, 2 day), 4035, 3788, 3673 (TDP-43ΔNLS/5FL-Clover, siHSPB1, 1 day) and 3663, 3266, 3278 (TDP-43ΔNLS/5FL-Clover, siHSPB1, 2 day), 4203, 4399, 4272 (TDP-43ΔNLS-Clover, siRNA control, 1 day) and 3777, 3957, 3709 (TDP-43ΔNLS-Clover, siRNA control, 2 day), 3913, 3803, 3829 (TDP-43ΔNLS-Clover, siHSPB1, 1 day) and 3469, 3358, 3345 (TDP-43ΔNLS-Clover, siHSPB1, 2 day). Data are presented as mean values ± SD. Each data are from three independent experiments. (e) Fluorescence images of endogenous TDP-43 and HSPB1 in U2OS cells transfected with siRNA control or siHSPB1 and quantification of cytoplasmic/nuclear fluorescence intensity of TDP-43 in cells expressing different levels of HSPB1. The number of cells for plotting are 114, 883, 519 and 292, respectively. <200 group V.S. 200-400 group, n.s. P = 0.2878; <200 group V.S. 400-600 group, **P = 0.0005; <200 group V.S. >600 group, **P=0.027; 200-400 group V.S. 400-600 group, ***P < 0.0001; 200-400 group V.S. >600 group, ***P = 0.0001 (unpaired student t-test, two-tailed). Images are pooled from two independent experiments. (f) Fluorescence images of endogenous TDP-43 and HSPB1 in U2OS cells transfected with control siRNA or siHSPB1 and quantification of cells forming cytoplasmic de-mixing TDP-43 droplets. The number of quantified cells for control siRNA is 586 and the number of cells for siHSPB1 is 175. Data are from an experiment.
Figure 1.
Figure 1.. Cytoplasmic TDP-43 phase separation and liquid to gel/solid transition are induced by oxidative stress, or reduction in proteasome activity.
(a) Schematic of the design to assess the effects of different stresses on cytoplasmic TDP-43. (b) Representative images of induced expression of cytoplasmic TDP-43 (TDP-43ΔNLS-Clover) for 1 day or 2 days in U2OS cells. (c-e) Representative live cell images of cytoplasmic RNA binding proficient TDP-43 (TDP-43ΔNLS-Clover) or RNA binding incompetent TDP-43 (TDP-43ΔNLS/2KQ-Clover) de-mixing structures induced by reduction of proteasome activity (MG132) (c), inhibition of HSP70 protein folding chaperone activity (VER155008) (d), or arsenite stress (NaAsO2) (e). (f) Quantification of the percentage of cells with TDP-43 de-mixing structures. Cells quantified for each condition from left to right in the bar graph are: 381, 372, 460, 507, 427, 420, respectively, for the top panel; 342, 225, 289, 281, 337, 350, respectively, for the bottom panel. Data are from a live cell imaging experiment.(g-i) Representative examples of FRAP analysis of cytoplasmic TDP-43ΔNLS-Clover droplets under (g) no stress but at higher accumulated level, (h) proteasome inhibition, (i) arsenite stress. (j) FRAP curve of TDP-43ΔNLS-Clover droplets under no stress, proteasome inhibition, or arsenite stress condition. Light color lines were plotted for standard deviation. Number of droplets that were bleached in no stress, proteasome inhibition, HSP70 chaperone inhibition and arsenite stress conditions are: 8, 9, 14 and 8. (k) Representative live images of U2OS cells expressing TDP-43ΔNLS-Clover or TDP-43ΔNLS/2KQ-Clover after treatment with sodium arsenite for increasing times. (l) Relative level of TDP-43ΔNLS-Clover or TDP-43ΔNLS/2KQ-Clover in the diffuse pool of cells before or after exposure to sodium arsenite for 1 hr or 2 hr. Number of cells quantified are 20 and 26, respectively. Cells analyzed are from one live cell image experiment. (m) Level of TDP-43ΔNLS-Clover in the diffuse pool of cells with de-mixed TDP-43 droplets or in cells without de-mixed droplets, or after exposure to sodium arsenite for 1 hr or 2 hr. Number of cells quantified are 20, 71, 21 and 21 in each group from left to right, respectively. (n) Ultrastructural analysis of cytoplasmic TDP-43 de-mixing droplets delineated by correlative light and electron microscopy. U2OS cells expressing TDP-43ΔNLS-Clover were treated with sodium arsenite for 60 min before fixation. (I, m): Medians, 25th and 75th percentiles are shown in the box; whiskers extend 1.5 times the interquartile range from the 25th and 75th percentiles.
Figure 2.
Figure 2.. Slow depletion of nuclear TDP-43 by cytoplasmic TDP-43 phase separation is enhanced by stress-induced liquid to gel/solid transition.
(a) Experimental design to check if cytoplasmic TDP-43 de-mixing could sequester nuclear TDP-43 in cell cycle arrested U2OS cells. (b) Representative images of G1/G0 arrested U2OS cells that stably express wildtype TDP-43mRuby2 being induced to express cytoplasmic TDP-43ΔNLS-Clover for 0, 16, 24, and 40 hours. (c) Representative images of U2OS cells that stably express wildtype TDP-43mRuby2 being induced to express cytoplasmic TDP-43ΔNLS-Clover for 0, 10, 24 hours followed by another 4-hour treatment with 25 μM sodium arsenite. (d) Cytoplasmic to nuclear ratio of TDP-43mRuby2 (total fluorescence intensity) in U2OS cells without cytoplasmic TDP-43ΔNLS-Clover, with 24 hour induced cytoplasmic TDP-43ΔNLS-Clover, or with 24 hour induced cytoplasmic TDP-43ΔNLS-Clover and treated with 25 μM sodium arsenite for 8 hours. Number of cells quantified are 40, 55 and 41, respectively. Data are from two independent live cell imaging experiments. ***P < 0.001 (student t-test, two-tailed). Data are plotted as mean values ± SD. (e-f) Representative fluorescence images of TDP-43mRuby2, TDP-43ΔNLS-Clover and G3BP1 in G1/G0 arrested U2OS cells in the absence (e) or presence (f) of sodium arsenite. (g) Quantification of cells that have stress granule independent TDP-43 droplets in (e) and (f). Cell number for no arsenite group is 77 and for 25 μM arsenite group is 52. Cells are pooled from two independent experiments.
Figure 3.
Figure 3.. RNA binding domains, especially RRM1 is crucial for gelation of TDP-43 droplets.
(a) Representative images of no induction of cytoplasmic RRM-deleted TDP-43ΔNLS/ΔRRM1&2-Clover droplets by proteasome inhibition, HSP70 inhibition or sodium arsenite treatment. (b) Boxplot of area and roundedness of TDPΔNLS/ΔRRM1&2-Clover droplets at 0, 1, 2 hour of 10 μM MG132, 50 μM HSP70 inhibitor or 250 μM sodium arsenite treatment. Number of droplets quantified for each group are 41, 42, 42 for 0, 1, 2 hr of MG132 treatment; 119, 136, 147 for 0, 1, 2 hr of HSP70 inhibitor treatment; 83, 68, 67 for 0, 1, 2 hr of sodium arsenite treatment. Data are from one experiment. (c) Representative images of FRAP analysis of cytoplasmic TDP-43ΔNLS/ΔRRM1&2-Clover droplets under no stress but at higher accumulated level, proteasome inhibition, HSP70 chaperone inhibition and arsenite stress conditions. (d) FRAP curve of TDP-43ΔNLS/ΔRRM1&2-Clover under no stress, proteasome inhibition, HSP70 chaperone inhibition and arsenite stress condition with numbers of droplets of 8, 8, 16 and 9, respectively. Light color lines were plotted for standard deviation. (e) Schematic of experimental design for testing the properties of TDP-43 droplets by cell membrane permeabilization with 50 μg/mL digitonin treatment. (f) Schematic of the TDP-43 variants constructs. (g-j) Representative images of arsenite-stressed U2OS cells containing droplets of TDP-43 variants after cell membrane permeabilization with 50 μg/mL digitonin. Images represent 6 independent frames for each condition. (k) Cells co-expressing full-length RNA binding deficient TDP-43ΔNLS/5FL-mRuby2 and RRM-deleted TDP-43ΔNLS/ΔRRM1&2-Clover were treated with sodium arsenite and their plasma membranes then permeabilized by addition of digitonin. Images represent 6 independent frames. (b) Medians, 25th and 75th percentiles are shown in the box; whiskers extend 1.5 times the interquartile range from the 25th and 75th percentiles.
Figure 4.
Figure 4.. The combination of APEX proximity labeling, quantitative mass spectrometry using isotopically labeled tandem mass tags (TMTs), co-expression and immunofluorescence identifies the small heat shock protein HSPB1 to bind cytoplasmic TDP-43 and to de-mix with it into droplets/gels after arsenite stress.
(a) Experiment design of the proximity labeling and TMT quantitative mass spectrometry. Cells inducibly expressing TDP-43ΔNLS-Clover-APEX and APEX2Clover-NES were treated with sodium arsenite for 2 hr or MG132 for four hours before proximity labeling, streptavidin enrichment and TMT labeling for quantitative mass spectrometry analysis. (b) Venn diagram of the proteins that show more than two-fold difference in TDP-43ΔNLS-Clover-APEX labeling comparing to APEX2Clover-NES under arsenite stress or no stress. (c) Volcano plot of statistical significance against fold-change (arsenite v.s. no stress) of each protein labeled by TDP-43ΔNLS-Clover-APEX. Unadjusted P-value is calculated by one-sample t-test, two-sided. (d) Colocalization of TDP-43ΔNLS-Clover and HSPB1mCherry in arsenite-induced de-mixing droplets detected by direct fluorescence signal. Experiments were repeated for three times. (e) Representative fluorescence images of TDP-43 and HSPB1 co-de-mixed droplets and stress granules (indicated by G3BP1 staining). Number of granules for quantification are 370, 631, 449, respectively. Data are plotted as mean values ± SD. Granules are quantified in three independent images from two independent replicates. (f) Representative examples of FRAP analyses of TDP-43ΔNLS-Clover and HSPB1mCherry in co-de-mixed droplets. Dotted circles label the regions that are bleached. (g) Mean relative fluorescence intensity of TDP-43ΔNLS-Clover and HSPB1mCherry over time in FRAP experiments. Number of droplets bleached are 8. Data are from three independent bleaching experiments.
Figure 5.
Figure 5.. HSPB1 de-mixes in vitro into liquid droplets of full length TDP-43, the TDP-43 LCD alone, or TDP-43 without its LCD and acts to inhibit TDP-43 LCD assembly into amyloid fibrils.
(a) Schematic of TDP-43 variants and HSPB1 that are used for in vitro phase separation assay. ATD, α-crystallin domain; and CTD, C-terminal domain. (b) Fluorescence images of in vitro phase separated TDP-43 (2% NHS-Alexa488 labeled) droplets with/without HSPB1 (2% NHS-Alexa555 labeled). Phase separation of 50 μM TDP-43-MBP was conducted by adding 7.5% dextran with/without 10 μM HSPB1. (c) Representative examples of FRAP analysis of in vitro phase separated TDP-43 droplets with/without HSPB1 at initial timepoint or after 2 hours. (d) FRAP curve of relative TDP-43 intensity of in vitro phase separated TDP-43 droplets with/without HSPB1 at initial timepoint or after 2 hours. Number of droplets that are bleached is 6 for each group. Data are plotted as mean values ± SD. (e) Fluorescence images of in vitro phase separated TDP-43 LCD (50 μM, 2% NHS-Alexa488 labeled) droplets with/without HSPB1 (50 μM, 2% NHS-Alexa555 labeled). (f) Fluorescence images of in vitro phase separated TDP-43 ΔLCD (50 μM, 2% NHS-Alexa647 labeled) droplets with/without HSPB1 (50 μM, 2% NHS-Alexa555 labeled). (g) Thioflavin T aggregation assay to monitor the TDP-43 LCD (10 μM) amyloid assembly over time in the presence or absence of 2 μM or 10 μM HSPB1. Data are plotted as mean values ± SEM. (h) Negative stain electron microscopy images of TDP-43 LCD assemblies at the end point of Thioflavin T aggregation assay. Similar images were taken from three independent experiments.
Figure 6.
Figure 6.. Activities of HSPB1, HSP70, and BAG2 [the nucleotide exchange factor for HSPA1A (HSP70) are essential for disassembly of stress-induced de-mixing and aggregation of TDP-43.
(a) Schematic of experimental design for measuring the disassembly of TDP-43 de-mixing droplets after removal of stress. (b-e) Representative live images of TDP-43ΔNLS-Clover de-mixing droplets induced by arsenite for 1 hour followed by removal of stress. (f) Quantification of cells forming TDP-43 de-mixing droplets in (b-e) after one hour of sodium arsenite treatment. (g) Quantification of cells in which TDP-43 de-mixing droplets disassemble after 12-hr stress removal in (b-e). For f, g: **P < 0.01, ***P < 0.001 (student t-test, two-tailed). For f,g: number of cells quantified in four independent experiments are 346, 425, 309, 354 for siRNA control; 40, 50, 23, 68 for siHSPB1; 283, 248, 100, 144 for siHSPA1A; 72, 145, 68, 86 for siBAG2, respectively. (h-i) Quantification of the relative level of HSPB1 in U2OS cells transduced with HSPB1-IRES-tdTomato lentivirus to stably increase level of HSPB1 compared to un-transduced cells. Medians, 25th and 75th percentiles are shown in the box; whiskers extend 1.5 times the interquartile range from the 25th and 75th percentiles. (j) Representative live images of the disassembly of TDP-43ΔNLS-Clover de-mixing droplets after stress removal in the cells transduced with HSPB1-IRES-tdTomato. (k) Quantification of cells forming TDP-43 de-mixing droplets and cells that disassemble TDP-43 de-mixing droplets after 12-hr stress removal. Data are from three independent replicates; 114, 145 and 109 non-transduced controls, and 123, 161 and 157 HSPB1-IRES-tdTomato-transduced cells were analyzed.
Figure 7.
Figure 7.. HSPB1 is highly expressed in normal motor neurons (but not astrocytes or oligodendrocytes) but accumulation of it is sharply decreased in spinal motor neurons with TDP-43 pathology in ALS patients.
(a) Levels of HSPB1 mRNA in motor neurons, astrocytes and oligodendrocytes from spinal cords of BacTrap mice. Data are plotted as mean values ± SD. (b) mRNA levels of chaperones including all the members of HSP70, HSP90, DNAJ, NEFs and small heat shock proteins in motor neurons from spinal cords of BacTrap mice. (c) Levels of HSPB1 mRNA in different types of cells in spinal cord from a single nucleus RNA-seq transcriptome. (d-e) Representative immunofluorescence images of HSPB1 and TDP-43 in control (d) and sporadic ALS patients (e). (f) Representative images of motor neurons with different levels (high, medium or low) of HSPB1, and with different localization of TDP-43 (nuclear, partially cytoplasmic or cytoplasmic). (g) Quantification of TDP-43 localization in motor neurons of control and ALS patients. Data are plotted as mean values ± SD. (h) Quantification of HSPB1 expression levels in motor neurons of control and ALS patients. Data are plotted as mean values ± SD. (i) Quantification of HSPB1 expression levels in motor neurons with nuclear TDP-43 and motor neurons with cytoplasmic TDP-43 in ALS patients. Data are for three control individuals and four patients with ALS. For g-i: the number of motor neurons characterized in control patients are 35, 76, and 59, respectively. The number of motor neurons in ALS patients are 65, 77, 99 and 257, respectively (seen in Source Data Fig. 7).
Figure 8.
Figure 8.. TDP-43 de-mixing and cytoplasmic mis-localization when HSPB1 level is depleted.
(a) Schematic of the experimental design for assessing the effects of decreasing HSPB1 on cytoplasmic TDP-43 de-mixing. (b) Representative fluorescence images of cells expressing TDP-43ΔNLS/5FL-Clover transfected with control siRNA or siHSPB1. Quantification of the cells with TDP-43ΔNLS/5FL-Clover de-mixing droplets after transfection with control siRNA (N=98) or siHSPB1 (N=88). (c) Representative images of cells expressing TDP-43Clover-APEX2 with and without HSPB1 knockdown detected by immunostaining of HSPB1. (d) Violin plot of the cytoplasmic/nuclear TDP-43Clover-APEX2 intensity ratio of the cells transfected with siHSPB1 or siRNA control. Number of cells quantified are 488 and 1648 for siHSPB1 and siRNA control, respectively. ***P < 0.001 (student t-test, two-tailed). (e) Representative images of FUS and HnRNPU localization in cells transfected with siRNA control or siHSPB1. Images were taken from more than 10 frames with cells showing similar phenotype. (f) Representative images of RanGAP1 localization in U2OS cells transfected with siHSPB1 and control, respectively, and quantification of the cells with RanGAP1 mis-localization. Number of cells quantified in three independent replicate experiments for the siHSPB1 group are 272, 442 and 378, respectively, and 226, 223 and 384 in the siRNA control group. *P=0.0138 (student t-test, two-tailed). Data are plotted as mean values ± SD. (g) Model of HSPB1 regulation of TDP-43 phase separation and the disassembly of TDP-43 de-mixing droplets. HSPB1 maintains the liquid-like state of cytoplasmic TDP-43 and facilitates the ATP-dependent HSP70 complex-mediated disassembly of cytoplasmic TDP-43 de-mixing structures induced by proteomic stress after stress removal. When HSPB1 is depleted like what happens in the motor neurons of patients with ALS, cytoplasmic TDP-43 de-mixing is promoted and disassembly of cytoplasmic TDP-43 de-mixing structures is inhibited, which causes nuclear TDP-43 depletion.

Comment in

  • Finding a chaperone for TDP-43.
    Ayala YM, Grese ZR. Ayala YM, et al. Nat Cell Biol. 2022 Sep;24(9):1328-1330. doi: 10.1038/s41556-022-00987-9. Nat Cell Biol. 2022. PMID: 36075973 No abstract available.

References

    1. Ling S-C, Polymenidou M & Cleveland DW Converging mechanisms in ALS and FTD: disrupted RNA and protein homeostasis. Neuron 79, 416–438 (2013). - PMC - PubMed
    1. Neumann M et al. Ubiquitinated TDP-43 in frontotemporal lobar degeneration and amyotrophic lateral sclerosis. Science 314, 130–133 (2006). - PubMed
    1. Neumann M et al. Absence of heterogeneous nuclear ribonucleoproteins and survival motor neuron protein in TDP-43 positive inclusions in frontotemporal lobar degeneration. Acta neuropathologica 113, 543–548 (2007). - PubMed
    1. Josephs KA et al. TDP-43 is a key player in the clinical features associated with Alzheimer’s disease. Acta neuropathologica 127, 811–824 (2014). - PMC - PubMed
    1. Nelson PT et al. Limbic-predominant age-related TDP-43 encephalopathy (LATE): consensus working group report. Brain 142, 1503–1527 (2019). - PMC - PubMed

Method-only References

    1. Fernandopulle MS et al. Transcription Factor-Mediated Differentiation of Human iPSCs into Neurons. Curr Protoc Cell Biol 79, e51 (2018). - PMC - PubMed
    1. McAlister GC et al. MultiNotch MS3 Enables Accurate, Sensitive, and Multiplexed Detection of Differential Expression across Cancer Cell Line Proteomes. Analytical Chemistry 86, 7150–7158 (2014). - PMC - PubMed
    1. He L, Diedrich J, Chu YY & Yates JR 3rd Extracting Accurate Precursor Information for Tandem Mass Spectra by RawConverter. Anal Chem 87, 11361–11367 (2015). - PMC - PubMed
    1. Xu T et al. ProLuCID: An improved SEQUEST-like algorithm with enhanced sensitivity and specificity. J Proteomics 129, 16–24 (2015). - PMC - PubMed
    1. Tabb DL, McDonald WH & Yates JR 3rd DTASelect and Contrast: tools for assembling and comparing protein identifications from shotgun proteomics. J Proteome Res 1, 21–26 (2002). - PMC - PubMed

Publication types

MeSH terms