. 2022 Oct;19(10):1268-1275.
doi: 10.1038/s41592-022-01588-y. Epub 2022 Sep 8.

Event-triggered STED imaging

Affiliations

Event-triggered STED imaging

Jonatan Alvelid et al. Nat Methods. 2022 Oct.

Abstract

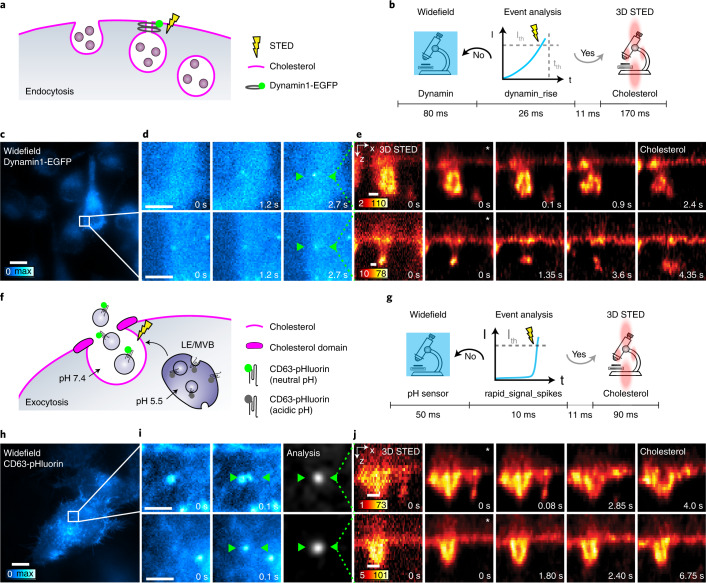
Monitoring the proteins and lipids that mediate all cellular processes requires imaging methods with increased spatial and temporal resolution. STED (stimulated emission depletion) nanoscopy enables fast imaging of nanoscale structures in living cells but is limited by photobleaching. Here, we present event-triggered STED, an automated multiscale method capable of rapidly initiating two-dimensional (2D) and 3D STED imaging after detecting cellular events such as protein recruitment, vesicle trafficking and second messengers activity using biosensors. STED is applied in the vicinity of detected events to maximize the temporal resolution. We imaged synaptic vesicle dynamics at up to 24 Hz, 40 ms after local calcium activity; endocytosis and exocytosis events at up to 11 Hz, 40 ms after local protein recruitment or pH changes; and the interaction between endosomal vesicles at up to 3 Hz, 70 ms after approaching one another. Event-triggered STED extends the capabilities of live nanoscale imaging, enabling novel biological observations in real time.


Conflict of interest statement

The authors declare no competing interests.

Figures

Fig. 1
Fig. 1. Overview of event-triggered STED imaging.
a, Scheme of an etSTED experiment on a temporal axis with widefield calcium imaging of Oregon Green 488 BAPTA-1 in neurons in 20 ms (blue, top left images); corresponding analyzed images upon real-time application of an analysis pipeline in 10 ms (light gray, bottom images); switch of imaging modalities upon a detected event in 11 ms (dark gray); and a triggered locally scanned STED timelapse at the location of the detected event (red, top right image stack). Small green boxes indicate the chosen detected event that triggers STED imaging. b, Schematic diagram of the microscope set-up, combining STED and widefield imaging with real-time analysis, coordinate transformation and live visual feedback in a control widget implemented in the microscope control software.
Fig. 2
Fig. 2. Neuronal functional and structural imaging with etSTED.
a, Mean Oregon Green 488 BAPTA-1 widefield image from a 10 s timelapse. Boxes indicate detected events (green, true; magenta, false). n = 25 events. b, Extracted calcium curves at detected events (left), manually annotated events (center), and random positions inside the neuron (right). Fluorescence intensity dF/F0 = (F(t)−F(t0))/F(t0). c, Characterization of true-positive event detection ratio (True) and detected annotated event ratio (Det). n = 8 cells. d, Representative etSTED experiment. e, etSTED performance with the analysis pipeline rapid_signal_spikes. n = 90 events, n = 11 cells. f, Synaptic vesicle dynamics upon calcium signaling. g, Experiment timeline for one widefield frame. hj, etSTED experiment with calcium signal-triggered STED imaging of synaptotagmin-1_STAR635P. h, Maximum-projected analysis image. Green boxes indicate detected events. i, Zoom-ins of the ratiometric image at the location of two detected events. Green boxes indicate the STED scan area. j, 2.5 Hz etSTED timelapses. White outlines indicate the detected local calcium activity area. Arrows indicate points of structural reorganization. k, Synaptic vesicle cluster analysis. AR, aspect ratio. l, Event detection ratios, compared with the number of true events, for number of events, local or neurite-wide calcium events, and timelapses with synaptotagmin-1-positive vesicles (Syt-1+) and vesicle clusters. n = 186 events, n = 17 cells. m,n, Analysis of synaptic vesicle clusters in calcium-triggered etSTED (red) and manual STED (black) timelapses: MSD with Δt = 1 frame (m, left), cluster area (m, center) and aspect ratio (m, right), and time-dependent MSD (n). m, The statistical test used is a two-sample two-sided Kolmogorov–Smirnov test: P = 0.018, test statistic = 0.48. n, Individual clusters (semi-transparent curves), mean curves (solid lines), and 83% confidence intervals (shaded areas). red: n = 26 clusters, n = 10 cells; black: n = 14 clusters, n = 14 cells. Box plots (c,m) show the 25–75% interquartile range, with the middle line representing the mean, and the whiskers reaching 1.5-fold the first and third quartiles. Bar plots (e,l) show the mean, and the whiskers reach ±1 s.d. Scale bars, 10 μm (a,h), 3 μm (i) and 500 nm (j, k).
Fig. 3
Fig. 3. Investigation of endocytosis and exocytosis with etSTED.
This shows an etSTED experiment in HeLa cells expressing Dynamin1-EGFP or CD63-pHluorin and using the dynamin_rise or rapid_signal_spikes analysis pipeline. a, Schematic diagram of the dynamin-mediated endocytosis process of interest, with the increase in intensity due to accumulation of dynamin1 at the endocytic site. b, Schematic diagram of the experiment timeline of one widefield frame. Ith, intensity threshold; tth, time threshold. c, Example of a triggering widefield frame in an etSTED experiment with HeLa cells expressing Dynamin1-EGFP. d, Two representative events shown in widefield zooms with three frames leading up to the event (right frame). e, Triggered 5.9 Hz 3D STED timelapses of plasma membrane dynamics where cholesterol (cholesterol-Abberior STAR RED) is labeled. n = 53 events, n = 22 cells. f, Schematic diagram of an exocytosis event of interest, with the increase in fluorescence intensity due to unquenching of pHluorin upon pH neutralization of late endosomes (LEs) and multivesicular bodies (MVBs). g, Schematic diagram of the experiment timeline of one widefield frame. h, Example of a triggering widefield image in etSTED experiment with HeLa cells expressing CD63-pHluorin. i, Two representative events shown in widefield zooms (cyan, left) and analysis ratiometric image zooms (gray, right) with the last two frames before the event. j, Triggered 11 Hz 3D STED timelapses of plasma membrane dynamics and accumulation where cholesterol (cholesterol-Abberior STAR RED) is labeled. n = 232 events, N = 29 cells. Asterisks (*) indicate deconvolved frames, and apply to all following frames in the same timelapse. Scale bars, 10 µm (c,h), 2 µm (d,i), 250 nm (e,j).
Fig. 4
Fig. 4. Investigation of endosomal vesicle interaction with etSTED.
This shows an etSTED experiment in hippocampal neurons expressing CD63-EGFP and using the vesicle_proximity analysis pipeline. a, Schematic diagram of an endosomal vesicle interaction process, with the increasing proximity due to one labeled vesicle moving towards another stationary vesicle as labeled with CD63-EGFP. b, Schematic diagram of the experiment timeline of one widefield frame. c, Example of a triggering widefield frame. d, Two representative events shown in widefield zooms with three frames leading up to the event (right frame). The green box indicates the area of the STED scan. e, Triggered 2.8 Hz STED timelapses of endosomal vesicle dynamics where sphingosyl PE (sphingosyl-PE_Abberior STAR RED) is labeled. n = 123 events, n = 23 cells. Scale bars, 10 µm (c), 2 µm (d), 250 nm (e). The vesicles involved in the event are marked by symbols (asterisks and arrowhead).
Extended Data Fig. 1
Extended Data Fig. 1. Applications of etSTED analysis pipelines.
a, rapid_signal_spikes applied to hippocampal neurons labeled with BAPTA-OregonGreen488 to detect calcium spikes. Representative example from N = 946 events, N = 62 cells. b, rapid_signal_spikes applied to HeLa cells labeled with CD63-pHluorin in order to detect fusion events of endosomes to the plasma membrane. Representative example from N = 232 events, N = 29 cells. c, dynamin_rise applied to HeLa cells labeled with dynamin1-GFP in order to detect endocytosis at the plasma membrane. Representative example from N = 53 events, N = 22 cells. d, vesicle_proximity applied to hippocampal neurons labeled with CD63-GFP in order to detect interaction of intracellular vesicles. Representative example from N = 172 events, N = 30 cells. Scale bars 10 µm (widefield and analysis), 1 µm (zooms).
Extended Data Fig. 2
Extended Data Fig. 2. Characterization of etSTED: coordinate transform and etSTED experiments with calcium event triggering and STED imaging of microtubules.
a, Characterization of residual shift after coordinate transformation between widefield and scanning space across the field of view (FOV). N = 1048 beads. b, etSTED experiment in HeLa cells with BAPTA-1 calcium imaging with mean widefield. c, Maximum projection ratiometric image, showing the location of 9 detected events throughout the experiment. d, Event-triggered 2 × 2 μm2 STED images of SiR-tubulin. Inset (center) shows a zoomed-in view of the ratiometric image around event #1 for the five frames leading up to the event. e, Characterization of the imaged microtubule size in etSTED images across multiple experiments and across the FOV, as fitted FWHM in line profiles across single microtubules. N = 69 events, N = 8 cells. Scale bars, 10 μm (a,b,c), 2 μm (c inset) and 500 nm (d).
Extended Data Fig. 3
Extended Data Fig. 3. etSTED experiments in neurons with widefield imaging of calcium signaling (BAPTA-1) and STED timelapse imaging of actin (SiR-actin).
a, Mean widefield image of all triggering widefield frames. b, Maximum-projected analysis ratiometric image of all detected events in experiment. Green squares show location of detected events (a,b). c, Zoomed-in views of the ratiometric image in two detected events. d, 0.99 Hz etSTED timelapse of the actin structures. N = 234 events, N = 19 cells. Overlaid semi-transparent white outlines show extent of detected local calcium activity. Scale bars, 10 µm (a,b), 3 µm (c), 1 µm (d).
Extended Data Fig. 4
Extended Data Fig. 4. etSTED experiment in neurons with calcium imaging (Oregon Green 488 BAPTA-1) and STED timelapse imaging of synaptic vesicles (synaptotagmin-1_STAR635P).
a, Mean image of all widefield frames with detected events. Boxes are centered on the coordinates of true (green) and false (magenta) detected events. b, Maximum projection of all ratiometric preprocessed widefield frames with detected events. c, Same as b with boxes centered on the coordinates of true (green) and false (magenta) detected events. d, Number of detected events, true events, local events, and neurite-wide events. e, Widefield frame, ratiometric preprocessed frame, zoom-ins of the widefield and ratiometric, and event-triggered STED timelapse (30 frames, 0.99 Hz) of events as numbered and marked in a,c. N = 186 events, N = 17 cells. Boxes marks the center of the detected event. Same scales and time labels apply to all timelapses. Scale bars, 10 μm (a,b,c,e widefield and ratiometric), 2 μm (e zooms) and 1 μm (e STED).
Extended Data Fig. 5
Extended Data Fig. 5. Manual STED timelapse imaging of synaptic vesicles (synaptotagmin-1_STAR635P).
a, STED timelapses of synaptic vesicle clusters in active synapses. b, Distributions of area (left) and aspect ratio (right) for the clusters in calcium-activity-triggered STED timelapses (red) and manual timelapses (black). Box plots show 25–75% IQRs, middle line is mean, and whiskers reach 1.5 times beyond the first and third quartiles. N = 26 clusters in N = 10 cells (red), N = 14 clusters in N = 14 cells (black). Statistical test used is a two-sample two-sided Kolmogorov–Smirnov test: p = 0.90, test statistic = 0.17 (area); p = 0.76, test statistic = 0.20 (aspect ratio). Scale bars, 1 μm.
Extended Data Fig. 6
Extended Data Fig. 6. Imaging of synaptic vesicle dynamics with etSTED at 23 Hz.
a, (left) Oregon Green 488 BAPTA-1 widefield image. ROI I shows the neurite region in which a calcium event was detected. (right) Single frames of a STED timelapse recording showing synaptotagmin-1_STAR635P-labeled single synaptic vesicles. A line profile drawn across a synaptic vesicle shows a 62.7 nm FWHM. b, Representative 23.3 Hz STED timelapse recording of 30 frames showing the dynamics of single synaptic vesicles in active synapse upon a detected calcium event. In gray, the difference image between the first and second frame. The temporal-color-coded image depicts the mobility of synaptic vesicles in 1260 ms, with the white arrow displaying the directional movement. c, Representative 23.3 Hz STED timelapse recording of 30 frames showing the dynamics of a synaptic vesicle recycling pool in an active synapse upon a detected calcium event. In gray, the difference image between the first and second frame. The temporal-color-coded image depicts the mobility of the synaptic vesicle recycling pool in 1260 ms. N = 379 events, N = 14 cells. Scale bars, 10 μm (a, widefield), 1 μm (a widefield inset), 100 nm (a STED) and 250 nm (b,c).
Extended Data Fig. 7
Extended Data Fig. 7. etSTED experiments in HeLa cells with widefield imaging of dynamin (dynamin1-EGFP) and 3D STED timelapse imaging of membrane dynamics (cholesterol-KK114) during endocytosis.
a, Widefield images leading up to the triggering frame (last image), showing the slow rise in fluorescence signal signifying recruitment of dynamin at the site. b, Representative frames from 5.9 Hz 3D STED timelapses of XZ cross-sections across the detected event, showing various membrane dynamics during the endocytosis events taking place. Arrows marks the scanned section in X (a). N = 53 events, N = 22 cells. Same scales apply to all frames of the timelapses. Asterisks (*) indicate deconvolved frames, and applies to all following frames in the same timelapse. Scale bars, 2 μm (a), 250 nm (b).
Extended Data Fig. 8
Extended Data Fig. 8. etSTED experiments in HeLa cells with widefield imaging of CD63-pHluorin and 3D STED timelapse imaging of membrane dynamics (cholesterol-KK114) during exocytosis.
a, Widefield images leading up to the triggering frame (last image), showing the rapidly appearing (frame-to-frame) fluorescence signal signifying a local pH neutralization at the site. b, Representative frames from 11 Hz 3D STED timelapses of XZ cross-sections across the detected event, showing various membrane dynamics during the exocytosis events taking place. Arrows marks the scanned section in X (a). N = 232 events, N = 29 cells. Same scales apply to all frames of the timelapses. Asterisks (*) indicate deconvolved frames, and applies to all following frames in the same timelapse. Scale bars, 2 μm (a), 250 nm (b).
Extended Data Fig. 9
Extended Data Fig. 9. etSTED experiments in HeLa cells with widefield imaging of intracellular vesicles (CD63-EGFP) and STED timelapse imaging of membrane dynamics (cholesterol-KK114) during intracellular vesicle interaction.
a, Widefield images leading up to the triggering frame (last image), showing the increasing proximity of two vesicles (asterisk (mobile) and arrow (stationary)) indicating a potential interaction. b, Representative frames from 2.8 Hz STED timelapses around the detected event, showing the interaction of two vesicles, labeled with either sphingosyl-PE_Abberior STAR RED or cholesterol-Abberior STAR RED. Boxes marks the STED imaged area (a). Sphingosyl PE: N = 123 events, N = 22 cells; cholesterol: N = 49 events, N = 8 cells. Same scales and time labels apply to all timelapses. Asterisks (*) indicates deconvolved frames, and applies to all following frames in the same timelapse. Scale bars, 2 μm (a), 250 nm (b).

References

    1. Sahl SJ, Hell SW, Jakobs S. Fluorescence nanoscopy in cell biology. Nat. Rev. Mol. Cell Biol. 2017;18:685–701. doi: 10.1038/nrm.2017.71. - DOI - PubMed
    1. Westphal V, et al. Video-rate far-field optical nanoscopy dissects synaptic vesicle movement. Science. 2008;320:246–249. doi: 10.1126/science.1154228. - DOI - PubMed
    1. Schneider J, et al. Ultrafast, temporally stochastic STED nanoscopy of millisecond dynamics. Nat. Methods. 2015;12:827–830. doi: 10.1038/nmeth.3481. - DOI - PubMed
    1. Alvelid J, Testa I. Fluorescence microscopy at the molecular scale. Curr. Opin. Biomed. Eng. 2019;12:34–42. doi: 10.1016/j.cobme.2019.09.009. - DOI
    1. Alvelid J, Testa I. Stable stimulated emission depletion imaging of extended sample regions. J. Phys. Appl. Phys. 2019;53:024001. doi: 10.1088/1361-6463/ab4c13. - DOI

Publication types