. 2022 Oct;19(10):1262-1267.
doi: 10.1038/s41592-022-01589-x. Epub 2022 Sep 8.

Event-driven acquisition for content-enriched microscopy

Affiliations

Event-driven acquisition for content-enriched microscopy

Dora Mahecic et al. Nat Methods. 2022 Oct.

Abstract

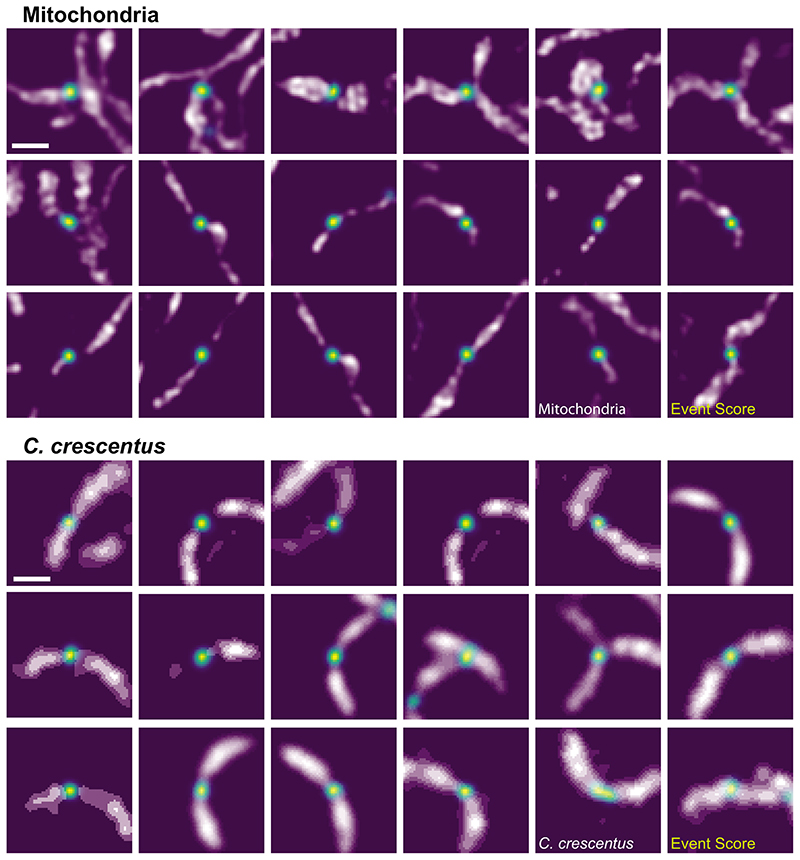
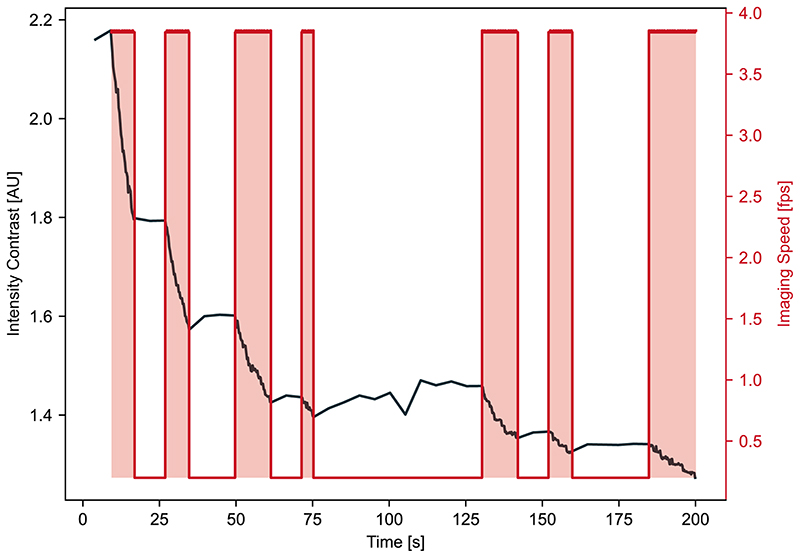
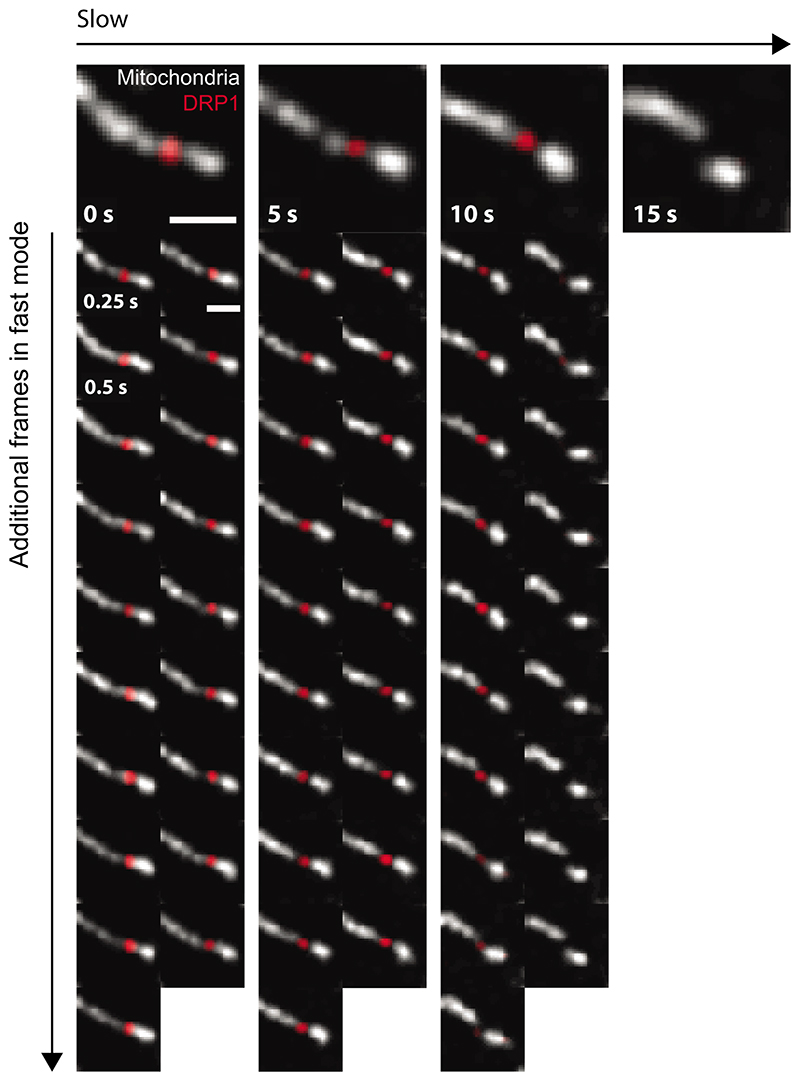
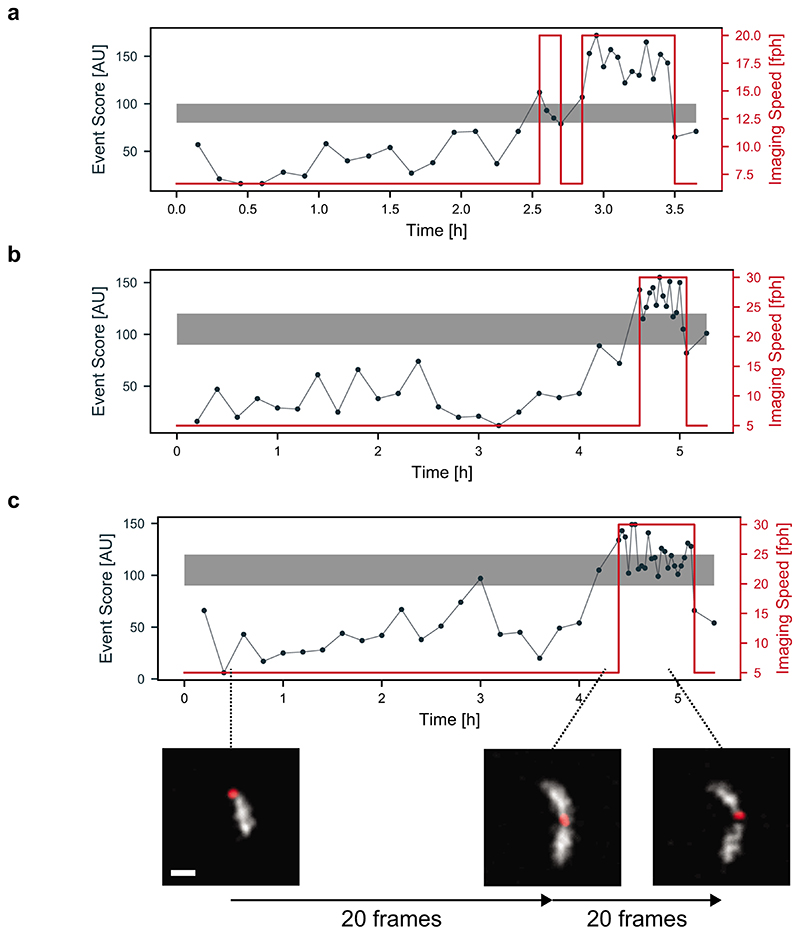
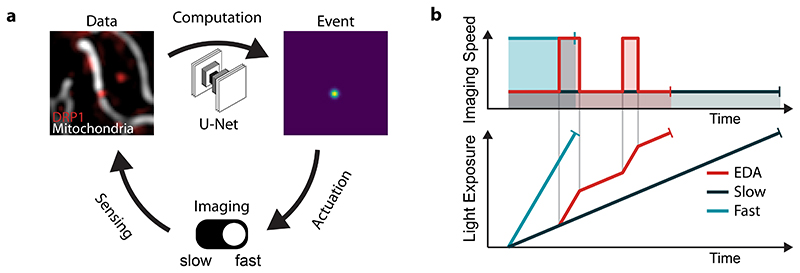
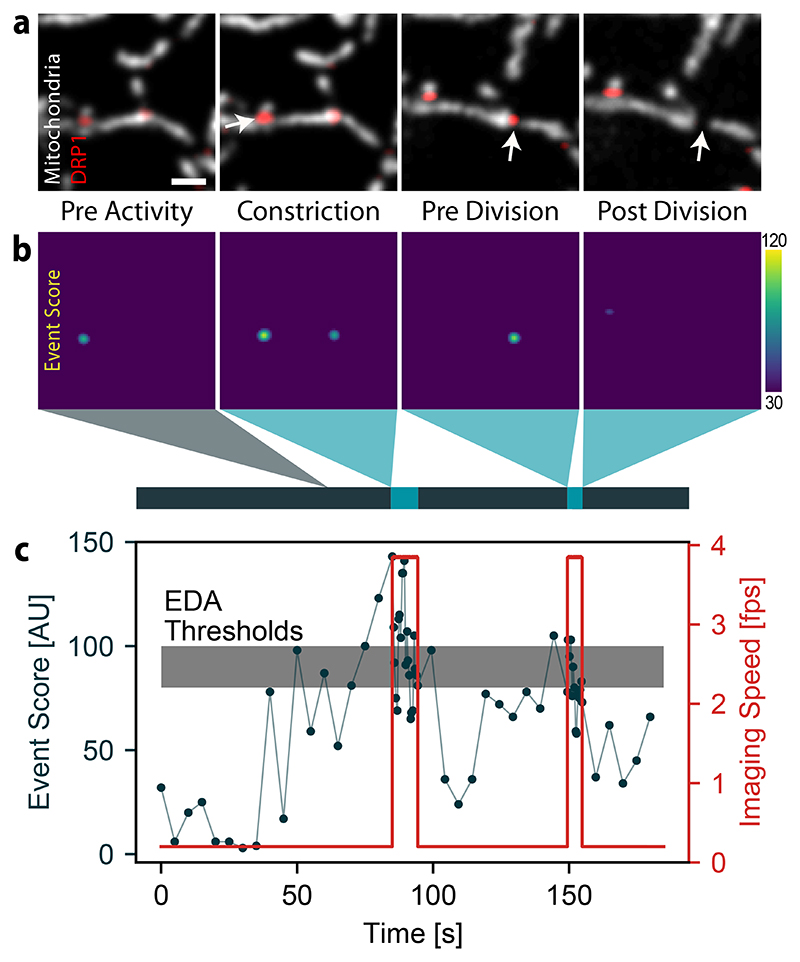
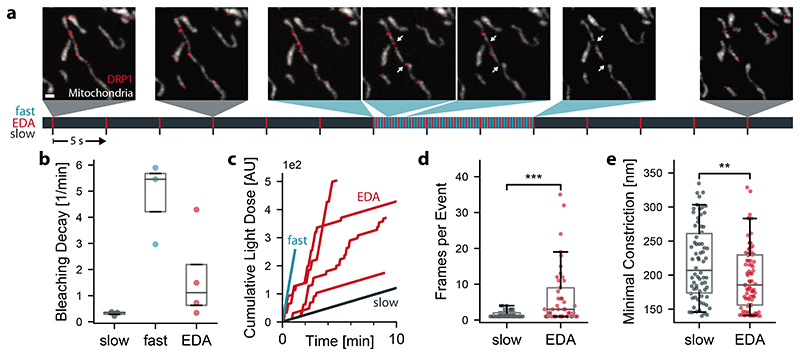
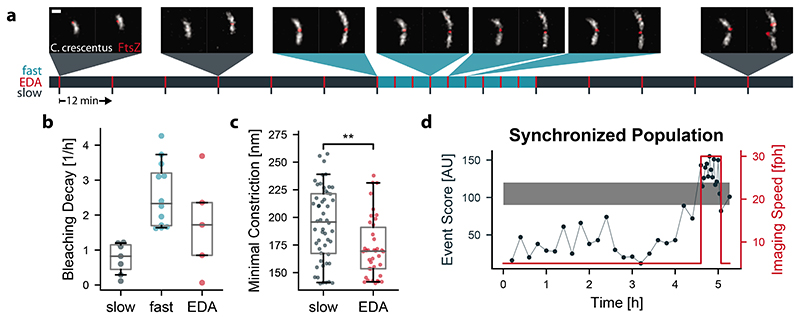
A common goal of fluorescence microscopy is to collect data on specific biological events. Yet, the event-specific content that can be collected from a sample is limited, especially for rare or stochastic processes. This is due in part to photobleaching and phototoxicity, which constrain imaging speed and duration. We developed an event-driven acquisition framework, in which neural-network-based recognition of specific biological events triggers real-time control in an instant structured illumination microscope. Our setup adapts acquisitions on-the-fly by switching between a slow imaging rate while detecting the onset of events, and a fast imaging rate during their progression. Thus, we capture mitochondrial and bacterial divisions at imaging rates that match their dynamic timescales, while extending overall imaging durations. Because event-driven acquisition allows the microscope to respond specifically to complex biological events, it acquires data enriched in relevant content.


Conflict of interest statement

Competing Interests Statement

The authors declare that they have no conflict of interest.

Figures

Extended Data Fig. 1
Extended Data Fig. 1. Example maximum event score regions which triggered EDA.
The event score output by the neural network can also be used to extract events of high interest from the datasets, after the acquisition is complete. Here, events that triggered EDA in different datasets are shown. The highest event score was used to define a region of interest around the event, representing a time and location of highest interest in the sample. Some regions appear twice, when the neural network event score was high enough to trigger EDA multiple times. Frames are shown in no specific order. Scale bars: 1 μm
Extended Data Fig. 2
Extended Data Fig. 2. Bleaching behavior of a mitochondria sample during EDA imaging.
The different modes of imaging can clearly be seen in the bleaching curve represented by the signal-to-noise ratio calculated from the intensity inside the mitochondria compared to the signal outside of the mitochondria. For some parts with low frame rate, even a slight recovery of signal can be observed. (representative of n = 4 independent experiments)
Extended Data Fig. 3
Extended Data Fig. 3. EDA delivers additional frames during events of interest.
Top row: mitochondrial division as it would have been recorded with the slow fixed imaging rate without EDA. Vertical frames: additional frames captured thanks to EDA switching to the fast imaging speed showing more detail of the dynamics of the event. Both the final constriction state and the fade of the DRP1 peak can be observed with higher temporal resolution, enhancing the relevant content of the dataset. This division event can also be seen in Supplementary Video 3.0. (Scale bars: 1 μm, representative of N = 33 events in n = 4 independent experiments)
Extended Data Fig. 4
Extended Data Fig. 4. EDA imaging of synchronized bacteria populations.
C. crescentus, the strain used in this study, were synchronized via density centrifugation to obtain a population of cells that are all at the beginning of their cell cycle (G0, swarmer). This leads to a time lag before the next divisions take place. As they are synchronized, many bacteria in the sample will then divide at the same time. We used EDA to sense the onset of divisions in the sample and increase imaging speed during the divisions for high SNR and temporal resolution. We tested different times between images for fast and slow speeds, as well as different threshold event scores (grey band). a, slow: 9 min, fast 3 min. b and c, slow: 12 min, fast 2 min. (Scale bar: 1 μm, n = 4 independent synchronizations)
Figure 1
Figure 1. Event driven acquisition (EDA) concept.
a, The feedback control loop for EDA is composed of three main parts: 1) sensing by image capture to gather data, 2) computation by a neural network to detect events of interest and generate a heat map of event score, and 3) adaptation of the acquisition parameters in response to events in the sample. b, Schema of experiment duration and cumulative light exposure for different fixed imaging speeds or with EDA to switch between the two. The total excitation light dose (shaded areas in upper panel, final light exposure value in lower panel) is constant for all experimental configurations to represent the fixed photon budget.
Figure 2
Figure 2. Event recognition of mitochondrial divisions during an iSIM acquisition.
a, Images of a COS-7 cell expressing mitochondrion-targeted Mito-TagRFP and Emerald-DRP1, including those containing events of interest (white arrow) that triggered a change in the imaging speed. (Scale bar: 1 μm; image intensities were corrected for photobleaching, N = 33 events in n = 4 independent experiments) b, Corresponding event score maps and measurement timeline (grey, slow speed; blue, fast speed). c, Time course of the maximum event score computed for each frame of the acquisition (black), and the adaptive imaging speed actuated by the event score (red). The upper boundary of the grey band denotes the maximum threshold above which the iSIM switches to fast imaging, and the lower boundary the minumum threshold below which it returns to slow imaging.
Figure 3
Figure 3. EDA versus fixed-rate imaging of mitochondrial divisions.
a, Mitochondrial dynamics (TagRFP-Mito, grey; Emerald-DRP1, red) captured by EDA (Scale bar: 1 μm, time first frame to last frame: 114 s). Below, measurement timeline indicating the approximate capture time of each image (grey, slow speed; blue, fast speed; red, frame capture, N = 33, n = 4). b, Decay constants obtained from exponential fits to the time-dependent mean intensity in the mitochondria (Extended Data Figure 2). Each point corresponds to a separate FOV. c, Cumulative light dose, defined as the laser power multiplied by the exposure time summed over all previous frames. EDA sometimes achieves a higher total light dose than fast imaging alone, due to recovery during slow imaging (Extended Data Figure 2). d, Number of frames with a constriction diameter below 200nm during the 20 seconds after the event score exceeded the threshold value. (P < 0.0003, Welch’s test) e, Minimal constriction width measured during the frames in d. (P < 0.005, independent two-sample t-test) slow: N = 360 frames in n = 3; fast: N = 765, n = 2; EDA: N = 1516, n = 4; Box plots mark the first quartile, median and third quartile with the whiskers spanning the 5th and 95th percentile.
Figure 4
Figure 4. EDA versus fixed-rate imaging of bacterial divisions.
a, Representative images of C. crescentus (cytosolic mScarlet-I in grey and FtsZ-sfGFP in red) division events captured at different imaging speeds using an event-driven acquisition (Scale bar: 1 μm, time first frame to last frame: 5.8 h). b, Decay constants obtained from exponential fitting of the mean intensity in the bacteria over time. c, Minimal constriction width measured when following a constriction event over time. (P < 0.001, independent two-sample t-test) d, Event score and imaging speed for an EDA triggered experiment on cell-cycle synchronized bacteria. Long lag phase and many divisions at the same time imaged in high temporal resolution triggered by EDA. (slow: N = 228, n = 2; fast: N = 296, n = 3; EDA: N = 182, n = 5). Box plots mark the first quartile, median and third quartile with the whiskers spanning the 5th and 95th percentile.

References

    1. Laissue PP, Alghamdi RA, Tomancak P, Reynaud EG, Shroff H. Assessing Phototoxicity in Live Fluorescence Imaging. Nat Methods. 2017 July;14:657–661. ISSN: 1548-7091, 1548-7105. - PubMed
    1. Scherf N, Huisken J. The Smart and Gentle Microscope. Nat Biotechnol. 2015 Aug;33:815–818. ISSN: 1087-0156, 1546-1696. - PubMed
    1. Grimm JB, Lavis LD. Caveat Fluorophore: An Insiders’ Guide to Small-Molecule Fluorescent Labels. Nat Methods. 2022 Feb;19:149–158. ISSN: 1548-7091, 1548-7105. - PubMed
    1. Rodriguez EA, et al. The Growing and Glowing Toolbox of Fluorescent and Photoactive Proteins. Trends Biochem Sci. 2017 Feb;42:111–129. ISSN: 0968-0004. - PMC - PubMed
    1. Weigert M, et al. Content-Aware Image Restoration: Pushing the Limits of Fluorescence Microscopy. Nat Methods. 2018 Dec;15:1090–1097. ISSN: 1548-7105. - PubMed

Publication types