. 2022 Sep 8;23(1):637.
doi: 10.1186/s12864-022-08865-2.

Evolutionary changes in gene expression profiles associated with the coevolution of male and female genital parts among closely related ground beetle species

Affiliations

Evolutionary changes in gene expression profiles associated with the coevolution of male and female genital parts among closely related ground beetle species

Shota Nomura et al. BMC Genomics. .

Abstract

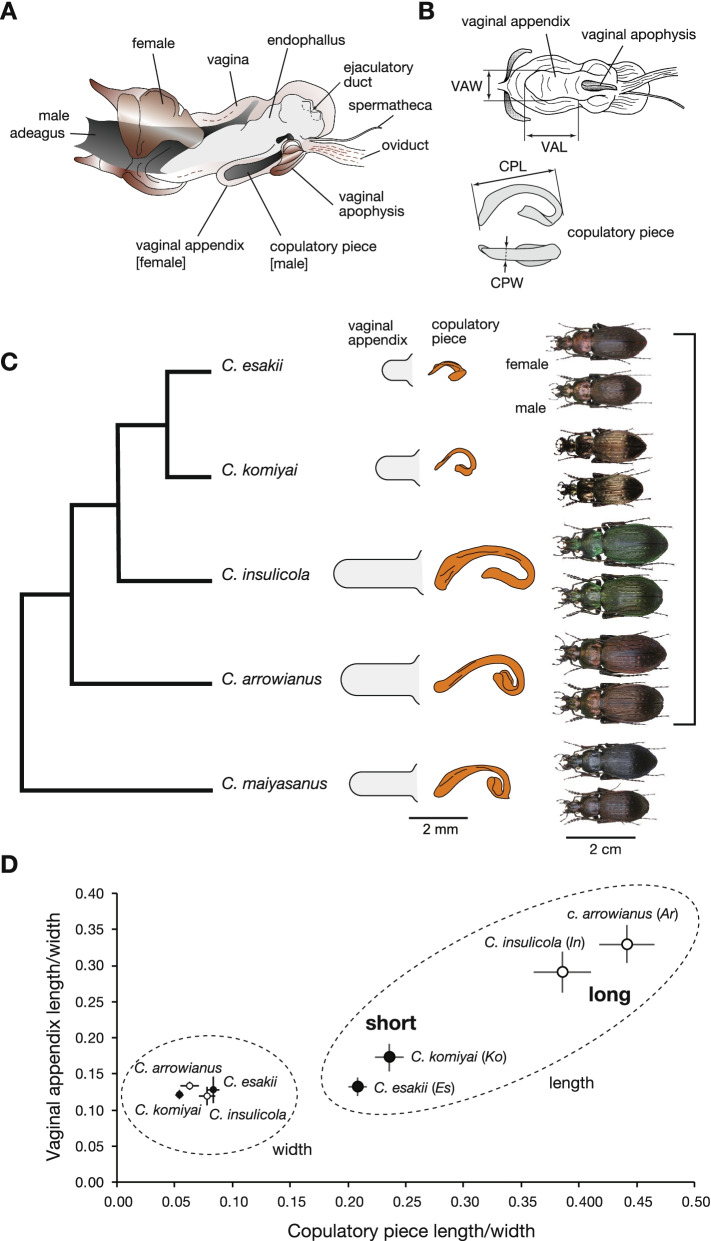
Background: The coevolutionary dynamics of corresponding male and female sexual traits, including genitalia, may be driven by complex genetic mechanisms. Carabus (Ohomopterus) ground beetles show correlated evolution in the size of their functionally corresponding male and female genital parts. To reveal the genetic mechanisms involved in the evolution of size, we investigated interspecific differences in gene expression profiles in four closely related species (two species each with long and short genital parts) using transcriptome data from genital tissues in the early and late pupal stages.

Results: We detected 1536 and 1306 differentially expressed genes (DEGs) among the species in males and 546 and 1959 DEGs in females in the two pupal stages, respectively. The DEGs were clustered by species-specific expression profiles for each stage and sex to identify candidate gene clusters for genital size based on the expression patterns among the species and gene ontology. We identified one and two gene clusters in females and males, respectively, all from the late pupal stage; one cluster of each sex showed similar expression profiles in species with similar genital size, which implies a common gene expression change associated with similar genital size in each sex. However, the remaining male cluster showed different expression profiles between species with long genital parts, which implies species-specific gene expression changes. These clusters did not show sex-concordant expression profiles for genital size differences.

Conclusion: Our study demonstrates that sex-independent and partly species-specific gene expression underlies the correlated evolution of male and female genital size. These results may reflect the complex evolutionary history of male and female genitalia.

Keywords: Character evolution; Differentially expressed genes; Genital formation; Interspecific differences; Sexual traits; Transcriptome.


Conflict of interest statement

The authors declare that they have no competing interests.

Figures

Fig. 1
Fig. 1
Male and female genitalia and phylogenetic relationships of Ohomopterus species used in this study. A Genital system and coupling of female and male genitalia in Ohomopterus beetles. B Measurements of the length and width of the vaginal appendix (upper) and copulatory piece (lower). C Phylogenetic relationships inferred from a restriction site associated DNA sequence data [15], vaginal appendix, copulatory piece, and habitus of adult beetles (upper: female; lower: male) of the four study species and the outgroup species, Carabus maiyasanus. D Relationships between length/width of the copulatory piece and vaginal appendix in the four study species. Photographs and illustrations by T. Sota
Fig. 2
Fig. 2
Hierarchical clustering and expression patterns in each cluster in males. A Early pupal (PE) stage; B Late pupal (PL) stage. Heatmaps are based on the expression profiles of interspecific DEGs, and the clusters are based on the similarity of expression profiles among the species. The yellow to blue colour gradient of the heatmap corresponds to the gradient of higher to lower expression levels of genes. The tree diagrams on the right show the species clustering based on the similarity of expression profiles of DEGs in each cluster. The n value indicates the number of DEGs included in each cluster. The numerals shown on each node are approximately unbiased P-values followed by the bootstrap percentage (AU/BP). Species: Ar, C. arrowianus; In, C. insulicola; Ko, C. komiyai; and Es, C. esakii. Ar and In are species with long copulatory pieces, and Ko and Es have short copulatory pieces
Fig. 3
Fig. 3
Hierarchical clustering and expression patterns in each cluster in females. A Early pupal (PE) stage; B Late pupal (PL) stage. Heatmaps are based on the expression profiles of interspecific DEGs, and the clusters are based on the similarity of the expression profiles among the species. The yellow to blue colour gradient of the heatmap corresponds to the gradient of higher to lower expression levels of the genes. The tree diagrams on the right show the species clustering based on the similarity of expression profiles of DEGs in each cluster. The n value indicates the number of DEGs included in each cluster. The numerals shown on each node are approximately unbiased P-values followed by the bootstrap percentage (AU/BP). Species: Ar, C. arrowianus; In, C. insulicola; Ko, C. komiyai; and Es, C. esakii. Ar and In are species with long vaginal appendices, and Ko and Es have short copulatory pieces
Fig. 4
Fig. 4
Expression profiles of the candidate genes included in candidate clusters. The candidate genes for interspecific differences in copulatory piece length (A, B) and vaginal appendix length (C). A MPL4 cluster genes, bun, CG14073, Usp8, and cmb. B MPL8 cluster genes, MED24, and obst-A. C FPL1 cluster genes, dimm, Sb, Pka-C3, Fhos, and Cpr56F. Species: Ar, C. arrowianus; In, C. insulicola; Ko, C. komiyai; and Es, C. esakii. Expression levels with the same letter (a, b, c) are not significantly different from each other (P > 0.05) among species in each stage by the multiple comparison test
Fig. 5
Fig. 5
Summary of the expression changes in differences in genital part length implied by our results. Arrows indicate gene clusters for genital part length differences, and arrowheads indicate the species with upregulated gene expression. A shaded circle indicates that MPL4 and FPL1 contained shared genes. Species: Ar, C. arrowianus; In, C. insulicola; Ko, C. komiyai; and Es, C. esakii

Similar articles

References

    1. Panhuis TM, Butlin R, Zuk M, Tregenza T. Sexual selection and speciation. Trends Ecol Evol. 2001;16:364–371. doi: 10.1016/S0169-5347(01)02160-7. - DOI - PubMed
    1. Mendelson TC, Safran RJ. Speciation by sexual selection: 20 years of progress. Trends Ecol Evol. 2021;36:1153–1163. doi: 10.1016/j.tree.2021.09.004. - DOI - PubMed
    1. Fisher RA. The genetical theory of natural selection. Oxford: Clarendon Press; 1930.
    1. Lande R. Models of speciation by sexual selection on polygenic traits. Proc Natl Acad Sci U S A. 1981;78 6 I:3721–5. doi: 10.1073/pnas.78.6.3721. - DOI - PMC - PubMed
    1. Servedio MR, Boughman JW. The role of sexual selection in local adaptation and speciation. Annu Rev Ecol Evol Syst. 2017;48:85–109. doi: 10.1146/annurev-ecolsys-110316-022905. - DOI