. 2022 Sep 8;10(1):136.
doi: 10.1186/s40478-022-01439-z.

Regulating microglial miR-155 transcriptional phenotype alleviates Alzheimer's-induced retinal vasculopathy by limiting Clec7a/Galectin-3+ neurodegenerative microglia

Affiliations

Regulating microglial miR-155 transcriptional phenotype alleviates Alzheimer's-induced retinal vasculopathy by limiting Clec7a/Galectin-3+ neurodegenerative microglia

Haoshen Shi et al. Acta Neuropathol Commun. .

Abstract

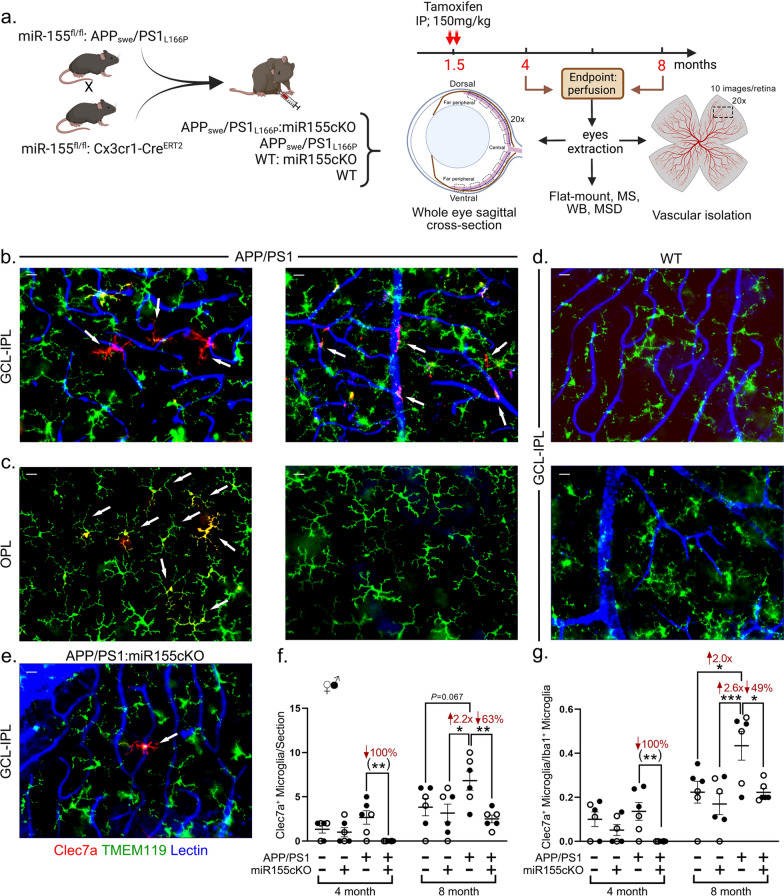
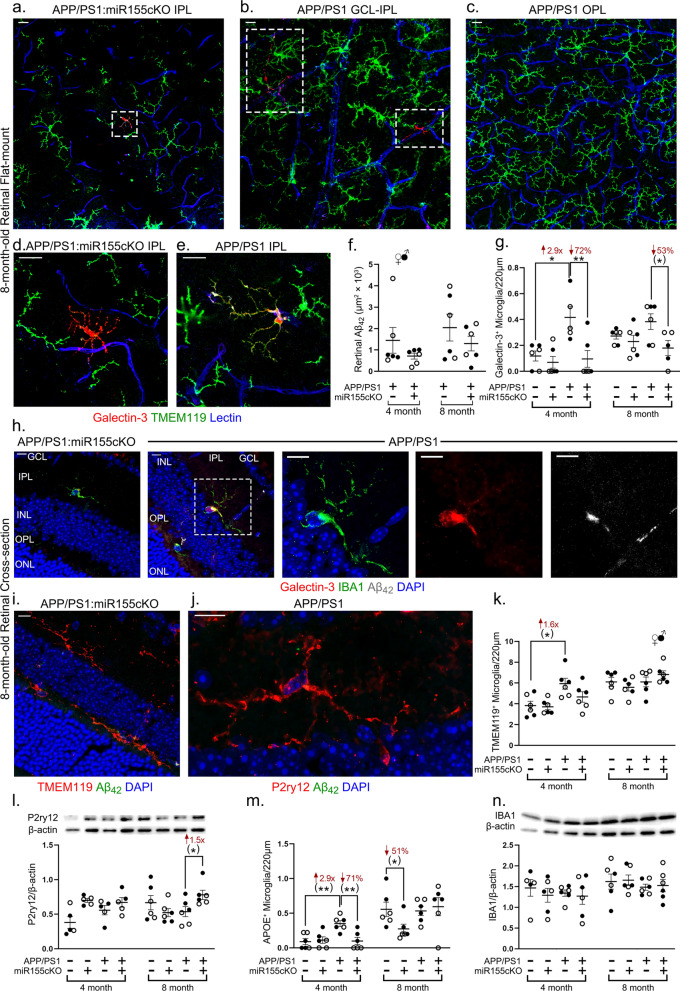
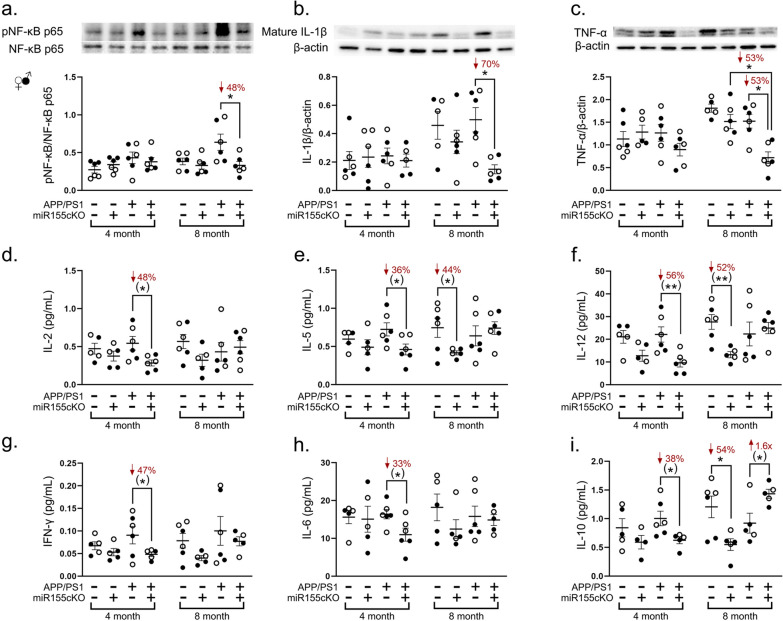
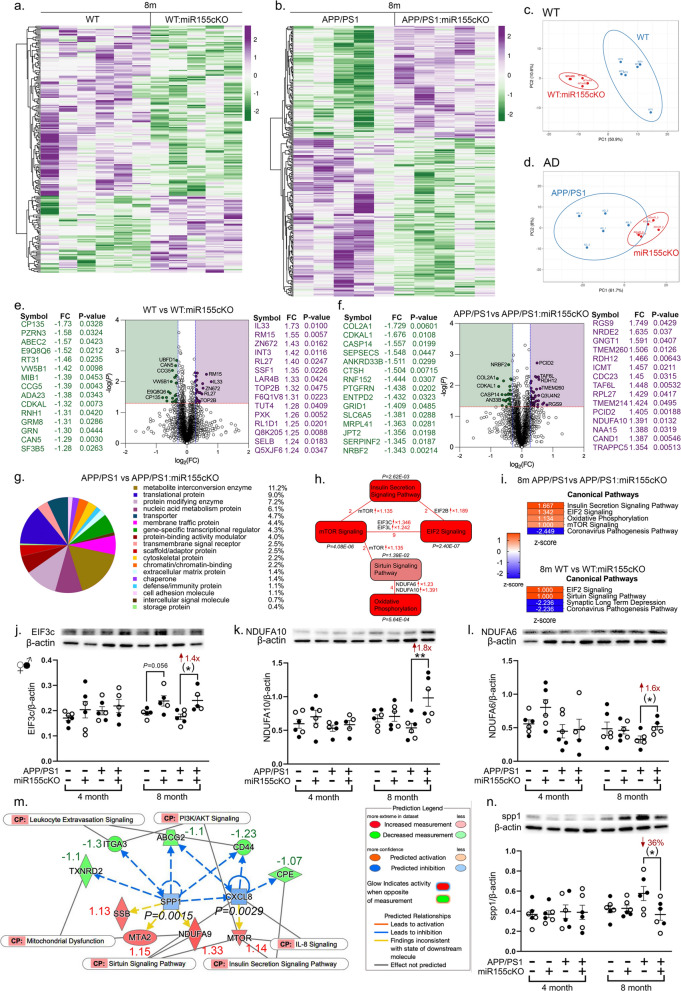
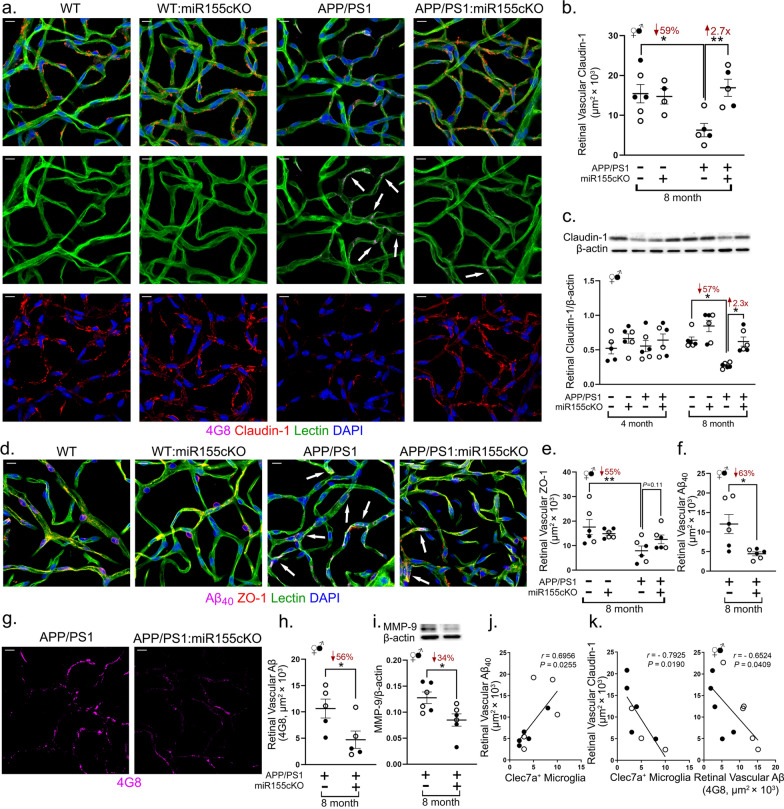
Single cell RNA sequencing studies identified novel neurodegeneration-associated microglial (MGnD/DAM) subtypes activated around cerebral amyloid plaques. Micro-RNA (miR)-155 of the TREM2-APOE pathway was shown to be a key transcriptional regulator of MGnD microglial phenotype. Despite growing interest in studying manifestations of Alzheimer's disease (AD) in the retina, a CNS organ accessible to noninvasive high-resolution imaging, to date MGnD microglia have not been studied in the AD retina. Here, we discovered the presence and increased populations of Clec7a+ and Galectin-3+ MGnD microglia in retinas of transgenic APPSWE/PS1L166P AD-model mice. Conditionally targeting MGnD microglia by miR-155 ablation via the tamoxifen-inducible CreERT2 system in APPSWE/PS1L166P mice diminished retinal Clec7a+ and Galectin-3+ microglial populations while increasing homeostatic P2ry12+ microglia. Retinal MGnD microglia were often adhering to microvessels; their depletion protected the inner blood-retina barrier and reduced vascular amyloidosis. Microglial miR-155 depletion further limits retinal inflammation. Mass spectrometry analysis revealed enhanced retinal PI3K-Akt signaling and predicted IL-8 and Spp1 decreases in mice with microglia-specific miR-155 knockout. Overall, this study identified MGnD microglia in APPSWE/PS1L166P mouse retina. Transcriptional regulation of these dysfunctional microglia mitigated retinal inflammation and vasculopathy. The protective effects of microglial miR-155 ablation should shed light on potential treatments for retinal inflammation and vascular damage during AD and other ocular diseases.

Keywords: Alzheimer’s disease; Inflammation; Microglia; Retinopathy; Vascular damage; microRNA.


Conflict of interest statement

O.B. is an inventor of a patent for use miR-155 inhibitors in neurodegenerative diseases. O.B. and M.A.M. are co-inventors of a patent for use of Galectin-3 inhibitors for treatment of glaucoma. O.B.: collaboration with Sanofi, GSK, Regulus Therapeutics; research funding from Sanofi, GSK, miRagen Therapeutics, honoraria for lectures, consultancy: Camp4.

Figures

Fig. 1
Fig. 1
Targeting microglial miR-155 diminished the population of Clec7a+ MGnD microglia. a Schema for generation of wild type (WT) and Alzheimer’s disease (AD) mice that were specifically targeted for miR-155 in microglia. miR-155 fl/fl:APP/PS1 mice and miR-155 fl/fl:Cx3cr1CreERT2 mice were crossed to create APP/PS1:miR155cKO mice. Other experimental groups include APP/PS1, WT:miR155cKO and WT. Two consecutive doses of tamoxifen (150 mg/kg) were introduced peritoneally to 1.5-month-old mice to induce conditional microglial miR-155 knock-out. Mice were sacrificed at 4 months or 8 months for cross-section, vascular isolation, flat mount, mass spectrometry (MS), western blotting (WB) and Meso Scale Discovery (MSD). This illustration was created by using Biorender.com. be Representative images of immunofluorescent staining for Clec7a+ microglia (red), Tmem119+ microglia (green) and lectin for blood vessels (blue) on retinal flat mounts from b APP/PS1 genotype, ganglion cell layer (GCL) to inner plexiform layer (IPL); c APP/PS1 genotype, outer plexiform layer (OPL); d WT genotype, GCL to IPL; and e APP/PS1:miR155cKO genotype, GCL to IPL. Images were obtained using 20 × microscope objectives. Arrows indicate Clec7a+ microglia. Scale bars = 10 µm. f Manual counting of Clec7a+ microglia in each entire retinal cross-section from all experimental groups (n = 48 total, n = 6 each group). g Ratio of Clec7a+ microglia to Iba1+ microglia from the same mouse cohort. Data from individual mice (circles) as well as group means ± SEMs are shown. Black-filled circles represent male and clear circles represent female animals. *p < 0.05, **p < 0.01, ***p < 0.001, by three-way ANOVA with Tukey’s post-hoc multiple comparison test. Two group statistical analysis was performed using an unpaired two-tailed Student t-test and is shown in parentheses. Fold changes and percentage decreases are shown in red
Fig. 2
Fig. 2
Conditional depletion of microglial miR-155 decreases Galectin-3+ microglia and upregulates homeostatic P2ry12 expression in APP/PS1 mice retinas. ae Representative images of immunofluorescent staining for Galectin-3+ microglia (red), Tmem119+ microglia (green) and lectin for blood vessels (blue) on retinal flat mounts from a APP/PS1:miR-155cKO genotype, inner plexiform layer (IPL); b APP/PS1 genotype, ganglion cell layer (GCL) to IPL; c APP/PS1 genotype, outer plexiform layer (OPL); d APP/PS1:miR-155cKO genotype, IPL; and e APP/PS1 genotype, IPL. Images were obtained using 20 × or 63 × microscope objectives. Dashed-line rectangles highlight Galectin-3+ microglia. Scale bars = 10 µm. f Quantitative analysis of 12F4 for Aβ42 immunoreactivity (IR) in retinal cross-sections of mice from all experimental groups (n = 48 total, n = 6 each group). g Manual counting of Galectin-3+ microglia in each retinal cross-section from all experimental groups of the same mouse cohort. h Representative images of immunofluorescent staining for Galectin-3+ microglia (red), Iba1+ microglia (green), 12F4 for Aβ42 (white) and DAPI (blue) on retinal cross-sections from APP/PS1:miR-155cKO and APP/PS1 mice. Images were obtained using 40 × microscope objectives. Dashed-line rectangle highlights a Galectin-3+ microglia engulfing Aβ42. Scale bars = 10 µm. i, j. Representative images of eye cross-section depicting immunofluorescent staining for i Tmem119+ microglia (red), 12F4 for Aβ42 (green) and DAPI (blue) from an APP/PS1:miR-155cKO mouse and j P2ry12+ microglia (red), 12F4 for Aβ42 (green) and DAPI (blue) from an APP/PS1 mouse. k Manual counting of Tmem119+ microglia in each retinal cross-section from all experimental groups of the same mouse cohort. l Densitometric analysis of western blotting protein bands of P2ry12 normalized by β-actin control for retinal lysates from all experimental groups (n = 48 total, n = 6 each group). m Manual counting of Apoe+ microglia in each retinal cross-section from all experimental groups of the same mouse cohort shown in figures g and k n Densitometric analysis of western blotting protein bands of Iba1 normalized by β-actin control for retinal lysates from all experimental groups of the same cohort as figure l. Data from individual mice (circles) as well as group means ± SEMs are shown. Black-filled circles represent male and clear circles represent female animals. *p < 0.05, **p < 0.01, by two-way or three-way ANOVA with Tukey’s post-hoc multiple comparison test. Two group statistical analysis was performed using an unpaired two-tailed Student t-test and is shown in parentheses. Fold changes and percentage decreases are shown in red
Fig. 3
Fig. 3
Targeting microglial miR-155 ameliorates inflammation in APP/PS1 mouse retinas. ac Densitometric analyses of western blotting protein bands of a phosphorylated NF-κB p65, b mature IL-1β, and c. TNF-α normalized by a total NF-κB p65 or b and c β-actin control for retinal lysates from all experimental groups (n = 48 total, n = 6 each group). di Meso Scale Discovery analysis for protein expression of cytokines including d IL-2, e IL-5, f IL-12, g IFN-γ, h IL-6 and i IL-10 from the same mouse cohort. Data from individual mice (circles) as well as group means ± SEMs are shown. Black-filled circles represent male and clear circles represent female animals. *p < 0.05, **p < 0.01, by three-way ANOVA with Tukey’s post-hoc multiple comparison test. Two group statistical analysis was performed using an unpaired two-tailed Student t-test and is shown in parentheses. Fold changes and percentage decreases are shown in red
Fig. 4
Fig. 4
Conditional microglial miR-155 knock-out enhanced PI3K-Akt signaling in APP/PS1 mouse retinas. a Detectable protein hierarchies displayed as heatmaps from a a comparison of 8-month-old WT and WT:miR-155cKO mice and b a comparison of 8-month-old APP/PS1 and APP/PS1:miR-155cKO mice; upregulated proteins are shown in purple and downregulated proteins in green. c, d Principal component analysis for a and b ef Volcano plots and top 15 up- or downregulated proteins by fold change between e 8-month-old WT vs. WT:miR-155cKO mice and f 8-month-old APP/PS1 vs. APP/PS1:miR-155cKO mice; upregulated proteins are shown in purple and downregulated proteins in green. g Pie chart of PANTHER functional classification analysis showing fraction and percentage of significantly differentially expressed proteins (DEPs, up- or downregulated proteins) grouped by protein class category based on a comparison of APP/PS1 and APP/PS1:miR-155cKO mice. h Ingenuity pathway analysis (IPA) of canonical pathways based on APP/PS1 vs. APP/PS1:miR-155cKO mice. Several upregulated PI3K-Akt pathways are shown here. P values are labelled on each pathway. Quantities of commonly changed molecules between each two pathways are labelled in red together with highlighted molecules and detectable fold changes. i Z-scores for the IPA analysis of canonical pathways from 8-month-old WT vs. WT:miR-155cKO mice and 8-month-old APP/PS1 and APP/PS1:miR-155cKO mice. jl Densitometric analysis of western blotting protein bands of j EIF3c, k NDUFA10, and l NDUFA6, each normalized by β-actin control for retinal lysates from all experimental groups (n = 48 total, n = 6 each group). m IPA analysis for upstream regulators Spp1 and Cxcl-8 based on 8-month-old APP/PS1 vs. APP/PS1:miR-155cKO versus mice. Refer to “prediction legend” in the graph for details. Detectable fold changes of DEPs are written next to each molecule. CP-common pathways. n Densitometric analysis of western blotting protein bands of SPP1 normalized by β-actin control for retinal lysates from the same cohort. Data from individual mice (circles) as well as group means ± SEMs are shown. Black-filled circles represent male and clear circles represent female animals. *p < 0.05, **p < 0.01, by three-way ANOVA with Tukey’s post-hoc multiple comparison test. Two group statistical analysis was performed using an unpaired two-tailed Student t-test and is shown in parentheses. Fold changes and percentage decreases are shown in red
Fig. 5
Fig. 5
Targeting microglial miR-155 protected retinal blood vessels and reduced vascular amyloidosis in APP/PS1 mouse retinas. a Representative images of immunofluorescent staining for 4G8 of Aβ (magenta), Claudin-1 (red), lectin for blood vessels (green) and DAPI (blue) on isolated retinal blood vessels from all four genotypes—WT, WT:miR-155cKO, APP/PS1, and APP/PS1:miR-155cKO—in 8-month-old mice. Images were obtained using the 63 × microscope objective. Arrows indicate vascular Aβ. Scale bars = 10 µm. b Quantitative analysis of Claudin-1-immunoreactivity (IR) in isolated retinal blood vessels from all 8-month-old experimental groups (n = 24 total, n = 6 each group). c Densitometric analysis of western blotting protein bands of Claudin-1 normalized by β-actin control for retinal lysates from all experimental groups (n = 48 total, n = 6 each group). d Representative images of immunofluorescent staining for 11A50-B10 of Aβ40 (magenta), ZO-1 (red), lectin for blood vessels (green) and DAPI (blue) on isolated retinal blood vessels from all four genotypes—WT, WT:miR-155cKO, APP/PS1, and APP/PS1:miR-155cKO—in 8-month-old mice. Images were obtained using the 63 × microscope objective. Arrows indicate vascular Aβ. Scale bars = 10 µm. e Quantitative analysis of ZO-1-IR in isolated retinal blood vessels from same mouse cohort as shown in panel b. f Quantitative analysis of 11A50-B10 for Aβ40-IR in isolated retinal blood vessels from 8-month-old APP/PS1 experimental groups (n = 12 total, n = 6 each group). g Representative images of immunofluorescent staining of 4G8 for Aβ (magenta) on isolated retinal blood vessels from 8-month-old APP/PS1 or APP/PS1:miR-155cKO mice groups. h Quantitative analysis of 4G8 for Aβ in isolated retinal blood vessels from the same mouse cohort shown in panel f. i Densitometric analysis of western blotting protein bands of MMP-9 normalized by β-actin control for retinal lysates from APP/PS1:miR-155cKO vs. APP/PS1 mice (n = 12 total, n = 6 each group). j, k Pearson’s coefficient (r) correlation between j. retinal vascular Aβ40 and retinal Clec7a+ microglia, k retinal vascular Claudin-1-IR and retinal Clec7a+ microglia or retinal vascular Aβ-IR. Data from individual mice (circles) as well as group means ± SEMs are shown. Black-filled circles represent male and clear circles represent female animals. *p < 0.05, **p < 0.01, by two-way or three-way ANOVA with Tukey’s post-hoc multiple comparison test. Two group statistical analysis was performed using an unpaired two-tailed Student t-test. Fold changes and percentage decreases are shown in red

References

    1. Al-Huseini I, Harada M, Nishi K, Nguyen-Tien D, Kimura T, Ashida N. Improvement of insulin signalling rescues inflammatory cardiac dysfunction. Sci Rep. 2019;9:14801. doi: 10.1038/s41598-019-51304-8. - DOI - PMC - PubMed
    1. Antes R, Salomon-Zimri S, Beck SC, Garcia Garrido M, Livnat T, Maharshak I, Kadar T, Seeliger M, Weinberger D, Michaelson DM. VEGF Mediates ApoE4-Induced neovascularization and synaptic pathology in the choroid and retina. Curr Alzheimer Res. 2015;12:323–334. doi: 10.2174/1567205012666150325182504. - DOI - PubMed
    1. Asanad S, Ross-Cisneros FN, Nassisi M, Barron E, Karanjia R, Sadun AA. The retina in Alzheimer's disease: histomorphometric analysis of an ophthalmologic biomarker. Invest Ophthalmol Vis Sci. 2019;60:1491–1500. doi: 10.1167/iovs.18-25966. - DOI - PMC - PubMed
    1. Aveleira CA, Lin CM, Abcouwer SF, Ambrosio AF, Antonetti DA. TNF-alpha signals through PKCzeta/NF-kappaB to alter the tight junction complex and increase retinal endothelial cell permeability. Diabetes. 2010;59:2872–2882. doi: 10.2337/db09-1606. - DOI - PMC - PubMed
    1. Bachiller S, Jimenez-Ferrer I, Paulus A, Yang Y, Swanberg M, Deierborg T, Boza-Serrano A. Microglia in neurological diseases: a road map to brain-disease dependent-inflammatory response. Front Cell Neurosci. 2018;12:488. doi: 10.3389/fncel.2018.00488. - DOI - PMC - PubMed

Publication types