. 2022 Sep 8;10(1):134.
doi: 10.1186/s40478-022-01424-6.

Mitochondrial dysfunction is a key pathological driver of early stage Parkinson's

Affiliations

Mitochondrial dysfunction is a key pathological driver of early stage Parkinson's

Christina E Toomey et al. Acta Neuropathol Commun. .

Abstract

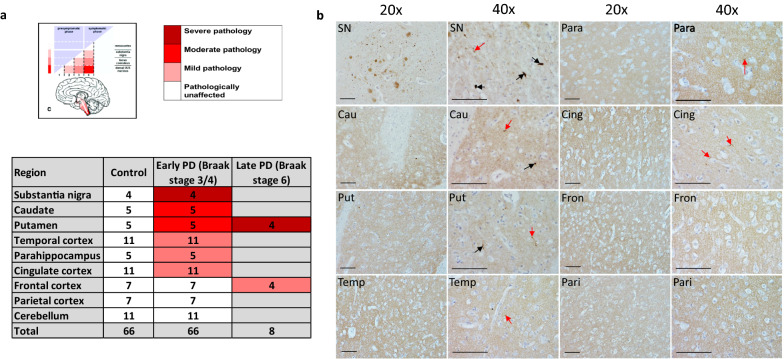
Background: The molecular drivers of early sporadic Parkinson's disease (PD) remain unclear, and the presence of widespread end stage pathology in late disease masks the distinction between primary or causal disease-specific events and late secondary consequences in stressed or dying cells. However, early and mid-stage Parkinson's brains (Braak stages 3 and 4) exhibit alpha-synuclein inclusions and neuronal loss along a regional gradient of severity, from unaffected-mild-moderate-severe. Here, we exploited this spatial pathological gradient to investigate the molecular drivers of sporadic PD.

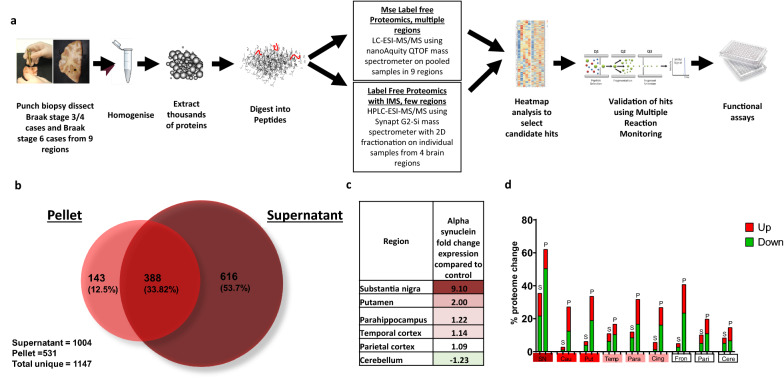
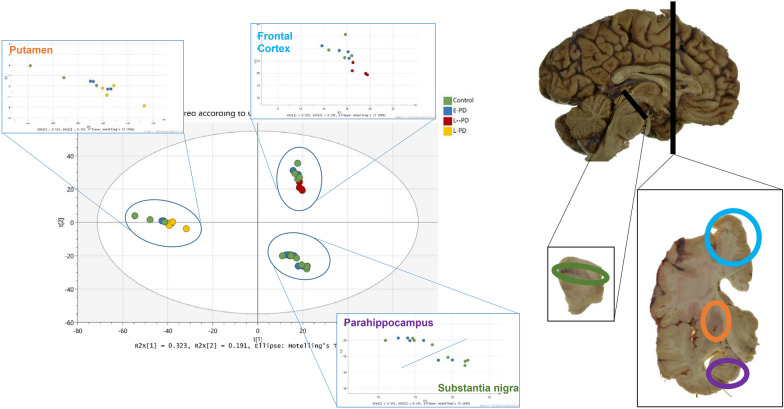
Methods: We combined high precision tissue sampling with unbiased large-scale profiling of protein expression across 9 brain regions in Braak stage 3 and 4 PD brains, and controls, and verified these results using targeted proteomic and functional analyses.

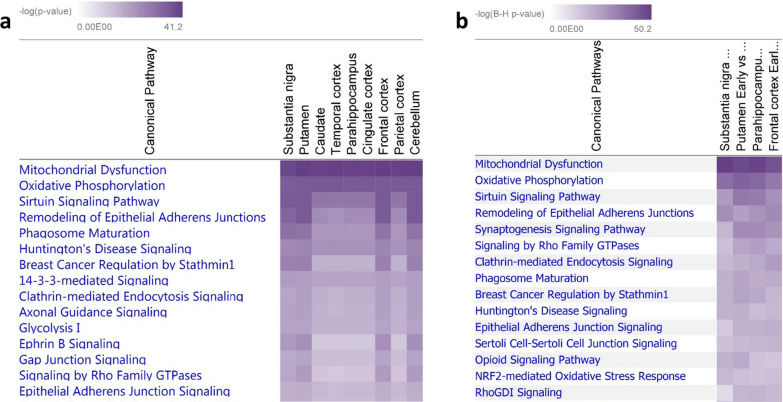
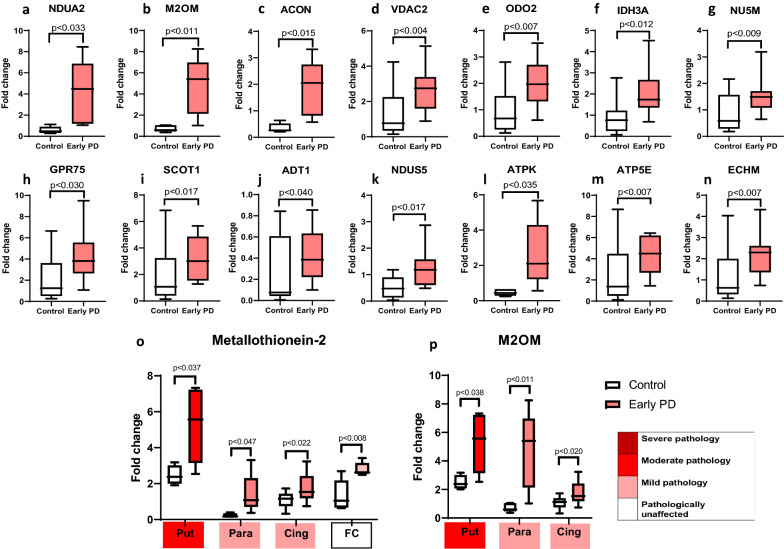
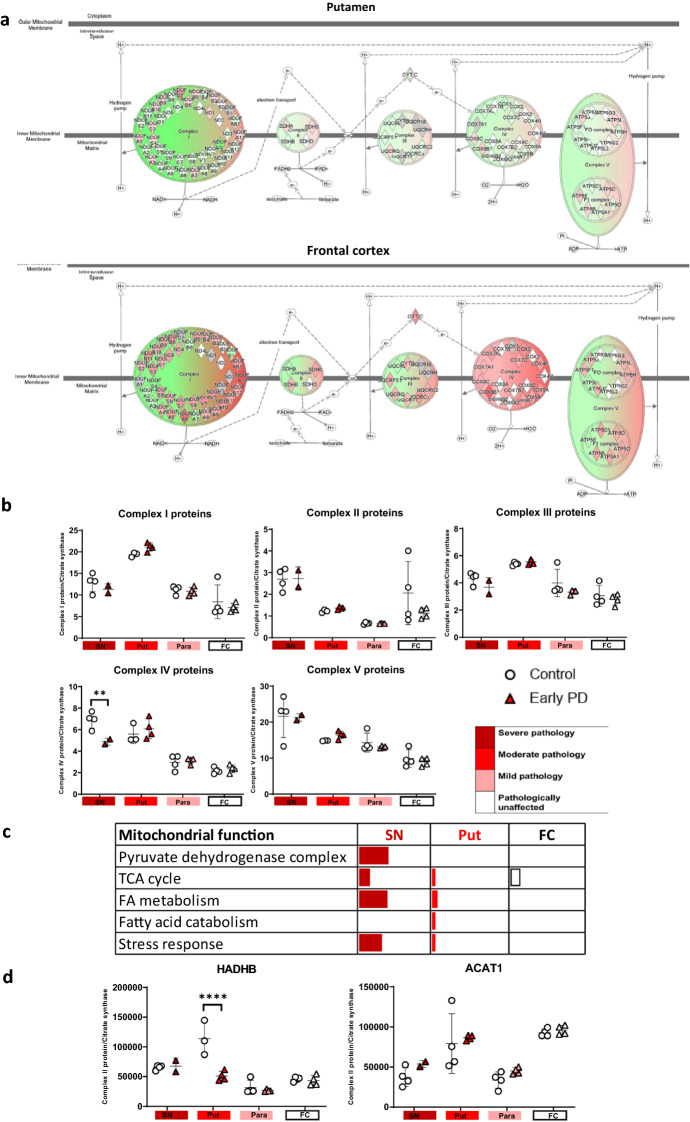
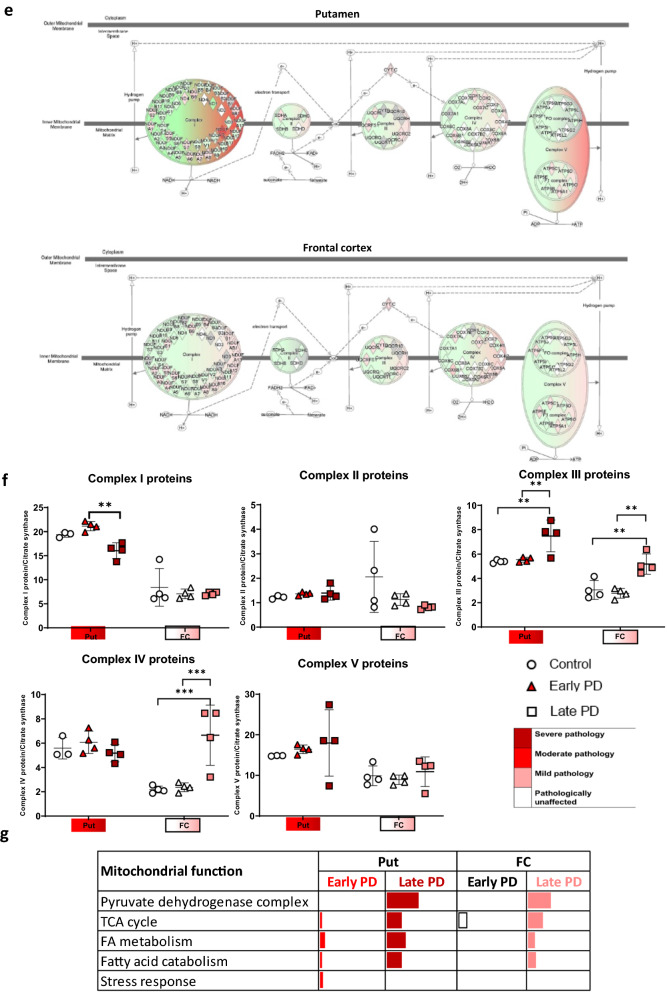
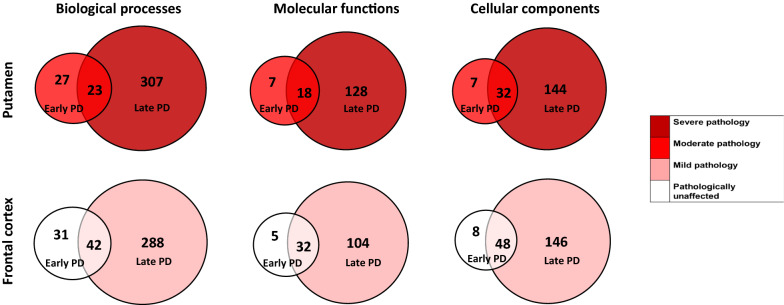
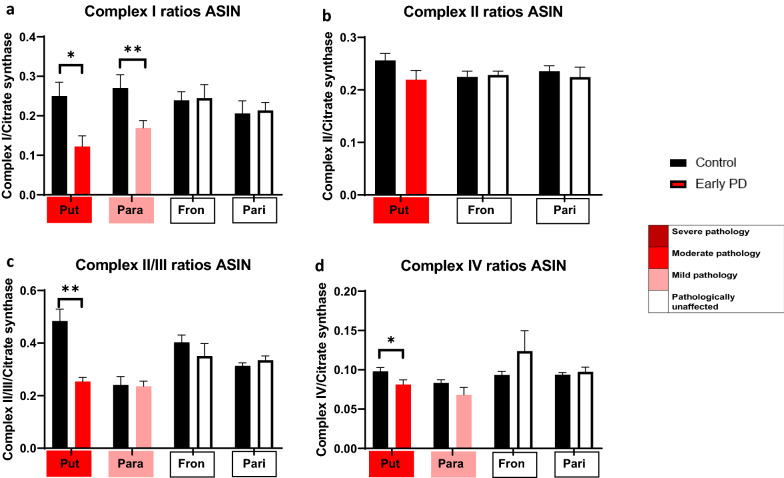
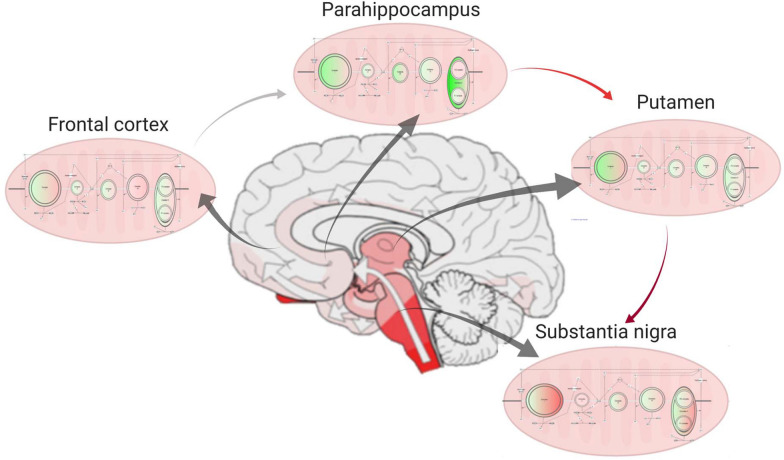
Results: We demonstrate that the spatio-temporal pathology gradient in early-mid PD brains is mirrored by a biochemical gradient of a changing proteome. Importantly, we identify two key events that occur early in the disease, prior to the occurrence of alpha-synuclein inclusions and neuronal loss: (i) a metabolic switch in the utilisation of energy substrates and energy production in the brain, and (ii) perturbation of the mitochondrial redox state. These changes may contribute to the regional vulnerability of developing alpha-synuclein pathology. Later in the disease, mitochondrial function is affected more severely, whilst mitochondrial metabolism, fatty acid oxidation, and mitochondrial respiration are affected across all brain regions.

Conclusions: Our study provides an in-depth regional profile of the proteome at different stages of PD, and highlights that mitochondrial dysfunction is detectable prior to neuronal loss, and alpha-synuclein fibril deposition, suggesting that mitochondrial dysfunction is one of the key drivers of early disease.

Keywords: Brain; Mitochondria; Neurodegeneration; Parkinson’s; Progression; Proteomics.


Conflict of interest statement

The authors declare that they have no competing interests.

Figures

Fig. 1
Fig. 1
Case selection according to Braak staging system. a Diagram indicating the amount of Lewy body pathology in the regions used in the study according to Braak staging criteria. Severity of pathology at early-mid stage Braak 3/4 and late Braak stage 6 is highlighted by colours shown in reference to the key. Table indicates how many cases used for each region and disease group. b Panel of representative pathology images from a Braak stage 3/4 brain, highlighting the level of alpha-synuclein pathology in each region at this stage of disease at 20 × and 40 × magnification. Regions are labelled as follows: SN Substantia nigra; Cau Caudate; Put Putamen; Temp Temporal cortex; Para Parahippocampal gyrus; Cing Cingulate cortex; Fron Frontal cortex; Pari Parietal cortex. Black arrows show Lewy body presence and red arrows Lewy neurites. All scale bars represent 10 μm
Fig. 2
Fig. 2
Workflow of methodology. a Flowchart highlighting methods used within the experiment. Tissue was micro-dissected per region, tissue homogenised and proteins were extracted and digested into peptides. Samples were proteome profile using mass spectrometry. Candidates were selected before confirmatory targeted Multiple Reaction Monitoring LCMS/MS analysis was completed. Functional assays were performed. b Venn diagram indicating how many proteins were detected uniquely in the supernatant and pellet fractions and how many overlapped. c Heat map of alpha-synuclein expression as fold change in Braak stage 3/4 compared to control indicated by colour. Red indicated upregulation and green downregulation compared to controls with deeper colour indicating a higher level of change. White indicates no change in expression compared to controls. d Overall change in the brain proteome for each region and condition expressed as a percentage of total proteome either upregulated (red) or downregulated (green) by more than 1.5 fold. S represents the supernatant fraction and P represents the pellet fraction. Graph created in GraphPad Prism v8
Fig. 3
Fig. 3
Pathway analysis of proteomics. Heatmap from IPA software showing the most significantly altered canonical pathways found in a the first mass spectrometry dataset and b the second mass spectrometry dataset with Mitochondrial dysfunction the top pathway significantly altered across all regions in Braak stage 3/4 compared to controls and in both datasets. The p-value is indicated by purple colour. The deeper the colour the lower the p-value
Fig. 4
Fig. 4
Validation of increased mitochondrial proteins in PD cases using multiple reaction monitoring LC–MS/MS. Graphs highlighting differences in fold change as a ratio against internal standard an for multiple mitochondrial proteins in the parahippocampus, o metallothionein-2 across the putamen, parahippocampus, cingulate cortex and frontal cortex, and p mitochondrial 2-oxoglutarate malate carrier across the putamen, parahippocampus and cingulate cortex. Regions are colour-coded for severity of pathology present at that stage of disease as shown in key. T-tests were done for each pairing and statistically significant results at p < 0.05 are highlighted on the graphs. Graphs and statistics completed with GraphPad Prism v8
Fig. 5
Fig. 5
Principle component plot of Synapt G2-Si data. Variation is accounted primarily by brain region. Sub region variation can be observed between late PD and control and early PD but no overall proteomic variation is observed between control and early PD indicating the changes are subtle. Each brain region is mapped on hemi-dissected hemisphere and coronal slice, in its respective annotated colour
Fig. 6
Fig. 6
Mitochondrial analysis of label free proteomic data. Oxidative phosphorylation pathway diagram with per region overlay of proteomic expression for the putamen and frontal cortex in early PD compared to controls, a and late PD compared to controls, e. Red represents upregulation and green represents downregulation. Intensity of colour indicates level of altered expression. b, f Complex proteins totalled and ratioed to citrate synthase across brain regions and disease stages. Two-way ANOVA with Sidek’s multiple comparison post-hoc testing was performed for each complex/citrate synthase and statistically significant results are demonstrated on graphs with * representing p < 0.03, ** representing p < 0.002, *** representing p < 0.0002 and **** representing p < 0.0001. Bars represent SEM. c, g Table indicating the % of significantly altered proteins per pathway for the sub-functions of the mitochondria as determined through Mitominer and Panther. Regions are colour-coded for severity of pathology present at that stage of disease as shown in key. d HADHB and ACAT1 expression across multiple brain regions, Graphs and statistics were completed using GraphPad Prism v8
Fig. 6
Fig. 6
Mitochondrial analysis of label free proteomic data. Oxidative phosphorylation pathway diagram with per region overlay of proteomic expression for the putamen and frontal cortex in early PD compared to controls, a and late PD compared to controls, e. Red represents upregulation and green represents downregulation. Intensity of colour indicates level of altered expression. b, f Complex proteins totalled and ratioed to citrate synthase across brain regions and disease stages. Two-way ANOVA with Sidek’s multiple comparison post-hoc testing was performed for each complex/citrate synthase and statistically significant results are demonstrated on graphs with * representing p < 0.03, ** representing p < 0.002, *** representing p < 0.0002 and **** representing p < 0.0001. Bars represent SEM. c, g Table indicating the % of significantly altered proteins per pathway for the sub-functions of the mitochondria as determined through Mitominer and Panther. Regions are colour-coded for severity of pathology present at that stage of disease as shown in key. d HADHB and ACAT1 expression across multiple brain regions, Graphs and statistics were completed using GraphPad Prism v8
Fig. 7
Fig. 7
Early stage PD overlap against Late stage PD. Pie charts show the number of GO terms (Biological processes, molecular functions or cellular components) that are overlapping between early PD (Braak stage 3/4) and late stage PD (Braak stage 6) in either the putamen, a region moderately affected at Braak stage 3/4 but severely affected at Braak stage 6, and the frontal cortex, a region not affected at Braak stage 3/4 but mildly affected at Braak stage 6. Colour coded for severity of pathology present at that stage of disease as shown in key
Fig. 8
Fig. 8
Mitochondrial assays show altered mitochondrial function in early affected regions. Functional mitochondrial assays across the putamen, parahippocampus, frontal cortex and parietal cortex for a Complex I, b Complex II, c Complex II/III and d Complex IV. All are normalised to citrate synthase levels and the ArcSin (ASIN) of data used for statistical analysis. Regions are colour-coded for severity of pathology present at that stage of disease as shown in key. Mann–Whitney U-tests were performed with * representing p < 0.03, ** representing p < 0.002, *** representing p < 0.0002 and **** representing p < 0.0001. Error bars represent SEM. Graphs and statistics were completed using GraphPad Prism v8
Fig. 9
Fig. 9
Progression of mitochondrial protein expression changes through the early PD brain. Schematic showing how mitochondrial proteins change in expression through the areas of the brain that are affected by alpha-synuclein pathology in early stage PD. Green represents downregulated proteins and red represents upregulated proteins when compared to controls. Arrows represent severity of the pathology across regions of the brain. Middle brain image represents how the pathology has spread through the brain at Braak stage 3/4 (adapted from [85]) Mitochondrial expression diagrams were made using IPA software. Figure made with biorender.com

Similar articles

Cited by

References

    1. Hou Y, Dan X, Babbar M, et al. Ageing as a risk factor for neurodegenerative disease. Nat Rev Neurol. 2019;15:565–581. doi: 10.1038/s41582-019-0244-7. - DOI - PubMed
    1. GBD (2015) Neurological disorders collaborator group (2017) Global, regional, and national burden of neurological disorders during 1990–2015: a systematic analysis for the Global Burden of Disease Study 2015. Lancet Neurol, 16:877–897, 10.1016/S1474-4422(17)30299-5 - PMC - PubMed
    1. McCann H, Stevens CH, Cartwright H, Halliday GM. α-Synucleinopathy phenotypes. Parkinsonism Relat Disord. 2014;20(Suppl 1):S62–S67. doi: 10.1016/S1353-8020(13)70017-8. - DOI - PubMed
    1. Shahmoradian SH, Lewis AJ, Genoud C, et al. Lewy pathology in Parkinson’s disease consists of crowded organelles and lipid membranes. Nat Neurosci. 2019;22:1099–1109. doi: 10.1038/s41593-019-0423-2. - DOI - PubMed
    1. Braak H, Tredici KD, Rüb U, et al. Staging of brain pathology related to sporadic Parkinson’s disease. Neurobiol Aging. 2003;24:197–211. doi: 10.1016/S0197-4580(02)00065-9. - DOI - PubMed

Publication types