. 2022 Aug 25;23(17):9655.
doi: 10.3390/ijms23179655.

cAMP/PKA Signaling Modulates Mitochondrial Supercomplex Organization

Affiliations

cAMP/PKA Signaling Modulates Mitochondrial Supercomplex Organization

Anna Signorile et al. Int J Mol Sci. .

Abstract

The oxidative phosphorylation (OXPHOS) system couples the transfer of electrons to oxygen with pumping of protons across the inner mitochondrial membrane, ensuring the ATP production. Evidence suggests that respiratory chain complexes may also assemble into supramolecular structures, called supercomplexes (SCs). The SCs appear to increase the efficiency/capacity of OXPHOS and reduce the reactive oxygen species (ROS) production, especially that which is produced by complex I. Studies suggest a mutual regulation between complex I and SCs, while SCs organization is important for complex I assembly/stability, complex I is involved in the supercomplex formation. Complex I is a pacemaker of the OXPHOS system, and it has been shown that the PKA-dependent phosphorylation of some of its subunits increases the activity of the complex, reducing the ROS production. In this work, using in ex vivo and in vitro models, we show that the activation of cAMP/PKA cascade resulted in an increase in SCs formation associated with an enhanced capacity of electron flux and ATP production rate. This is also associated with the phosphorylation of the NDUFS4 subunit of complex I. This aspect highlights the key role of complex I in cellular energy production.

Keywords: NDUFS4; cAMP/PKA; complex I; mitochondria; mitochondrial supercomplexes.


Conflict of interest statement

The authors declare no conflict of interest.

Figures

Figure 1
Figure 1
Effect of isoproterenol treatment on activity of mitochondrial respiratory chain complexes. The H9c2 cell cultures were incubated for 30 min in absence (CTRL) or in the presence of 1 µM isoproterenol (ISO). The activities of complexes I (CxI), III (CxIII), IV (CxIV) and I + III (CxI/III) were measured spectrophotometrically. The scatter bar graphs represent the means ± standard deviation (SD). CTRL vs. ISO, * p < 0.05, *** p < 0.001, Student’s t-test.
Figure 2
Figure 2
Effect of isoproterenol treatment on oxygen consumption rates, ATP level, ATP production rate and efficiency. The H9c2 cell cultures were incubated in absence (CTRL) or in the presence of isoproterenol (ISO). (A) The scatter bar graphs represent the mitochondrial ATP level determined as result of total ATP level minus ATP level in the presence of oligomycin. (B) The scatter bar graphs represent the oxygen consumption rates measured in intact cells (endogenous). (C) The scatter bar graphs represent the oxygen consumption rates in digitonin-permeabilized cells supplemented with ADP and pyruvate plus malate (P/M) or succinate (SUCC) as respiratory substrates (State 3). (D) The scatter bar graphs represent the mitochondrial ATP production rates measured in the presence of P/M or SUCC. (E) The scatter bar graphs represent the P/O ratio measured in the presence of P/M or SUCC. The data represent the means ± SD of at least five different experiments except for succinate (four determinations). ISO vs. CTRL, * p < 0.05, ** p < 0.01, Student’s t-test.
Figure 3
Figure 3
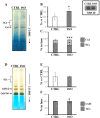
Isoproterenol increased the activities of complex I and complex IV in supercomplexes. The H9c2 cell cultures were incubated for 30 min in absence (CTRL) or in the presence of 1 µM isoproterenol (ISO). Mitochondrial solubilized proteins were prepared as described in Materials and Methods and separated by 1D-BNE PAGE followed by in-gel activity assay. (A) Representative image of in gel-activity assay for complex I. (B) The histograms represent the percentage value of arbitrary densitometric units (ADU) of complex I activity-stained bands of ISO treated cells with respect to CTRL cells. (C) The histograms represent the percentage of ADU of complex I activity-stained bands referring to free complex I (CxI) and supercomplexes (SCs) in each lane. (D) Representative image of in-gel activity assay for complex IV. (E) The histograms represent the percentage value of ADU of complex IV activity-stained bands of ISO treated cells with respect to CTRL cells. (F) The histograms represent the percentage of ADU of complex IV activity-stained bands referring to free complex IV (CxIV) and SCs in each lane. The values are the means ± SD of three different experiments. (ISO vs. CTRL, * p < 0.05, *** p < 0.001, Student’s t-test). In the inset, a representative image of immunoblotting with antibody against TOM20 performed for the protein loading control of CTRL and ISO samples. For other details, see under Material and Methods.
Figure 4
Figure 4
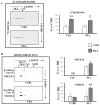
Isoproterenol increased supercomplexes containing complex I, complex III and complex IV. The H9c2 cell cultures were incubated for 30 min in absence (CTRL) or in the presence of isoproterenol (ISO). Mitochondrial solubilized proteins were separated by 1D-BNE/2D-SDS-PAGE and transferred into nitrocellulose membrane, followed by immunoblotting analysis with specific antibodies. (A) Representative images of immunoblotting with antibody against NDUFS4. (B) Representative images of immunoblotting with antibodies against Core II and β-ATP synthase. (C) Representative images of immunoblotting with antibody against Cox IV. (AC) the histograms represent the percentage of ADU of isoproterenol-treated cells (ISO) with respect to untreated cells (CTRL) of immuno-revealed spots in free complexes (CxI, CxIII, CxIV) and in supercomplexes (SCs). The values are the means ± SD of three different experiments. (ISO vs. CTRL, *** p < 0.001, Student’s t-test). For more details, see under Materials and Methods.
Figure 5
Figure 5
PKA addition to the mitochondrial import experiments increased the incorporation of [35S]-Met labeled NDUFS4 in supercomplexes. Mitochondrial import experiments were performed in absence (CTRL) and in the presence of PKA (1 unit per 10 μg mitochondrial proteins) plus 7.5 mM sodium fluoride. After 60 min incubation at 30 °C, mitochondria were spun down from the import mixture after trypsin treatment (1 μg/50 μg mitochondrial proteins, 35 min on ice). The solubilized pellets were analyzed by 1D-BNE and transferred into nitrocellulose. (A) Representative image of autoradiography of import experiment with RRL translation mixtures containing the newly synthesized [35S]-Met labeled NDUFS4 protein. (B) Representative image of immunoblotting analysis with a specific antibody against the NDUFB6 subunit of complex I of import experiment with RRL translation mixtures containing the newly synthesized [35S]-Met labeled NDUFS4 protein. (C) Representative image of immunoblotting analysis with a specific antibody against the NDUFB6 subunit of complex I of import experiment with RRL translation mixtures without the newly synthesized [35S]-Met labeled NDUFS4 protein. The histograms represent the percentage of ADU of PKA-treated samples with respect to untreated samples (CTRL) of radioactive bands ([35S]-Met NDUFS4) and immuno-revealed bands (NDUFB6) in free complex I (CxI) and in SCs. The values are the means ± SD of three different experiments. (PKA vs. CTRL, * p < 0.05, *** p < 0.001, Student’s t-test). The insets represent the loading controls performed using TOM 70 antibody after the SDS-PAGE. For more details, see under Materials and Methods.
Figure 6
Figure 6
PKA addition to mitochondrial import experiments increased supercomplexes containing complex I and complex III. RRL translation mixture containing the newly synthesized [35S]-Met labeled NDUFS4 protein was added to the import mixture containing RLM in absence (CTRL) and in the presence of PKA. After 60 min incubation at 30 °C, mitochondria were spun down. The solubilized pellets were analyzed by 1D-BNE/2D-SDS PAGE. (A) Representative images of autoradiography. The histograms represent the percentage of ADU of autoradiography revealed spots ([35S]-Met NDUFS4) in free complex I (CxI) and in supercomplexes (SCs) of PKA-treated samples with respect to untreated cells (CTRL). The complex alignment of radioactive spots was performed by using first dimension radioactive bands of the same lanes. (B) Representative images of immunoblotting analysis with antibodies specified in the figure. The histograms represent the percentage of ADU of PKA-treated samples with respect to untreated cells (CTRL) of immuno-revealed spots by antibodies against NDUFA9 and CORE II in free complex I (CxI) and complex III (CxIII) and in supercomplexes (SCs). The complex alignment of immuno-revealed spots was performed by using the β-subunit antibody revealing the dimeric form of ATP synthase (DCxV). The values are the means ± SD of three different experiments. (PKA vs. CTRL, * p < 0.05, ** p < 0.01, Student’s t-test). For more details, see under Materials and Methods.
Figure 7
Figure 7
PKA addition to mitochondrial import experiments increased the activity of complex I and complex I/III. RRL translation mixtures containing newly synthesized [35S]-Met labeled NDUFS4 protein or [35S]-Met-labeled NDUB11 protein or no protein present (Blank) were added to the import mixture containing RLM in absence and in the presence of PKA. After 60 min incubation at 30 °C, mitochondria were spun down from the import mixture and used for spectrophotometric analysis. (A) Activity of complex I (NADH-UQ oxidoreductase). (B) Activity of complex III (ubiquinol-cytochrome c oxidoreductase). (C) Activity of complex I/III (NADH-cytochrome c oxidoreductase). The values are the means ± SD of three different experiments. (NDUFS4 + PKA vs. NDUFS4, * p < 0.05, ** p < 0.01, Student’s t-test). For more details, see under Materials and Methods.
Figure 8
Figure 8
PKA addition to mitochondrial import experiments increased the complex I-supporting respiration. RRL translation mixtures containing newly synthesized [35S]-Met-labeled NDUFS4 protein or no protein present (Blank) were added to the import mixture containing RLM in absence and in the presence of PKA. After 60 min incubation at 30 °C, mitochondria were spun down from the import mixture and used to measure the oxygen consumption rates. (A) Oxygen consumption rates using pyruvate/malate (P/M) as substrate. (B) Oxygen consumption rates using succinate as substrate. The values are the means ± SD of three different experiments. (NDUFS4 + PKA vs. NDUFS4, * p < 0.05, Student’s t-test). For more details, see under Materials and Methods.

References

    1. Efremov R.G., Baradaran R., Sazanov L.A. The Architecture of Respiratory Complex I. Nature. 2010;465:441–445. doi: 10.1038/nature09066. - DOI - PubMed
    1. Papa S., Martino P.L., Capitanio G., Gaballo A., De Rasmo D., Signorile A., Petruzzella V. The Oxidative Phosphorylation System in Mammalian Mitochondria. Adv. Exp. Med. Biol. 2012;942:3–37. doi: 10.1007/978-94-007-2869-1_1. - DOI - PubMed
    1. Schägger H., Pfeiffer K. Supercomplexes in the Respiratory Chains of Yeast and Mammalian Mitochondria. EMBO J. 2000;19:1777–1783. doi: 10.1093/emboj/19.8.1777. - DOI - PMC - PubMed
    1. Rugolo M., Zanna C., Ghelli A.M. Organization of the Respiratory Supercomplexes in Cells with Defective Complex III: Structural Features and Metabolic Consequences. Life. 2021;11:351. doi: 10.3390/life11040351. - DOI - PMC - PubMed
    1. Cogliati S., Cabrera-Alarcón J.L., Enriquez J.A. Regulation and Functional Role of the Electron Transport Chain Supercomplexes. Biochem. Soc. Trans. 2021;49:2655–2668. doi: 10.1042/BST20210460. - DOI - PMC - PubMed

MeSH terms

Substances

Grants and funding

LinkOut - more resources