. 2022 Aug 26;23(17):9684.
doi: 10.3390/ijms23179684.

mPR-Specific Actions Influence Maintenance of the Blood-Brain Barrier (BBB)

Affiliations

mPR-Specific Actions Influence Maintenance of the Blood-Brain Barrier (BBB)

Johnathan Abou-Fadel et al. Int J Mol Sci. .

Abstract

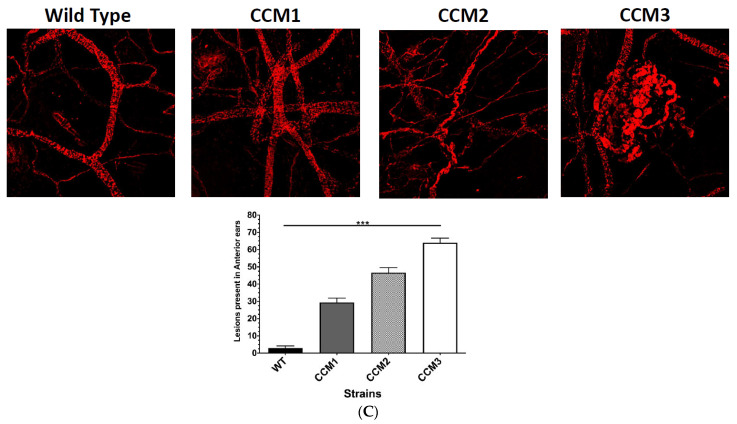
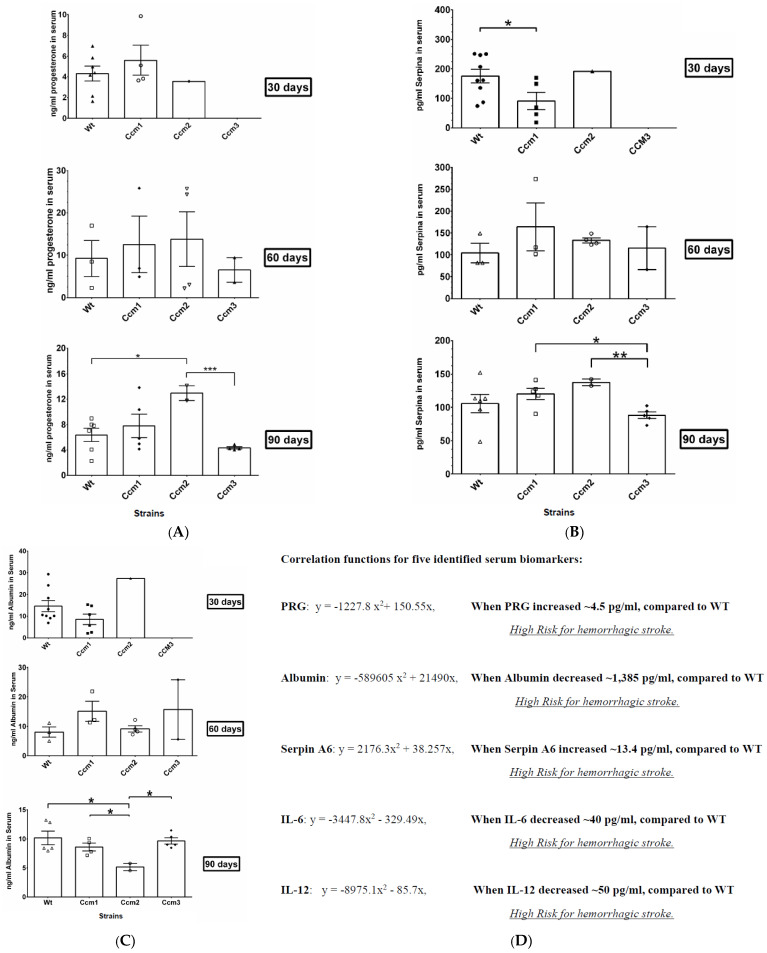
Cerebral cavernous malformations (CCMs) are characterized by abnormally dilated intracranial microvascular sinusoids that result in increased susceptibility to hemorrhagic stroke. It has been demonstrated that three CCM proteins (CCM1, CCM2, and CCM3) form the CCM signaling complex (CSC) to mediate angiogenic signaling. Disruption of the CSC will result in hemorrhagic CCMs, a consequence of compromised blood-brain barrier (BBB) integrity. Due to their characteristically incomplete penetrance, the majority of CCM mutation carriers (presumed CCM patients) are largely asymptomatic, but when symptoms occur, the disease has typically reached a clinical stage of focal hemorrhage with irreversible brain damage. We recently reported that the CSC couples both classic (nuclear; nPRs) and nonclassic (membrane; mPRs) progesterone (PRG)-receptors-mediated signaling within the CSC-mPRs-PRG (CmP) signaling network in nPR(-) breast cancer cells. In this report, we demonstrate that depletion of any of the three CCM genes or treatment with mPR-specific PRG actions (PRG/mifepristone) results in the disruption of the CmP signaling network, leading to increased permeability in the nPR(-) endothelial cells (ECs) monolayer in vitro. Finally, utilizing our in vivo hemizygous Ccm mutant mice models, we demonstrate that depletion of any of the three CCM genes, in combination with mPR-specific PRG actions, is also capable of leading to defective homeostasis of PRG in vivo and subsequent BBB disruption, allowing us to identify a specific panel of etiological blood biomarkers associated with BBB disruption. To our knowledge, this is the first report detailing the etiology to predict the occurrence of a disrupted BBB, an indication of early hemorrhagic events.

Keywords: CCM signaling complex (CSC); CSC-mPRs-PRG (CmP) signaling network; biomarkers; blood–brain barrier (BBB); cerebral cavernous malformations (CCMs); classic nuclear progesterone receptors (nPRs); endothelial cells (ECs); nonclassic membrane progesterone receptors (mPRs).


Conflict of interest statement

The authors declare no conflict of interest.

Figures

Figure 1
Figure 1
Relationships among key players (CCMs and mPRs) within the CmP network in nPR(−) endothelial cells (ECs). (A) Silencing of CCM2 decreases the expression levels of both CCM 1/3 proteins in human brain microvascular endothelial cells (HBMVEC). (A-1) After silencing all three CCMs (1, 2, or 3) for 48 h, the expression levels of all three CCM proteins were efficiently targeted and silenced; however, significantly decreased expression of both CCM1/3 proteins was observed in CCM2-KD HBMVEC cells (left upper and lower panels). The relative expression levels of CCMs (1, 2, or 3) proteins were measured through quantification of band intensities and normalized against α-actinin (ACTN1) followed by SC controls (red line), and illustrated with bar plots where light gray bars represent no change and dark gray bars display decreased relative protein levels (right panel) (n = 3). (A-2) Significantly increased RNA levels of CCM2 isoforms in both CCM1-KD and CCM3-KD in HBMVEC cells were observed. The relative transcription expression changes in CCM1, CCM3, and 5 isoforms of CCM2 in CCMs KD HBMVEC cells were measured by RT-qPCR (Fold) and illustrated in the bar plots, where light gray bars represent the relative RNA levels of CCM1, dark gray bars display relative RNA levels of CCM2 isoforms, and black bars for the relative RNA levels of CCM3 (n = 3). (B) Impacts of mPR-specific actions on the RNA expression of CCM2 isoforms and mPRs in human microvascular endothelial cells. (B-1) Under mPR-specific PRG actions (PRG + MIF) for 48 h, enhanced RNA expression levels of most CCM2 isoforms were observed in both human dermal microvascular endothelial cells (HDMVEC) and human brain microvascular endothelial cells (HBMVEC) cells, while increased RNA expression levels of CCM1/3 were only observed in HBMVECs (n = 3). (B-2) Significantly increased RNA expression of PAQR5/7/8 and PGRMC1 was observed under mPR-specific PRG actions in HBMVECs and human umbilical vein endothelial cells (HUVECs) for 48 h, while only increased RNA expression of PAQR7/8 was observed in HDMVECs, suggesting RNA expression of most mPRs can be dramatically enhanced under mPR-specific PRG actions (n = 3). (C) Impacts of mPR-specific actions on the protein expression of mPRα (PAQR7) in HDMVECs. After silencing all three CCM genes for 48 h, decreased protein expression levels of PAQR7 were observed for all 3 Ccms-KD conditions (n = 3). (D) Impacts of mPR-specific actions on protein expression levels of CCM1/3 in human microvascular endothelial cells (HDMVECs, HUVECs, and HBMVECs) and rat brain microvascular endothelial cells (RBMVECs), compared to mifepristone only (MIF, 20 µM) or vehicle controls (VEH). The relative RNA expression levels were measured through RT-qPCR from at least three different experiments (triplicates per experiment) and normalized to housekeeping gene (ACTB) and scramble control. The relative protein expression levels were measured through quantification of band intensities of targeted proteins by Western blots, subtracted from the surrounding background and normalized against control housekeeping proteins followed by vehicle controls. In all bar plots, the red line is the control baseline for fold change measurements (−/+). ++, +++ above bar indicates p ≤ 0.001 for paired t-test.
Figure 1
Figure 1
Relationships among key players (CCMs and mPRs) within the CmP network in nPR(−) endothelial cells (ECs). (A) Silencing of CCM2 decreases the expression levels of both CCM 1/3 proteins in human brain microvascular endothelial cells (HBMVEC). (A-1) After silencing all three CCMs (1, 2, or 3) for 48 h, the expression levels of all three CCM proteins were efficiently targeted and silenced; however, significantly decreased expression of both CCM1/3 proteins was observed in CCM2-KD HBMVEC cells (left upper and lower panels). The relative expression levels of CCMs (1, 2, or 3) proteins were measured through quantification of band intensities and normalized against α-actinin (ACTN1) followed by SC controls (red line), and illustrated with bar plots where light gray bars represent no change and dark gray bars display decreased relative protein levels (right panel) (n = 3). (A-2) Significantly increased RNA levels of CCM2 isoforms in both CCM1-KD and CCM3-KD in HBMVEC cells were observed. The relative transcription expression changes in CCM1, CCM3, and 5 isoforms of CCM2 in CCMs KD HBMVEC cells were measured by RT-qPCR (Fold) and illustrated in the bar plots, where light gray bars represent the relative RNA levels of CCM1, dark gray bars display relative RNA levels of CCM2 isoforms, and black bars for the relative RNA levels of CCM3 (n = 3). (B) Impacts of mPR-specific actions on the RNA expression of CCM2 isoforms and mPRs in human microvascular endothelial cells. (B-1) Under mPR-specific PRG actions (PRG + MIF) for 48 h, enhanced RNA expression levels of most CCM2 isoforms were observed in both human dermal microvascular endothelial cells (HDMVEC) and human brain microvascular endothelial cells (HBMVEC) cells, while increased RNA expression levels of CCM1/3 were only observed in HBMVECs (n = 3). (B-2) Significantly increased RNA expression of PAQR5/7/8 and PGRMC1 was observed under mPR-specific PRG actions in HBMVECs and human umbilical vein endothelial cells (HUVECs) for 48 h, while only increased RNA expression of PAQR7/8 was observed in HDMVECs, suggesting RNA expression of most mPRs can be dramatically enhanced under mPR-specific PRG actions (n = 3). (C) Impacts of mPR-specific actions on the protein expression of mPRα (PAQR7) in HDMVECs. After silencing all three CCM genes for 48 h, decreased protein expression levels of PAQR7 were observed for all 3 Ccms-KD conditions (n = 3). (D) Impacts of mPR-specific actions on protein expression levels of CCM1/3 in human microvascular endothelial cells (HDMVECs, HUVECs, and HBMVECs) and rat brain microvascular endothelial cells (RBMVECs), compared to mifepristone only (MIF, 20 µM) or vehicle controls (VEH). The relative RNA expression levels were measured through RT-qPCR from at least three different experiments (triplicates per experiment) and normalized to housekeeping gene (ACTB) and scramble control. The relative protein expression levels were measured through quantification of band intensities of targeted proteins by Western blots, subtracted from the surrounding background and normalized against control housekeeping proteins followed by vehicle controls. In all bar plots, the red line is the control baseline for fold change measurements (−/+). ++, +++ above bar indicates p ≤ 0.001 for paired t-test.
Figure 2
Figure 2
mPR-specific actions on nPR(+/−) ECs increases microvascular permeability in vitro. Two different EC lines, nPR(+) EAhy926 ECs, derived from HUVECs, and nPR(−) RBMVECs, were used to measure in vitro permeability with the passage of FITC-conjugated dextran under vehicle and various steroid treatments. (A). Impact of sex-steroid-induced mPR-specific actions on the permeability of both nPR(+/−) ECs. Both nPR(+/−) ECs were under sex steroid treatments (PRG (20 µM), MIF (20 µM), and PRG + MIF, (20 µM each)) plated on either uncoated (top panels) or collagen-I coated wells (bottom panels). Although increased levels of permeability were initially observed in both ECs (on Collagen-I coated wells, bottom panels), the permeability of nPR(+) EAhy926 ECs was back to normal after 12 h (bottom right panel), while the permeability was continuously enhanced among all sex hormone treatments for RBMVECs (bottom left panel) on Collagen-I coated wells. Interestingly, permeability remained continuously enhanced among all sex hormone treatments for RBMVECs, when cultured in the absence of collagen-I (upper left panel), while the permeability of nPR(+) EAhy926 ECs did not return to normal until after 48 h (upper right panel), suggesting crosstalk between integrin and PRG-receptors-mediated signaling cascades in nPR(+) EAhy926 ECs, but not in nPR(−) RBMVECs. Four treatments are Vehicle, PRG, MIF, and PRG + MIF sequentially. (B). Impact of neurosteroids-induced mPR-specific actions on the permeability of both nPR(+/−) ECs.Both nPR(+/−) ECs treated with two common neurosteroids synthesized from PRG (or PRG metabolites), Allopregnanolone (3a-hydroxy-5a-pregnan-20-one, ALLO, 20 µM) and Pregnanolone (3a-hydroxy-5b-pregnan-20-one, P5, 20 µM), were plated on collagen-I coated wells, and the EC permeability was continuously monitored and measured as aforementioned. (C). The summarized feedback regulatory mechanism within the CmP signaling network under mPR-specific PRG actions for nPR(−) ECs. Yellow line separates transcriptional and translational levels. The + symbols represent enhancement, and symbols represent inhibition of the expression of targeted genes/proteins. Red-colored symbols/lines represent positive effects of mPR-specific PRG treatment (PRG + MIF), and blue-colored symbols/lines represent negative effects of treatment. Dark-green-colored letters indicate the direct supporting data generated from this work. Arrow indicates effect direction, solid line is the direct impact, and dotted line is indirect effects. The fluorescence intensity of FITC-dextran was measured using a 96-multiwell fluorescent plate reader. In all bar plots, *, **, and *** above any bar graph indicate p ≤ 0.05, 0.01, and 0.001, respectively, using two-way ANOVA with Holm–Sidak’s multiple comparison correction.
Figure 2
Figure 2
mPR-specific actions on nPR(+/−) ECs increases microvascular permeability in vitro. Two different EC lines, nPR(+) EAhy926 ECs, derived from HUVECs, and nPR(−) RBMVECs, were used to measure in vitro permeability with the passage of FITC-conjugated dextran under vehicle and various steroid treatments. (A). Impact of sex-steroid-induced mPR-specific actions on the permeability of both nPR(+/−) ECs. Both nPR(+/−) ECs were under sex steroid treatments (PRG (20 µM), MIF (20 µM), and PRG + MIF, (20 µM each)) plated on either uncoated (top panels) or collagen-I coated wells (bottom panels). Although increased levels of permeability were initially observed in both ECs (on Collagen-I coated wells, bottom panels), the permeability of nPR(+) EAhy926 ECs was back to normal after 12 h (bottom right panel), while the permeability was continuously enhanced among all sex hormone treatments for RBMVECs (bottom left panel) on Collagen-I coated wells. Interestingly, permeability remained continuously enhanced among all sex hormone treatments for RBMVECs, when cultured in the absence of collagen-I (upper left panel), while the permeability of nPR(+) EAhy926 ECs did not return to normal until after 48 h (upper right panel), suggesting crosstalk between integrin and PRG-receptors-mediated signaling cascades in nPR(+) EAhy926 ECs, but not in nPR(−) RBMVECs. Four treatments are Vehicle, PRG, MIF, and PRG + MIF sequentially. (B). Impact of neurosteroids-induced mPR-specific actions on the permeability of both nPR(+/−) ECs.Both nPR(+/−) ECs treated with two common neurosteroids synthesized from PRG (or PRG metabolites), Allopregnanolone (3a-hydroxy-5a-pregnan-20-one, ALLO, 20 µM) and Pregnanolone (3a-hydroxy-5b-pregnan-20-one, P5, 20 µM), were plated on collagen-I coated wells, and the EC permeability was continuously monitored and measured as aforementioned. (C). The summarized feedback regulatory mechanism within the CmP signaling network under mPR-specific PRG actions for nPR(−) ECs. Yellow line separates transcriptional and translational levels. The + symbols represent enhancement, and symbols represent inhibition of the expression of targeted genes/proteins. Red-colored symbols/lines represent positive effects of mPR-specific PRG treatment (PRG + MIF), and blue-colored symbols/lines represent negative effects of treatment. Dark-green-colored letters indicate the direct supporting data generated from this work. Arrow indicates effect direction, solid line is the direct impact, and dotted line is indirect effects. The fluorescence intensity of FITC-dextran was measured using a 96-multiwell fluorescent plate reader. In all bar plots, *, **, and *** above any bar graph indicate p ≤ 0.05, 0.01, and 0.001, respectively, using two-way ANOVA with Holm–Sidak’s multiple comparison correction.
Figure 3
Figure 3
mPR-specific actions on nPR(−) ECs are sufficient for blood–brain barrier (BBB) disruption and formation of subcutaneous lesions in vivo. Hemizygous Ccms (1, 2, and 3) mutants and WT (C57 BL/6 J) mice were injected with mPR-specific PRG treatment (a cocktail of PRG + MIF, 100 mg/kg body weight) in peanut oil (vehicle), 5 days a week for 30, 60, and 90 days, respectively. (A) BBB permeability was significantly increased only in our 90-day treatment groups for all 3 Ccm mutants, demonstrating that increased microvascular permeability in the brain is associated with a combination of chronic exposure to mPR-specific PRG actions and Ccm deficiency. (B) Subcutaneous vessel diameters in posterior sections of ears were classified into four subgroups based on the range of the vessel size (diameters): group-I (8–9 µM), group-II (9–10 µM), group-III (10–11 µM), and group-IV (11–12 µM). Significantly decreased percentage of vessels was found in Ccm2/Ccm3 within group-I (8–9 µM), compared to WT in the 90-day treatment group, suggesting that more vessels in Ccm2/Ccm3 mutants are distributed in larger diameter groups under mPR-specific PRG actions. Indeed, the significantly increased percentage of larger vessels in Ccm3 mutant was found in group-II (9–10 µM) compared to WT, and Ccm2 is the only mutant to display vessels in the largest size group, group-IV (11–12 µM) under mPR-specific PRG actions. (C) Subcutaneous vessel lesions in the anterior side of mice ears in all Ccm (1, 2, and 3) mutant strains can be visually distinguished in the 90-day treatment groups compared to WT, with Ccm3 mutant having the largest number of CCM lesions. For Evans blue assays, statistical analysis was generated using one-way ANOVA with either Kruskal–Wallis test or uncorrected Fisher’s LSD test where appropriate. All treated mice, upon completion of the last injection, were injected with Evan’s blue dye (EBD) (500 µG/25 G mouse) which was allowed to circulate for 3 h. Fluorescence data were then measured from the homogenized brain tissue and converted to µg/mL based on standard curves generated in the extraction buffer, and normalized based off the tissue weight (µg Evans blue/mg tissue) followed by controls. In ear tissues, statistical significance was performed using unpaired Student’s t-test (*, ** and *** above graphs indicate p ≤ 0.05, 0.01, and 0.001, respectively).
Figure 3
Figure 3
mPR-specific actions on nPR(−) ECs are sufficient for blood–brain barrier (BBB) disruption and formation of subcutaneous lesions in vivo. Hemizygous Ccms (1, 2, and 3) mutants and WT (C57 BL/6 J) mice were injected with mPR-specific PRG treatment (a cocktail of PRG + MIF, 100 mg/kg body weight) in peanut oil (vehicle), 5 days a week for 30, 60, and 90 days, respectively. (A) BBB permeability was significantly increased only in our 90-day treatment groups for all 3 Ccm mutants, demonstrating that increased microvascular permeability in the brain is associated with a combination of chronic exposure to mPR-specific PRG actions and Ccm deficiency. (B) Subcutaneous vessel diameters in posterior sections of ears were classified into four subgroups based on the range of the vessel size (diameters): group-I (8–9 µM), group-II (9–10 µM), group-III (10–11 µM), and group-IV (11–12 µM). Significantly decreased percentage of vessels was found in Ccm2/Ccm3 within group-I (8–9 µM), compared to WT in the 90-day treatment group, suggesting that more vessels in Ccm2/Ccm3 mutants are distributed in larger diameter groups under mPR-specific PRG actions. Indeed, the significantly increased percentage of larger vessels in Ccm3 mutant was found in group-II (9–10 µM) compared to WT, and Ccm2 is the only mutant to display vessels in the largest size group, group-IV (11–12 µM) under mPR-specific PRG actions. (C) Subcutaneous vessel lesions in the anterior side of mice ears in all Ccm (1, 2, and 3) mutant strains can be visually distinguished in the 90-day treatment groups compared to WT, with Ccm3 mutant having the largest number of CCM lesions. For Evans blue assays, statistical analysis was generated using one-way ANOVA with either Kruskal–Wallis test or uncorrected Fisher’s LSD test where appropriate. All treated mice, upon completion of the last injection, were injected with Evan’s blue dye (EBD) (500 µG/25 G mouse) which was allowed to circulate for 3 h. Fluorescence data were then measured from the homogenized brain tissue and converted to µg/mL based on standard curves generated in the extraction buffer, and normalized based off the tissue weight (µg Evans blue/mg tissue) followed by controls. In ear tissues, statistical significance was performed using unpaired Student’s t-test (*, ** and *** above graphs indicate p ≤ 0.05, 0.01, and 0.001, respectively).
Figure 4
Figure 4
Overall ex vivo angiogenic performance of nPR(−) ECs derived from dorsal aortae of Ccms mice under mPR-specific PRG actions. After euthanizing, dorsal aortae were immediately removed from Ccm1+/−, Ccm2+/−, and Ccm3+/− hemizygous mutant and WT (C57 BL/6 J) mice treated for 30, 60, or 90 days and were divided in half and placed in matrigel media supplemented with vehicle (V, DMSO + EtOH left panels) or mPR-specific PRG treatment (PM, progesterone + mifepristone, 20 µM each, right panels). Images were acquired in 2 h intervals on a Nikon Biostation CT for 72 h. After acquisition, quantification of cell numbers (measured by object counts using the NIKON elements software) was conducted on images taken at 12 (red), 24 (green), and 48 h (blue) timepoints. Quantification of de novo ECs generated from ex vivo angiogenesis (A). (A-I) Ccm1 mice displayed significantly increased cell counts at 48 h, while Ccm2 mice displayed significantly increased cell counts at 24 and 48 h when compared to WT among all 30-day PM in vivo treatment groups in vehicle matrigel media ex vivo (left panel, PM/V); the same 30-day treatment group showed a significant decrease in cell counts at 48 h in Ccm1 and Ccm2 mice compared to WT in hormone-supplemented matrigel media ex vivo, (right panel, PM/PM). (A-II) There were significant increases in cell counts at 24 h in Ccm1 and Ccm2 mice compared to WT among all 60-day treatment groups in vehicle matrigel media ex vivo (left panel), while 60-day treatment only displayed significantly increased counts at 48 h in Ccm2 mice compared to WT in mPR-specific PRG-supplemented matrigel media ex vivo (right panel). (A-III) There was a significant decrease among all 90-day treatment groups in vehicle matrigel media ex vivo at 24 h while only Ccm2 displayed significantly decreased cell counts at 48 h compared to WT (left panel); the same 90-day treatment group only displayed significant decreases in cell counts at 48 h for Ccm1 and Ccm3 strains when compared to WT in mPR-specific PRG-supplemented matrigel media ex vivo (right panel). Overall angiogenic performance of nPR(−) ECs (B). After acquisition, analysis of cell growth and migration was measured by area of ECs (using the NIKON elements software) on images taken at 12, 24, and 48 h timepoints. (B-I) ECs derived from Ccm2 mice aortae displayed significant increased growth when compared to WT among all 30-day treatment groups in vehicle matrigel media ex vivo (left panel), while 30-day treatment showed a significant decrease in angiogenesis at 48 h in Ccm1 mice compared to WT in mPR-specific PRG-supplemented matrigel media ex vivo (right panel). (B-II) There were no statistically significant differences among all 60-day treatment groups in vehicle matrigel media ex vivo (left panel), while 60-day treatment showed a significant decrease in angiogenesis at 48 h in Ccm1 mice compared to WT (same as 30 day) in mPR-specific PRG-supplemented matrigel media ex vivo (right panel). (B-III) There was a significant decrease among all 90-day treatment groups in vehicle matrigel media ex vivo at 24 and 48 h compared to WT (left panel), while 90-day treatment also showed significant decreases in angiogenesis at 24 and 48 h (excluding Ccm1 at 48 h) when compared to WT in mPR-specific PRG-supplemented matrigel media ex vivo (right panel). Cell count data were normalized by dividing cell counts by the length of the aortic vessel (μM). Angiogenesis area measurements (μm2) were normalized by dividing growth area by the area of the aortic vessel (μm2). Statistical significance was performed using two-way ANOVA (*, **, and *** above graphs indicate p ≤ 0.05, 0.01, and 0.001, respectively) and comparisons are color-coded with each time point for clarification. Each symbol represents individual mice samples, which varies by strain (n = 1–8).
Figure 4
Figure 4
Overall ex vivo angiogenic performance of nPR(−) ECs derived from dorsal aortae of Ccms mice under mPR-specific PRG actions. After euthanizing, dorsal aortae were immediately removed from Ccm1+/−, Ccm2+/−, and Ccm3+/− hemizygous mutant and WT (C57 BL/6 J) mice treated for 30, 60, or 90 days and were divided in half and placed in matrigel media supplemented with vehicle (V, DMSO + EtOH left panels) or mPR-specific PRG treatment (PM, progesterone + mifepristone, 20 µM each, right panels). Images were acquired in 2 h intervals on a Nikon Biostation CT for 72 h. After acquisition, quantification of cell numbers (measured by object counts using the NIKON elements software) was conducted on images taken at 12 (red), 24 (green), and 48 h (blue) timepoints. Quantification of de novo ECs generated from ex vivo angiogenesis (A). (A-I) Ccm1 mice displayed significantly increased cell counts at 48 h, while Ccm2 mice displayed significantly increased cell counts at 24 and 48 h when compared to WT among all 30-day PM in vivo treatment groups in vehicle matrigel media ex vivo (left panel, PM/V); the same 30-day treatment group showed a significant decrease in cell counts at 48 h in Ccm1 and Ccm2 mice compared to WT in hormone-supplemented matrigel media ex vivo, (right panel, PM/PM). (A-II) There were significant increases in cell counts at 24 h in Ccm1 and Ccm2 mice compared to WT among all 60-day treatment groups in vehicle matrigel media ex vivo (left panel), while 60-day treatment only displayed significantly increased counts at 48 h in Ccm2 mice compared to WT in mPR-specific PRG-supplemented matrigel media ex vivo (right panel). (A-III) There was a significant decrease among all 90-day treatment groups in vehicle matrigel media ex vivo at 24 h while only Ccm2 displayed significantly decreased cell counts at 48 h compared to WT (left panel); the same 90-day treatment group only displayed significant decreases in cell counts at 48 h for Ccm1 and Ccm3 strains when compared to WT in mPR-specific PRG-supplemented matrigel media ex vivo (right panel). Overall angiogenic performance of nPR(−) ECs (B). After acquisition, analysis of cell growth and migration was measured by area of ECs (using the NIKON elements software) on images taken at 12, 24, and 48 h timepoints. (B-I) ECs derived from Ccm2 mice aortae displayed significant increased growth when compared to WT among all 30-day treatment groups in vehicle matrigel media ex vivo (left panel), while 30-day treatment showed a significant decrease in angiogenesis at 48 h in Ccm1 mice compared to WT in mPR-specific PRG-supplemented matrigel media ex vivo (right panel). (B-II) There were no statistically significant differences among all 60-day treatment groups in vehicle matrigel media ex vivo (left panel), while 60-day treatment showed a significant decrease in angiogenesis at 48 h in Ccm1 mice compared to WT (same as 30 day) in mPR-specific PRG-supplemented matrigel media ex vivo (right panel). (B-III) There was a significant decrease among all 90-day treatment groups in vehicle matrigel media ex vivo at 24 and 48 h compared to WT (left panel), while 90-day treatment also showed significant decreases in angiogenesis at 24 and 48 h (excluding Ccm1 at 48 h) when compared to WT in mPR-specific PRG-supplemented matrigel media ex vivo (right panel). Cell count data were normalized by dividing cell counts by the length of the aortic vessel (μM). Angiogenesis area measurements (μm2) were normalized by dividing growth area by the area of the aortic vessel (μm2). Statistical significance was performed using two-way ANOVA (*, **, and *** above graphs indicate p ≤ 0.05, 0.01, and 0.001, respectively) and comparisons are color-coded with each time point for clarification. Each symbol represents individual mice samples, which varies by strain (n = 1–8).
Figure 5
Figure 5
The disrupted BBB is not caused by local inflammatory reactions in Ccms mutant mice. (A) Monocytes, neutrophils, large peritoneal macrophages (LPM), and small peritoneal macrophages (SPM) within the peritoneal cell populations were collected through peritoneal lavage. Quantification of percentage of (I) monocytes (CD45.2 + CD11b+ Ly6G-Ly6Chigh), (II) neutrophils (CD45.2 + CD11b+ Ly6CintLy6Ghigh), (III) LPM (CD45.2 + CD11b+ Ly6G-Ly6C- F4/80hiMHC-IIlo), and (IV) SPM (CD45.2 + CD11b+ Ly6G-Ly6C-F4/80lowMHC-IIhigh) in peritoneal lavage of mice. The percentage of monocytes and neutrophils was calculated relative to CD45+ leukocytes. Quantification of absolute number of (V) monocytes (CD45.2 + CD11b+ Ly6G-Ly6Chigh), (VI) neutrophils (CD45.2 + CD11b+ Ly6CintLy6Ghigh), (VII) LPM (CD45.2 + CD11b+ Ly6G-Ly6C- F4/80hiMHC-IIlo), and (VIII) SPM (CD45.2 + CD11b+ Ly6G-Ly6C-F4/80lowMHC-IIhigh) in peritoneal lavage of mice was performed. Dot plots show mean ± SEM (n = 3–8). The only significance that was found was with naive wildtype (untreated), which did not receive any injections. This suggests that vehicle (peanut oil) causes a local inflammatory response. (B) Lipopolysaccharide-based enzyme-linked immunosorbent assay (LPS-ELISA) was used to measure LPS concentration in mouse serum. Nearly equal amounts of low LPS in the serum of all mouse strains were observed in 30, 60, and 90-day groups with mPR-specific PRG treatment. Relatively higher amounts of nonimmunogenic LPS in Ccm3 mutant mice were constantly observed from naïve mice to the 90-day treatment group, which also indicates the irrelevance of quantity of nonimmunogenic LPS towards BBB integrity. (C) Nearly equal amounts of MCP-1 in the serum of all mice strains were observed in 30, 60, and 90-day treatment groups with mPR-specific PRG treatment but with some notable changes suggesting that MCP-1 may be influenced by either mPR-specific PRG actions or genotypes at early stages in Ccm1 mutant mice. (D) Significantly different amounts of IL-12 in the serum of mice Ccm mutant (Ccm1/2) strains were observed in 30 and 60 (Ccm1) and 90-day groups (Ccm2) under mPR-specific PRG treatment, respectively. (E) Significantly decreased amounts of IL-6 in the serum of Ccm mutant mice strains were observed in the 90-day treatment group under mPR-specific PRG actions. Although higher amounts of IL-6 were observed in Ccm2 mutants compared to WT, in the 60-day treatment groups (mPR-specific PRG actions), this trend was reversed at 90 days. Statistical significance was performed using unpaired Students t-test (*, ** above graphs indicate p ≤ 0.05, 0.01, and 0.001, respectively).
Figure 5
Figure 5
The disrupted BBB is not caused by local inflammatory reactions in Ccms mutant mice. (A) Monocytes, neutrophils, large peritoneal macrophages (LPM), and small peritoneal macrophages (SPM) within the peritoneal cell populations were collected through peritoneal lavage. Quantification of percentage of (I) monocytes (CD45.2 + CD11b+ Ly6G-Ly6Chigh), (II) neutrophils (CD45.2 + CD11b+ Ly6CintLy6Ghigh), (III) LPM (CD45.2 + CD11b+ Ly6G-Ly6C- F4/80hiMHC-IIlo), and (IV) SPM (CD45.2 + CD11b+ Ly6G-Ly6C-F4/80lowMHC-IIhigh) in peritoneal lavage of mice. The percentage of monocytes and neutrophils was calculated relative to CD45+ leukocytes. Quantification of absolute number of (V) monocytes (CD45.2 + CD11b+ Ly6G-Ly6Chigh), (VI) neutrophils (CD45.2 + CD11b+ Ly6CintLy6Ghigh), (VII) LPM (CD45.2 + CD11b+ Ly6G-Ly6C- F4/80hiMHC-IIlo), and (VIII) SPM (CD45.2 + CD11b+ Ly6G-Ly6C-F4/80lowMHC-IIhigh) in peritoneal lavage of mice was performed. Dot plots show mean ± SEM (n = 3–8). The only significance that was found was with naive wildtype (untreated), which did not receive any injections. This suggests that vehicle (peanut oil) causes a local inflammatory response. (B) Lipopolysaccharide-based enzyme-linked immunosorbent assay (LPS-ELISA) was used to measure LPS concentration in mouse serum. Nearly equal amounts of low LPS in the serum of all mouse strains were observed in 30, 60, and 90-day groups with mPR-specific PRG treatment. Relatively higher amounts of nonimmunogenic LPS in Ccm3 mutant mice were constantly observed from naïve mice to the 90-day treatment group, which also indicates the irrelevance of quantity of nonimmunogenic LPS towards BBB integrity. (C) Nearly equal amounts of MCP-1 in the serum of all mice strains were observed in 30, 60, and 90-day treatment groups with mPR-specific PRG treatment but with some notable changes suggesting that MCP-1 may be influenced by either mPR-specific PRG actions or genotypes at early stages in Ccm1 mutant mice. (D) Significantly different amounts of IL-12 in the serum of mice Ccm mutant (Ccm1/2) strains were observed in 30 and 60 (Ccm1) and 90-day groups (Ccm2) under mPR-specific PRG treatment, respectively. (E) Significantly decreased amounts of IL-6 in the serum of Ccm mutant mice strains were observed in the 90-day treatment group under mPR-specific PRG actions. Although higher amounts of IL-6 were observed in Ccm2 mutants compared to WT, in the 60-day treatment groups (mPR-specific PRG actions), this trend was reversed at 90 days. Statistical significance was performed using unpaired Students t-test (*, ** above graphs indicate p ≤ 0.05, 0.01, and 0.001, respectively).
Figure 6
Figure 6
Perturbation of homeostasis of PRG is associated with BBB disruption. (A) No obvious differences in PRG levels in mice serum were observed in the 30-day treatment groups (upper panel). Interestingly, free-circulating PRG levels in the mice serum have an overall two-fold increase among all treated genotypes in the 60-day treatment groups (although not statistically significant, middle panel). In the 90-day treatment groups, free-circulating PRG levels regressed to normal ranges; however, free-circulating PRG levels in Ccm2 mutant mice stayed significantly higher (there was a similar higher trend in Ccm1 mutant mice as well). (B) Significantly decreased SerpinA6 levels were observed in Ccm1 mutant mice in the 30-day treatment group only, while increased amounts of SerpinA6 were observed in Ccm1/2 mutants in both 60- and 90-day treatment groups (although not significant yet). (C) Although albumin levels fluctuated in Ccms mutants in the 30- and 60-day treatment groups (nonsignificant), significantly decreased amounts of albumin were found in Ccm2 mutants in the 90-day treatment group (both Ccm1 and Ccm3 also shared decreased levels) compared to WT. (D) Serum levels of five molecules (PRG, Albumin, SerpinA6, IL-6, and IL-12) were found to correlate with vascular permeability in the BBB (leakage), which can be utilized as etiological biomarkers to predict BBB disruption. The integrated evaluation of these markers will be the key to predict and prevent hemorrhagic stroke. Predictive equations were generated for this figure using binomial regression of the serum levels of the five etiological biomarkers by integrating temporal EBD data in Ccm mutant mice under mPR-specific PRG actions (0–3 months exposure). *, ** and *** above graphs indicate p ≤ 0.05, 0.01, and 0.001.

Similar articles

Cited by

References

    1. Padarti A., Zhang J. Recent advances in cerebral cavernous malformation research. Vessel Plus. 2018;2:21. doi: 10.20517/2574-1209.2018.34. - DOI - PMC - PubMed
    1. Abou-Fadel J., Vasquez M., Grajeda B., Ellis C., Zhang J. Systems-wide analysis unravels the new roles of CCM signal complex (CSC) Heliyon. 2019;5:e02899. doi: 10.1016/j.heliyon.2019.e02899. - DOI - PMC - PubMed
    1. Jiang X., Padarti A., Qu Y., Sheng S., Abou-Fadel J., Badr A., Zhang J. Alternatively spliced isoforms reveal a novel type of PTB domain in CCM2 protein. Sci. Rep. 2019;9:15808. doi: 10.1038/s41598-019-52386-0. - DOI - PMC - PubMed
    1. Abou-Fadel J., Jiang X., Padarti A., Goswami D., Smith M., Grajeda B., Walker W., Zhang J. CCM signaling complex (CSC) is a master regulator governing homeostasis of progestins and their mediated signaling cascades. bioRxiv. 2020 doi: 10.1101/2020.06.10.145003. - DOI
    1. Zhang J., Abou-Fadel J. Calm the raging hormone—a new therapeutic strategy involving progesterone-signaling for hemorrhagic CCMs. Vessel Plus. 2021;5:48. doi: 10.20517/2574-1209.2021.64. - DOI - PMC - PubMed

MeSH terms

Substances

LinkOut - more resources