. 2022 Aug 26;23(17):9702.
doi: 10.3390/ijms23179702.

Effect of Prolonged Photoperiod on Light-Dependent Photosynthetic Reactions in Cannabis

Affiliations

Effect of Prolonged Photoperiod on Light-Dependent Photosynthetic Reactions in Cannabis

Martina Šrajer Gajdošik et al. Int J Mol Sci. .

Abstract

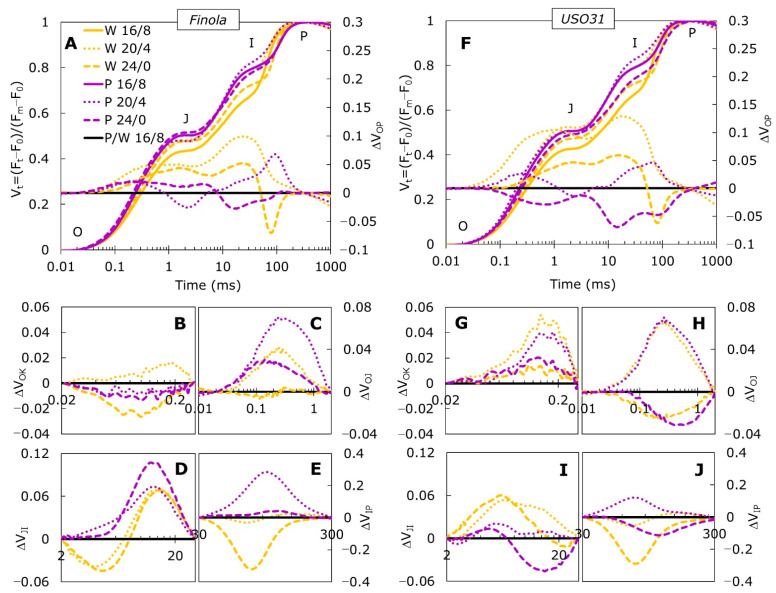
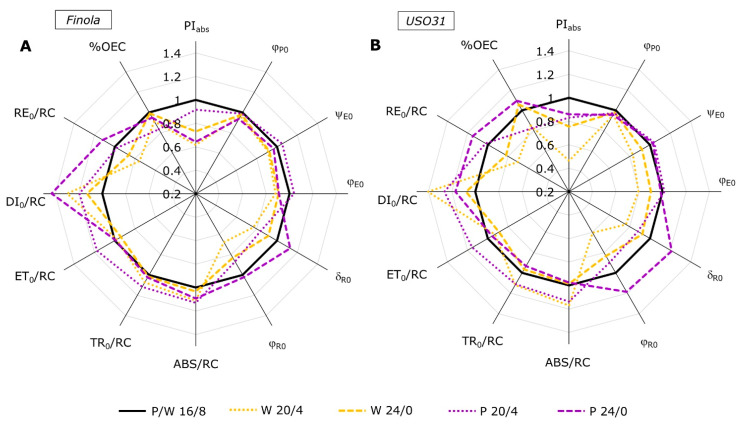
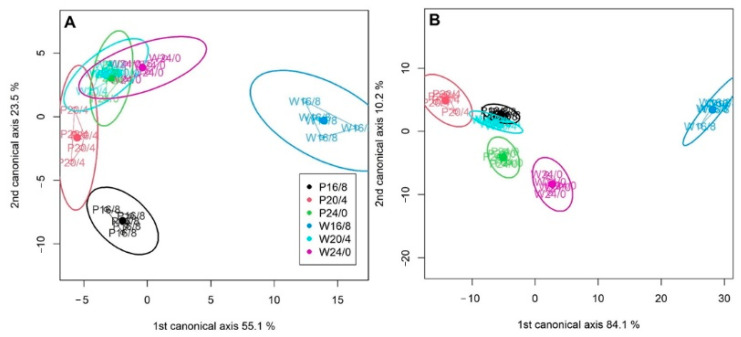
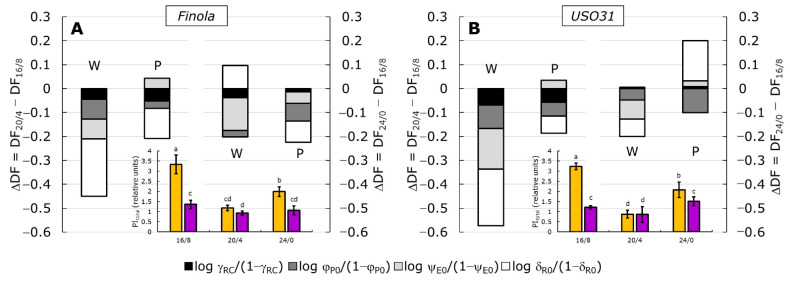
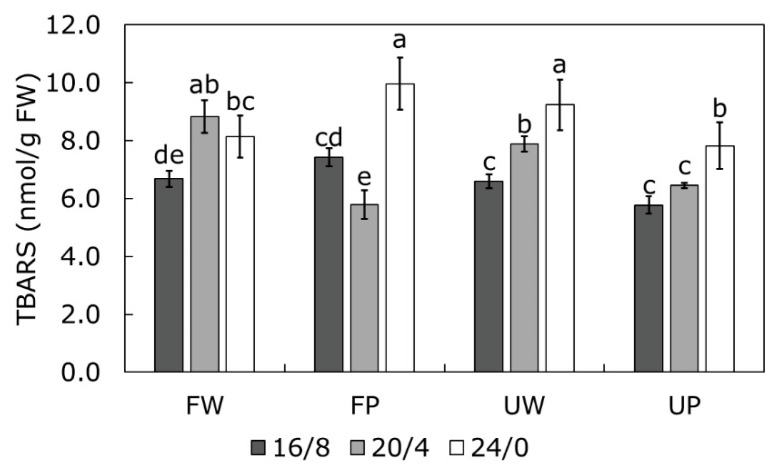
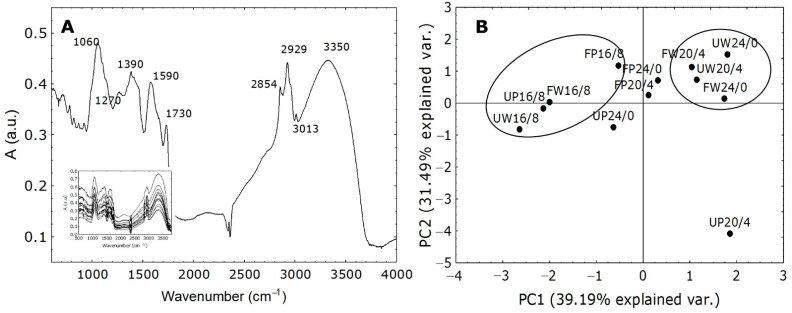
Industrial hemp is a fast-growing, short-day plant, characterized by high biomass yields and low demands for cultivation. To manipulate growth, hemp is usually cultivated under prolonged photoperiods or continuous light that could cause photooxidative damage and adjustments of photosynthetic reactions. To determine the extent of changes in photosynthetic response caused by prolonged light exposure, we employed chlorophyll a fluorescence measurements accompanied with level of lipid peroxidation (TBARS) and FT-IR spectroscopy on two Cannabis cultivars. Plants were grown under white (W) and purple (P) light at different photoperiods (16/8, 20/4, and 24/0). Our results showed diverse photosynthetic reactions induced by the different light type and by the duration of light exposure in two cultivars. The most beneficial condition was the 16/8 photoperiod, regardless of the light type since it brought the most efficient physiological response and the lowest TBARS contents suggesting the lowest level of thylakoid membrane damage. These findings indicate that different efficient adaptation strategies were employed based on the type of light and the duration of photoperiod. White light, at both photoperiods, caused higher dissipation of excess light causing reduced pressure on PSI. Efficient dissipation of excess energy and formation of cyclic electron transport around PSI suggests that P20/4 initiated an efficient repair system. The P24/0 maintained functional electron transport between two photosystems suggesting a positive effect on the photosynthetic reaction despite the damage to thylakoid membranes.

Keywords: FT-IR; G-band; H-band; OJIP; TBARS; industrial hemp.


Conflict of interest statement

The authors declare no conflict of interest. The funders had no role in the design of the study; in the collection, analyses, or interpretation of data; in the writing of the manuscript, or in the decision to publish the results.

Figures

Figure 1
Figure 1
Differences in the shapes and amplitudes of OJIP transient curves measured in Cannabis cultivars Finola and USO31 exposed to 16/8, 20/4, and 24/0 photoperiods and grown under white and purple light are presented as kinetics of relative variable fluorescence Vt and as difference kinetics ΔVOP (A,F). Difference kinetics ΔVt, for individual bands, L (B,G), K (C,H), H (D,I), and G (E,J) are plotted at different time ranges. Each curve represents the average of five measurements (n = 5) per treatment. The 16/8 photoperiods were used as referent values for each cultivar and growth light. The O, J, I, and P steps are indicated in Vt curves.
Figure 2
Figure 2
Radar plot of selected JIP-test parameters characterizing PSII functioning measured in Cannabis cultivars Finola (A) and USO31 (B) exposed to 16/8, 20/4, and 24/0 photoperiods and grown under white and purple light. Data are normalized to their respective controls measured at the 16/8 photoperiod for each cultivar and growth light separately (control = 1). Each curve represents mean values of 5 measurements (n = 5); LSDFinola = 0.019; LSDUSO31 = 0.008.
Figure 3
Figure 3
Cannonical variate analysis (CVA) representing the explanatory variables within Cannabis cultivars Finola (A) and USO31 (B) exposed to 16/8, 20/4, and 24/0 photoperiods and grown under white (W) and purple (P) light. Points represent values for each treatment. Ellipses around the different groups represent the 95% confidence intervals.
Figure 4
Figure 4
Relative changes in the difference in driving forces (ΔDF) measured in Cannabis cultivars Finola (A) and USO31 (B) exposed to 16/8, 20/4, and 24/0 photoperiods and grown under white (W) and purple (P) light. Stacked columns are showing the difference in DFs at 20/4 (left columns per panel) and 24/0 (right columns per panel) photoperiods minus the DF at 16/8 (control). Each DF is calculated by summing up their partial driving forces: log γRC/(1 − γRC), log φP0/(1 − φP0), log ψE0/(1 − ψE0), and log δR0/(1 − δR0). The performance index for energy conservation from exciton to the reduction of the final electron acceptor at PSI, PItotal for each cultivar is shown in the inserts. Yellow bars represent plants grown under white light, while purple bars represent plants grown under purple light. Results are shown as the mean of five independent measurements (n = 5) ± SD. Different letters represent a significant difference at p ≤ 0.05 (ANOVA, LSD).
Figure 5
Figure 5
Changes in content of thiobarbituric acid reactive substances (TBARS, nmol/g FW) measured in Cannabis cultivars Finola (F) and USO31 (U) exposed to 16/8, 20/4, and 24/0 photoperiods and grown under white (W) and purple (P) light. Results are shown as mean of five independent measurements (n = 5) ± SD. Different letters represent significant differences at p ≤ 0.05 (ANOVA, LSD); LSD = 0.187.
Figure 6
Figure 6
Characteristic bands (range 400–4000 cm−1) of FT-IR spectra measured in the Cannabis samples. (A) shows characteristic peaks marked with numbers. The FTIR spectrum was recorded using 12 scans at a resolution of 2 cm−1 in the wavenumbers range from 400 to 4000 cm−1. The insert represents the FTIR spectral analysis in Cannabis cultivars for each treatment. PCA (B) represents the explanatory FT-IR variables between and within Cannabis cultivars Finola (F) and USO31 (U) exposed to 16/8, 20/4, and 24/0 photoperiods and grown under white (W) and purple (P) light. Points represent values for each treatment. The analysis provides the score results provided in the insert.

References

    1. Moscariello C., Matassa S., Esposito G., Papirio S. From residue to resource: The multifaceted environmental and bioeconomy potential of industrial hemp (Cannabis sativa L.) Resour. Conserv. Recycl. 2021;175:105864. doi: 10.1016/j.resconrec.2021.105864. - DOI
    1. Fike J. Industrial hemp: Renewed opportunities for an ancient crop. Crit. Rev. Plant Sci. 2016;35:406–424. doi: 10.1080/07352689.2016.1257842. - DOI
    1. Industrial Hemp Market by Type (Hemp Seed, Hemp Seed Oil, Hemp Fiber, and CBD Hemp Oil), Application (Food, Beverages, Personal Care Products, Textiles, and Pharmaceuticals), Source (Organic and Conventional), and Region—Global Forecast to 2025. [(accessed on 27 July 2022)]. Available online: https://www.marketsandmarkets.com/Market-Reports/industrial-hemp-market-....
    1. Giupponi L., Leoni V., Carrer M., Ceciliani G., Sala S., Panseri S., Pavlovic R., Giorgi A. Overview on Italian hemp production chain, related productive and commercial activities and legislative framework. Ital. J. Agron. 2020;15:194–205. doi: 10.4081/ija.2020.1552. - DOI
    1. Rupasinghe H.V., Davis A., Kumar S.K., Murray B., Zheljazkov V.D. Industrial hemp (Cannabis sativa subsp. sativa) as an emerging source for value-added functional food ingredients and nutraceuticals. Molecules. 2020;25:4078. doi: 10.3390/molecules25184078. - DOI - PMC - PubMed

MeSH terms

LinkOut - more resources