. 2022 Aug 29;23(17):9768.
doi: 10.3390/ijms23179768.

Diverse Effects of Cilostazol on Proprotein Convertase Subtilisin/Kexin Type 9 between Obesity and Non-Obesity

Affiliations

Diverse Effects of Cilostazol on Proprotein Convertase Subtilisin/Kexin Type 9 between Obesity and Non-Obesity

Po-Wei Chen et al. Int J Mol Sci. .

Abstract

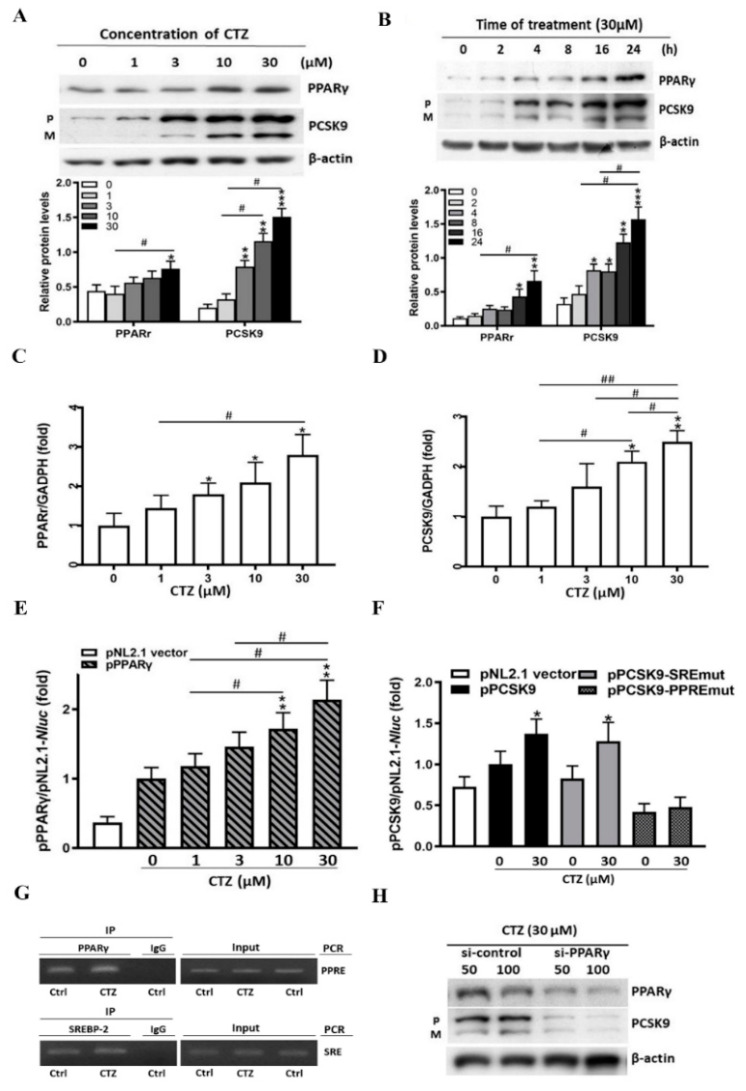
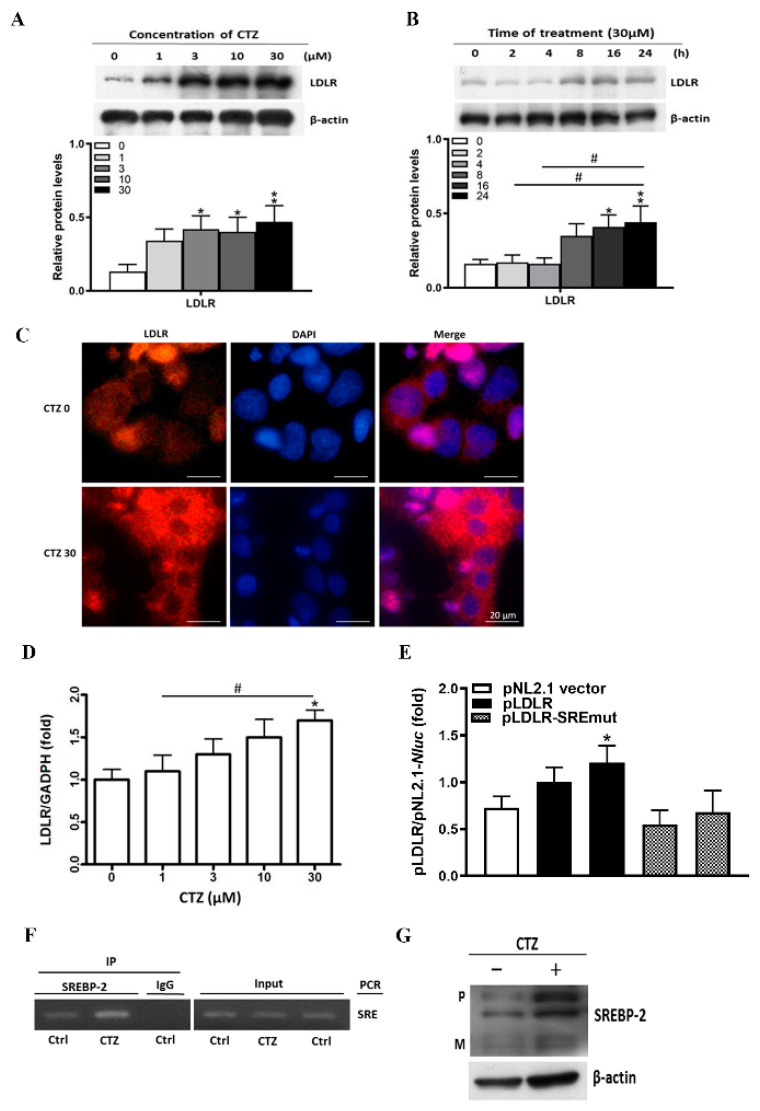
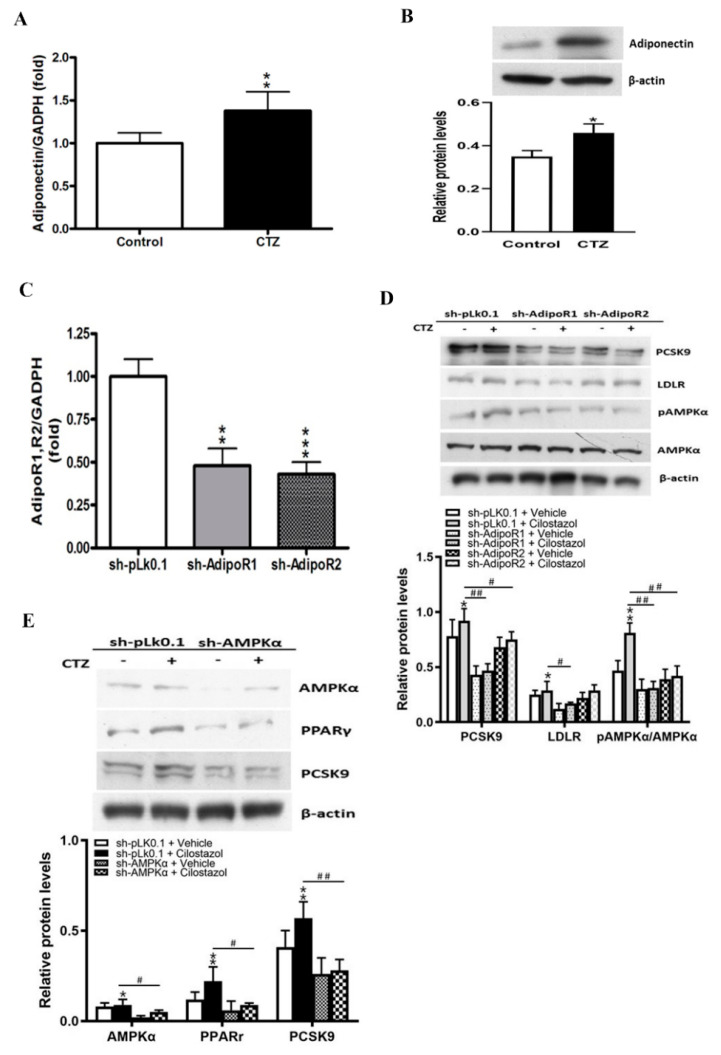
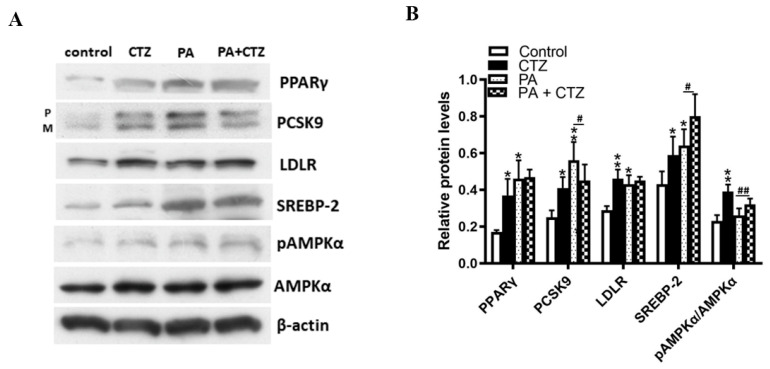
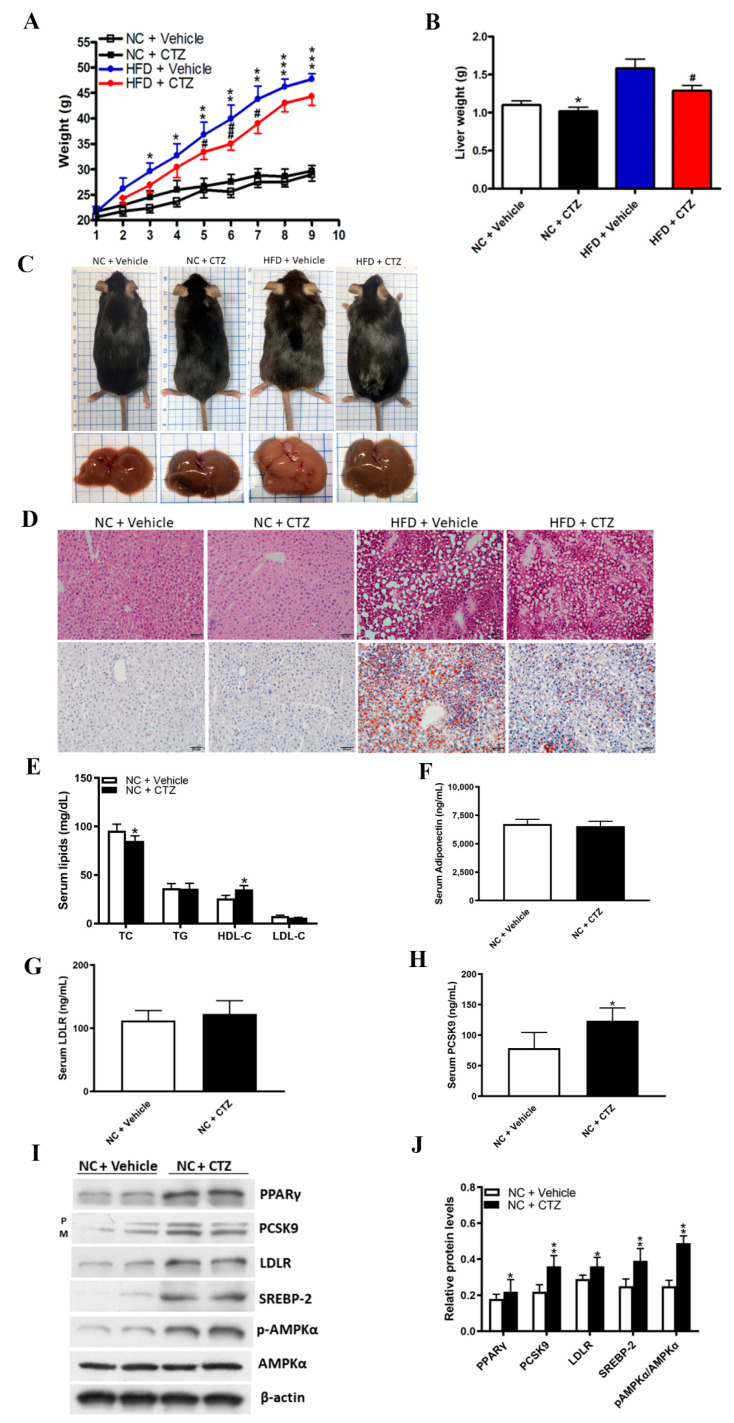
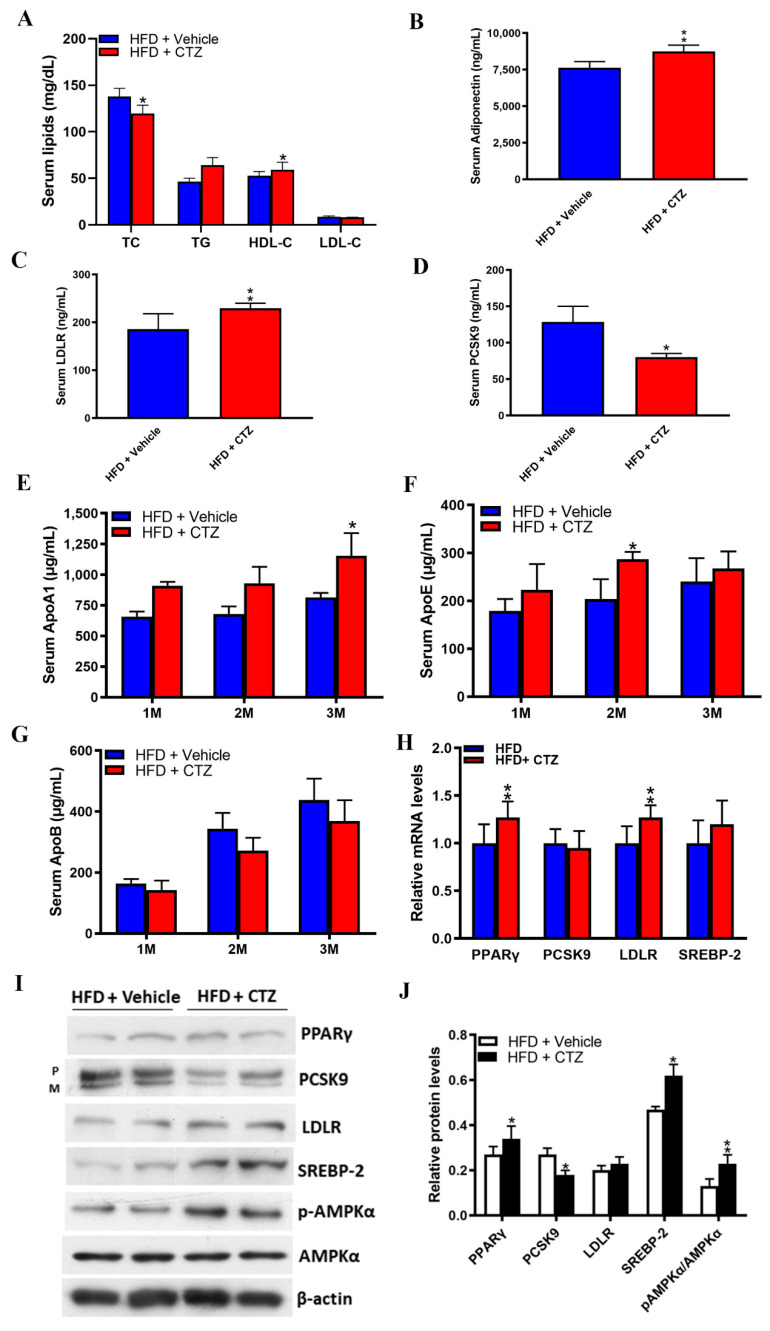
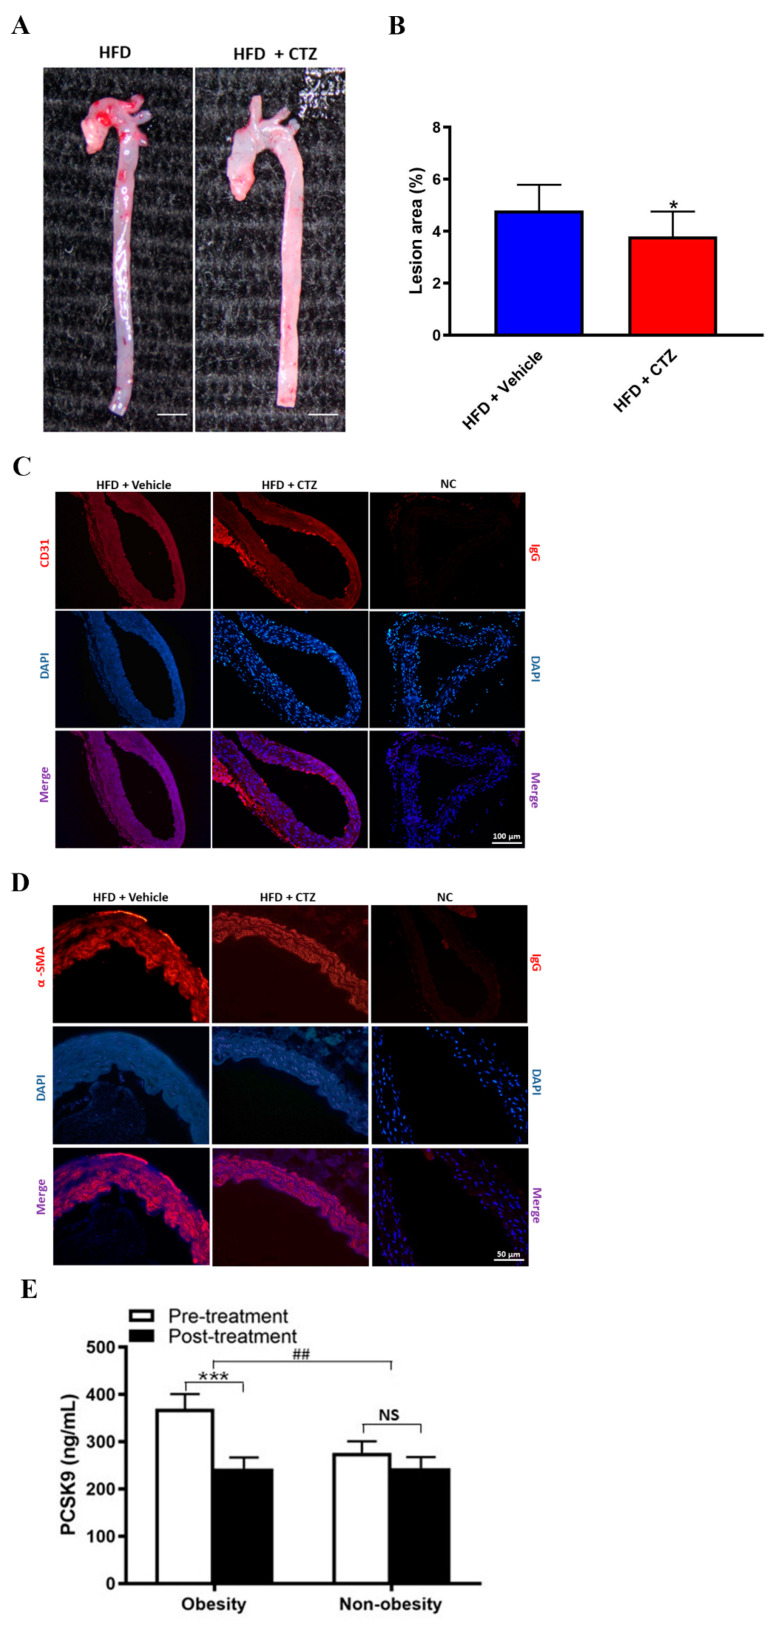
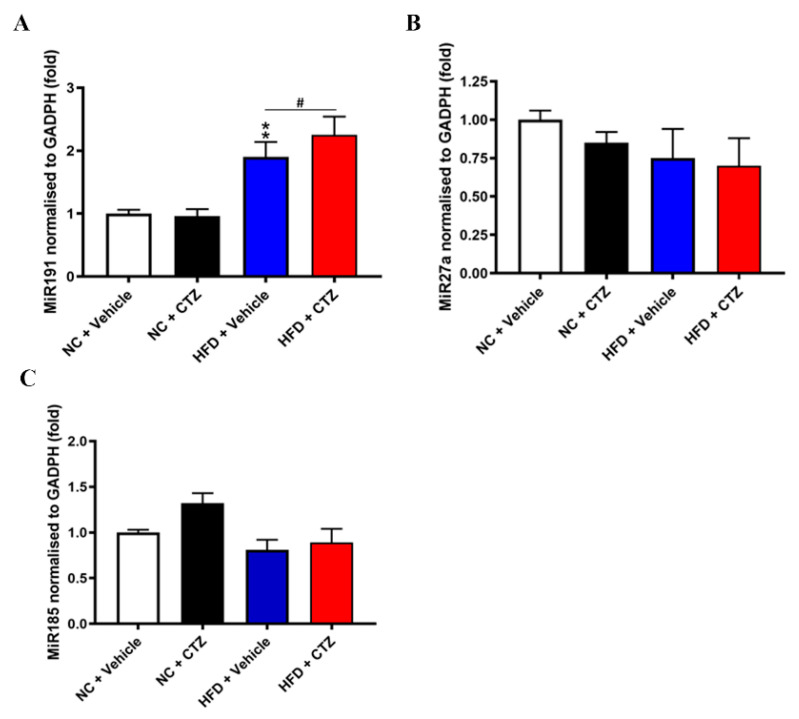
Proprotein convertase subtilisin/kexin type 9 (PCSK9) plays a key role in cholesterol homeostasis. Cilostazol exerts favorable cellular and metabolic effects; however, the effect of cilostazol on the expression of PCSK9 has not been previously reported. Our study aimed to investigate the potential mechanisms of action of cilostazol on the expression of PCSK9 and lipid homeostasis. We evaluated the effects of cilostazol on the expression of PCSK9 in HepG2 cells and evaluated potential molecular mechanisms by measuring signaling molecules in the liver and serum lipid profiles in high-fat diet-induced obese mice and normal chow-fed mice. Cilostazol treatment significantly induced the messenger RNA and protein expression of PCSK9 in HepG2 cells and enhanced PCSK9 promoter activity. Chromatin immunoprecipitation assays confirmed that cilostazol treatment enhanced PCSK9 transcription by binding to peroxisome proliferator-activated receptor-γ (PPARγ) via the PPARγ DNA response element. PPARγ knockdown attenuated the stimulatory effect of cilostazol on PCSK9. In vitro, cilostazol treatment increased PCSK9 expression in vehicle-treated HepG2 cells but decreased PCSK9 expression in palmitic acid-treated HepG2 cells. In vivo, cilostazol treatment increased the serum levels of PCSK9 in normal mice but significantly reduced PCSK9 levels in obese mice. The expressions of PCSK9-relevant microRNAs also showed similar results. Clinical data showed that cilostazol treatment significantly reduced serum PCSK9 levels in patients with obesity. The obesity-dependent effects of cilostazol on PCSK9 expression observed from bench to bedside demonstrates the therapeutic potential of cilostazol in clinical settings.

Keywords: cilostazol; low-density lipoprotein receptor; obesity; peroxisome proliferator-activated receptor-γ; proprotein convertase subtilisin/kexin type 9.


Conflict of interest statement

The authors declare no conflict of interest.

Figures

Figure 1
Figure 1
Cilostazol activates the expression of peroxisome proliferator-activated receptor-γ (PPARγ) and proprotein convertase subtilisin/kexin type 9 (PCSK9) in HepG2 cells. * p < 0.05, ** p < 0.01, and *** p < 0.001 versus the untreated group. # p < 0.05, and ## p < 0.01, comparison between treated groups. (A) HepG2 cells in serum-free medium were treated with cilostazol at different concentrations overnight (0, 1, 3, 10, 30 μM). Protein levels of PPARγ and PCSK9 in HepG2 were measured by Western blotting. β-actin was used as a loading control. Quantification of blot intensity relative to loading control is shown below. (B) HepG2 cells in serum-free medium were treated with cilostazol (30 μM), and then incubated for 0 min, 2 h, 4 h, 8 h, 16 h, and 24 h. Quantification of blot intensity relative to loading control is shown below. (C,D) Quantification of PPARγ and PCSK9 mRNA expression in the cilostazol-treated groups. The total cellular RNA was used to determine PPARγ and PCSK9 mRNA expressions by Cell-RNA-cDNA real-time polymerase chain reaction (PCR). The results are represented as the mean ± S.E.M. from three independent experiments. Cilostazol induced mRNA expression dose-dependently in HepG2 cells. (E) Quantification of PPARγ promoter activity in the cilostazol-treated groups. Expression vector of human PPARγ promoters were constructed by PCR with the genomic DNA isolated from HepG2 cells. The results are represented as the mean ± S.E.M. from three independent experiments. (F) Cells were transfected with DNA for PCSK9 promoter and expression vector of wild type or peroxisome proliferator response element (PPRE) or sterol regulatory element (SRE) mutation (pPCSK9-PPREmut or pPCSK9-SREmut) followed by treatment with cilostazol at the indicated concentrations overnight. (G) HepG2 cells were treated with cilostazol (30 μM) overnight. Chromatin was isolated followed by immunoprecipitation with normal immunoglobulin G (IgG), anti-PPARγ, or anti-sterol regulatory element-binding protein-2 (SREBP-2) antibody. The PCR was conducted with primers for PPRE or SRE in the PCSK9 promoter. (H) Scrambled small-interfering RNA (siRNA) and PPARγ siRNA were transfected in HepG2 cells at the indicated concentrations. The expression levels of PPARγ and PCSK9 protein were assessed by Western blot.
Figure 2
Figure 2
Cilostazol activates low-density lipoprotein receptor (LDLR) expression in HepG2 cells. * p < 0.05, and ** p < 0.01 versus the untreated group. # p < 0.05, comparison between treated groups. (A) HepG2 cells in serum-free medium were treated with cilostazol at different concentrations overnight (0, 1, 3, 10, 30 μM). Protein levels of LDLR in HepG2 were measured by Western blotting. β-actin was used as a loading control. Quantification of blot intensity relative to loading control is shown below. (B) HepG2 cells in serum-free medium were treated with cilostazol (30 μM), and then incubated for 0 min, 2 h, 4 h, 8 h, 16 h, and 24 h. Quantification of blot intensity relative to loading control is shown below. (C) Representative images of immunofluorescence staining with LDLR (red), 4′,6-diamidino-2-phenylindole (DAPI) (nucleus, blue), and their colocalization (merge). Scale bar = 20 μM. (D) Quantification of LDLR mRNA expression in the cilostazol-treated groups. The total cellular RNA was used to determine LDLR mRNA expression by Cell-RNA-cDNA real-time PCR. The results are represented as the mean ± S.E.M. from three independent experiments. (E) LDLR promoter was conducted with the mutation of SRE (pLDLR-SREmut). Expression vector of human LDLR promoters were constructed by PCR with the genomic DNA isolated from HepG2 cells. Cells were transfected with DNA for LDLR promoter and expression vector of wild type or SRE mutation (pLDLR-SREmut) followed by treatment with cilostazol at the indicated concentrations overnight. (F) HepG2 cells were treated with cilostazol (30 μM) overnight. Chromatin was isolated followed by immunoprecipitation with normal IgG or anti-SREBP-2 antibody. The PCR was conducted with primers for SRE in the PCSK9 promoter. (G) Protein levels of precursor (P) and mature (M) forms of SREBP-2 in HepG2 were measured by Western blotting. β-actin was used as a loading control.
Figure 3
Figure 3
Cilostazol mediates the expression of adiponectin and the subsequent activation of adenosine monophosphate-activated protein kinase (AMPK) in HepG2 cells. * p < 0.05, ** p < 0.01, and *** p < 0.001 versus the control group or sh−pLK0.1+vehicle. # p < 0.05, ## p < 0.01, comparison between treated groups. (A) Quantification of mRNA expression of adiponectin in the cilostazol-treated groups. (B) Protein levels of adiponectin in HepG2 cells were measured by Western blotting. β-actin was used as a loading control. (C) The sh-adipoR1 and sh-adipoR2 were transfected into HepG2 cells to knock down adipoRs. (D) Protein expression of phosphorylated AMPKα and PCSK9 and LDLR were measured by Western blotting. Β-actin was used as a loading control. Quantification of blot intensity relative to the loading control is shown below. (E) Protein levels of AMPKα, PPARγ, and PCSK9 in HepG2 cells were measured by Western blotting. β-actin was used as a loading control. Quantification of blot intensity relative to loading control is shown below.
Figure 4
Figure 4
Diverse effects of cilostazol on PCSK9 levels in HepG2 cells treated with palmitic acid (PA) or without. (A) HepG2 cells were pretreated with or without 250 μM PA incubated in the culture media for 24 h. Protein levels of PPARγ, PCSK9, LDLR, SREBP-2, and phosphorylated AMPKα in HepG2 were measured by Western blotting. β-actin was used as a loading control. (B) Quantification of blot intensity relative to loading control is shown. * p < 0.05 and ** p < 0.01 versus vehicle control. # p < 0.05 and ## p < 0.01 versus HepG2 cells treated with PA and vehicle.
Figure 5
Figure 5
Effects of cilostazol on lipid homeostasis in the liver of mice fed with normal chow (NC) or high-fat diet (HFD) and lipid homeostasis-relevant profile in the serum or liver of the mice fed with NC. The mice were intraperitoneally injected with cilostazol (10 mg/kg of body weight) or vehicle twice a week for 12 weeks. (A,B) Quantification of body weight and liver weight (gm) in the NC-fed and HFD-fed mice treated with cilostazol or vehicle. * p < 0.05, ** p < 0.01 and *** p < 0.001 comparison between the vehicle-treated group fed with NC or HFD. # p < 0.05 and ## p < 0.01 comparison between the HFD-fed mice treated with cilostazol or vehicle. (C) Representative liver specimens obtained 24 weeks after treatment with cilostazol or vehicle. (D) Magnification 200×. The hematoxylin and eosin (upper) and Oil Red O staining (lower) of liver sections from NC-fed and HFD-fed mice treated with cilostazol or vehicle. Abundant accumulation of lipid droplets accompanied with hepatocyte damage in HFD-fed mice. This hazard effect could be diminished by cilostazol treatment. (EH) Quantification of serum levels of lipid profile, adiponectin, PCSK9, and LDLR in NC-fed mice treated with cilostazol or vehicle. * p < 0.05 versus the NC-fed mice of vehicle-treated group. (I) Protein expression of PPARγ, PCSK9, LDLR, SREBP-2, and phosphorylated AMPKα were measured by Western blotting in the liver of the mice fed with NC. β-actin was used as a loading control. (J) Quantification of blot intensity relative to loading control is shown. * p < 0.05 and ** p < 0.01 versus the control group.
Figure 6
Figure 6
Effects of cilostazol on lipid homeostasis-relevant profile in the serum or liver of the mice fed with HFD. (AD) Quantification of serum levels of lipid profile, adiponectin, PCSK9, and LDLR in HFD-fed mice treated with cilostazol or vehicle. * p < 0.05 versus vehicle-treated group. ** p < 0.01 versus vehicle-treated group. (EG) Quantification of serum levels of ApoA1, ApoB, and ApoE in HFD-fed mice treated with cilostazol (red bar) or vehicle (blue bar). * p < 0.05 versus vehicle-treated group. ** p < 0.01 versus vehicle-treated group. Mouse serum Apo A1, Apo B, and Apo E levels were detected using ELISA kit. (H) Quantification of relative mRNA expression in the cilostazol-treated and vehicle-treated groups. ** p < 0.01 versus the vehicle-treated group. (I) Protein expression of PPARγ, PCSK9, LDLR, SREBP-2, and phosphorylated AMPKα were measured by Western blotting in the liver of the mice fed with HFD. β-actin was used as a loading control. (J) Quantification of blot intensity relative to loading control is shown. * p < 0.05 and ** p < 0.01 versus the vehicle-treated group.
Figure 7
Figure 7
The anti-atherosclerotic effects of cilostazol in HFD-fed mice. (A,B) Representative images of aorta specimens from HFD-fed mice treated with vehicle (left) or cilostazol (right), and quantification of lesion area (%) in HFD-fed mice treated with cilostazol (red bar) and those without (blue bar). * p < 0.05 versus HFD-fed mice treated with vehicle. (C,D) Representative images of immunofluorescence staining with CD31, α-smooth muscle actin (α-SMA) (red), DAPI (nucleus, blue), and their colocalization (merge). Scale bar = 100 μM (C) and 50 μM (D). (E) Cilostazol treatment significantly reduced serum PCSK9 levels in patients with obesity (369.75 ± 30.94 vs. 243.27 ± 23.36 ng/mL, p < 0.001) but not in those without (276.26 ± 24.57 vs. 243.98 ± 32.14 ng/mL, p = 0.178). The changes in the serum concentrations of PCSK9 post-treatment between obese and non-obese patients were statistically significant (ΔPCSK9: 126.48 ± 24.93 vs. 32.28 ± 23.68 ng/mL, p = 0.009). *** p < 0.001 and NS: not significant (p > 0.05), comparison between groups. ## p < 0.01, comparison between obesity and non-obesity.
Figure 8
Figure 8
Effects of cilostazol on lipid metabolism-relevant miRNAs in the liver of the mice fed with NC and HFD. Levels of miRNAs were calculated from the results of real-time PCR and the volume of total RNA to compare the simplified absolute quantity in each component. (AC) Quantification of miRNAs levels in the liver of the mice fed with NC and HFD treated with cilostazol or vehicle. ** p < 0.01 versus the NC-fed mice in vehicle-treated group. # p < 0.05, comparison between vehicle and cilostazol treatment in the HFD-fed mice.

Similar articles

References

    1. Li S., Li J.-J. PCSK9: A key factor modulating atherosclerosis. J. Atheroscler. Thromb. 2015;22:221–230. doi: 10.5551/jat.27615. - DOI - PubMed
    1. Sabatine M.S. PCSK9 inhibitors: Clinical evidence and implementation. Nat. Rev. Cardiol. 2019;16:155–165. doi: 10.1038/s41569-018-0107-8. - DOI - PubMed
    1. Cohen J.C., Boerwinkle E., Mosley T.H., Jr., Hobbs H.H. Sequence variations in PCSK9, low LDL, and protection against coronary heart disease. N. Engl. J. Med. 2006;354:1264–1272. doi: 10.1056/NEJMoa054013. - DOI - PubMed
    1. Baass A., Dubuc G., Tremblay M., Delvin E.E., O’Loughlin J., Levy E., Davignon J., Lambert M. Plasma PCSK9 is associated with age, sex, and multiple metabolic markers in a population-based sample of children and adolescents. Clin. Chem. 2009;55:1637–1645. doi: 10.1373/clinchem.2009.126987. - DOI - PubMed
    1. Cui Q., Ju X., Yang T., Zhang M., Tang W., Chen Q., Hu Y., Haas J.V., Troutt J.S., Pickard R.T., et al. Serum PCSK9 is associated with multiple metabolic factors in a large Han Chinese population. Atherosclerosis. 2010;213:632–636. doi: 10.1016/j.atherosclerosis.2010.09.027. - DOI - PubMed

LinkOut - more resources