. 2022 Aug 29;23(17):9829.
doi: 10.3390/ijms23179829.

Sex and APOE Genotype Alter the Basal and Induced Inflammatory States of Primary Microglia from APOE Targeted Replacement Mice

Affiliations

Sex and APOE Genotype Alter the Basal and Induced Inflammatory States of Primary Microglia from APOE Targeted Replacement Mice

Isha Mhatre-Winters et al. Int J Mol Sci. .

Abstract

The sex and APOE4 genotype are significant risk factors for Alzheimer’s disease (AD); however, the mechanism(s) responsible for this interaction are still a matter of debate. Here, we assess the responses of mixed-sex and sex-specific APOE3 and APOE4 primary microglia (PMG) to lipopolysaccharide and interferon-gamma. In our investigation, inflammatory cytokine profiles were assessed by qPCR and multiplex ELISA assays. Mixed-sex APOE4 PMG exhibited higher basal mRNA expression and secreted levels of TNFa and IL1b. In sex-specific cultures, basal expression and secreted levels of IL1b, TNFa, IL6, and NOS2 were 2−3 fold higher in APOE4 female PMG compared to APOE4 males, with both higher than APOE3 cells. Following an inflammatory stimulus, the expression of pro-inflammatory cytokines and the secreted cytokine level were upregulated in the order E4 female > E4 male > E3 female > E3 male in sex-specific cultures. These data indicate that the APOE4 genotype and female sex together contribute to a greater inflammatory response in PMG isolated from targeted replacement humanized APOE mice. These data are consistent with clinical data and indicate that sex-specific PMG may provide a platform for exploring mechanisms of genotype and sex differences in AD related to neuroinflammation and neurodegeneration.

Keywords: APOE; Alzheimer’s disease; cytokine; microglia; neuroinflammation; sex.


Conflict of interest statement

The authors declare no conflict of interest. The funders had no role in the design of the study; in the collection, analyses, or interpretation of data; in the writing of the manuscript, or in the decision to publish the results.

Figures

Figure 1
Figure 1
Purity of mixed-sex and sex-specific microglial cultures: (A) Representative images for purity of mixed-sex microglial cultures as determined by staining for IBA1 (microglia), GFAP (astrocyte), and DAPI (nucleus); (B) purity of mixed-sex microglial cultures was greater than 98%; (C) representative images for purity of sex-specific microglial cultures; (D) purity greater than 98% was consistently obtained for all sex-specific microglial cultures. Each data point in (B,D) denotes the average percent of microglia from three to four images per well. (E) Sex-specificity of cultures was validated by checking for the presence or absence of sex-determining region-Y (Sry) by qPCR. Each data point represents the average mRNA expression from one isolation. Data are represented as the mean ± standard deviation.
Figure 2
Figure 2
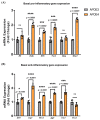
Basal pro− and anti−inflammatory gene expression in mixed−sex microglia is APOE genotype−dependent: (A) basal pro−inflammatory and (B) anti−inflammatory gene expression was evaluated in non−stimulated mixed−sex microglia from APOE3 and APOE4 genotypes. Gene expression between genotypes was analyzed using an unpaired Student’s t−test (N = 3 isolations, n = 6 plates). Data are represented as the mean ± standard deviation. *, ***, and **** indicate statistical significance for the comparison and denote p < 0.05, 0.001, and 0.0001, respectively. ns = not statistically significant (p > 0.05).
Figure 3
Figure 3
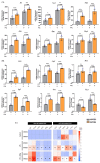
Comparison of gene expression between APOE3 and APOE4 genotypes: (A) pro− and (B) anti−inflammatory gene expression was evaluated in mixed−sex microglia from APOE3 and APOE4 genotypes following treatment with LPS (10 ng/mL) and LPS (10 ng/mL) + IFNg (10 ng/mL) for 6 h. Gene expression between genotypes was assessed by two−way ANOVA followed by Tukey’s multiple comparisons test (N = 3 isolations, n = 6 plates). Each data point represents the average mRNA expression from one isolation. Data are represented as the mean ± standard deviation. # denotes a significant increase compared to the respective genotype control (data not included in the graphs, p < 0.05). *, **, ***, and **** indicate statistical significance for the comparison and denote p < 0.05, 0.01, 0.001, and 0.0001, respectively. (C) Heat map comparing the mean expression of pro− and anti−inflammatory genes in control, LPS, and LPS + IFNg treated APOE3 and APOE4 PMG. * and ^ denote a significant (p < 0.05) increase and decrease, respectively, in APOE4 gene expression compared to APOE3.
Figure 4
Figure 4
APOE4 genotype exacerbates release of pro− and anti−inflammatory cytokines: cytokine levels were measured following treatment with LPS or LPS + IFNg for 24 h. (A) Average levels of nitrite (±standard deviation) accumulated in the media were measured by GRIESS assay. Using two−way ANOVA, significant treatment and genotype effects were observed. # denotes a significant increase compared to the respective genotype control (p < 0.05). (B) Basal levels of secreted cytokines were measured in non−stimulated microglia after 24 h by an MSD multiplex assay. Comparisons between genotypes were made using an unpaired Student’s t−test. (C) Cytokine levels in the media were measured after treatment with LPS or a combination of LPS and IFNg for 24 h. Two−way ANOVA was used to assess cytokine release in mixed−sex microglia from APOE3 and APOE4 genotypes (N = 3−4 isolations, n = 6−8 plates). Data are represented as the mean ±standard deviation, and each data point denotes the average of each experimental plate. # denotes a significant increase compared to the respective genotype control (data not included in the graphs, p < 0.05). *, **, ***, and **** indicate statistical significance for the comparison and denote p < 0.05, 0.01, 0.001, and 0.0001, respectively. ns = not statistically significant (p >0.05).
Figure 5
Figure 5
Basal pro− and anti−inflammatory gene expression in sex−specific microglia is dependent on both the APOE genotype and sex: (A) basal pro−inflammatory and (B) anti−inflammatory gene expression was evaluated in non−stimulated sex−specific microglia from APOE3 and APOE4 genotypes. Gene expression between genotypes and sexes was analyzed using two−way ANOVA (N = 3 isolations, n = 6 plates). Data are represented as the mean ± standard deviation. *, **, ***, and **** indicate statistical significance for the comparison and denote p < 0.05, 0.01, 0.001, and 0.0001, respectively. ns = not statistically significant (p > 0.05).
Figure 6
Figure 6
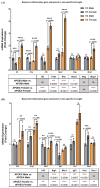
Gene expression in sex-specific microglia is dependent on both the APOE genotype and sex: (A) pro− and (B) anti−inflammatory gene expression was evaluated in sex−specific microglia from APOE3 and APOE4 genotypes following LPS or LPS + IFNg treatment for 6 h. Gene expression between genotypes and sexes was analyzed using a three−way ANOVA (N = 3 isolations, n = 6 plates) followed by Tukey’s multiple comparisons test. Each data point represents the average mRNA expression from one isolation. Data are represented as the mean ± standard deviation. # denotes a significant increase compared to the respective genotype control (data not included in the graphs, p < 0.05). *, **, ***, and **** indicate statistical significance for the comparison and denote p < 0.05, 0.01, 0.001, and 0.0001, respectively. ns = not statistically significant (p >0.05). (C) Heat map comparing the mean expression of pro− and anti−inflammatory genes in sex−specific APOE3 and APOE4 PMG treated with LPS and LPS + IFNg. * and ^ denote a significant (p < 0.05) increase and decrease, respectively, in fold changes of gene expression compared to a genotype−matched male PMG.
Figure 7
Figure 7
Increased secretion of inflammatory cytokines is dependent on both the APOE genotype and sex: (A) average nitrite levels accumulated in the media were measured by GRIESS assay. Three−way ANOVA followed by Tukey’s multiple comparisons test revealed a significant treatment−by−genotype−by−sex effect. # denotes a significant increase compared to the respective genotype control (p < 0.05). (B) Basal levels of secreted cytokines were measured in non−stimulated microglia after 24 h by an MSD multiplex assay. Comparisons between sex and genotype were made using two-way ANOVA followed by Tukey’s multiple comparisons test (N = 3 isolations, n = 6 plates). (C) Secretion of cytokines was measured post−treatment with LPS or LPS + IFNg by a three−way ANOVA followed by Tukey’s multiple comparisons test. Data are represented as the mean ± standard deviation. # denotes a significant increase compared to the respective control (data not included in the graphs, p < 0.05). *, **, ***, and **** indicate statistical significance for the comparison and denote p < 0.05, 0.01, 0.001, and 0.0001, respectively. ns = not statistically significant (p > 0.05).
Figure 8
Figure 8
APOE genotype and sex-dependent inflammation are mediated through p65 activation: (A) representative images for immunocytochemistry of p65 in control and LPS + IFNg treated APOE3 and APOE4, male and female PMG (scale bar = 100 μm). (B) Quantification of total p65 and (C) quantification of nuclear p65. N = 3 isolations. Each data point denotes the average p65 integrated density/cell density for an individual isolation. A denotes a significant increase compared to the E3 male control (p < 0.05). # denotes a significant increase compared to the respective genotype and sex control (p < 0.05). Data are represented as the mean ± standard deviation. * and **** indicate statistical significance for the comparison and denote p < 0.05 and 0.0001, respectively. ns = not statistically significant (p > 0.05).

Similar articles

Cited by

References

    1. Newcombe E.A., Camats-Perna J., Silva M.L., Valmas N., Huat T.J., Medeiros R. Inflammation: The link between comorbidities, genetics, and Alzheimer’s disease. J. Neuroinflamm. 2018;15:276. doi: 10.1186/s12974-018-1313-3. - DOI - PMC - PubMed
    1. Jones L.P.A., Holmans M.L.P., Hamshere D.M.L., Harold V.D., Moskvina D.V., Ivanov A.D., Pocklington R.A., Abraham P.R., Hollingworth R.P., Sims R., et al. Genetic Evidence Implicates the Immune System and Cholesterol Metabolism in the Aetiology of Alzheimer’s Disease. PLoS ONE. 2010;5:e13950. doi: 10.1371/journal.pone.0013950. - DOI - PMC - PubMed
    1. Karch C.M., Goate A.M. Alzheimer’s Disease Risk Genes and Mechanisms of Disease Pathogenesis. Biol. Psychiatry. 2015;77:43–51. doi: 10.1016/j.biopsych.2014.05.006. - DOI - PMC - PubMed
    1. McQuade A., Blurton-Jones M. Microglia in Alzheimer’s Disease: Exploring How Genetics and Phenotype Influence Risk. J. Mol. Biol. 2019;431:1805–1817. doi: 10.1016/j.jmb.2019.01.045. - DOI - PMC - PubMed
    1. Eid A., Mhatre I., Richardson J.R. Gene-environment interactions in Alzheimer’s disease: A potential path to precision medicine. Pharmacol. Ther. 2019;199:173–187. doi: 10.1016/j.pharmthera.2019.03.005. - DOI - PMC - PubMed