. 2022 Aug 30;23(17):9869.
doi: 10.3390/ijms23179869.

Analysis of Dormancy-Associated Transcriptional Networks Reveals a Shared Quiescence Signature in Lung and Colorectal Cancer

Affiliations

Analysis of Dormancy-Associated Transcriptional Networks Reveals a Shared Quiescence Signature in Lung and Colorectal Cancer

Adriano Cuccu et al. Int J Mol Sci. .

Abstract

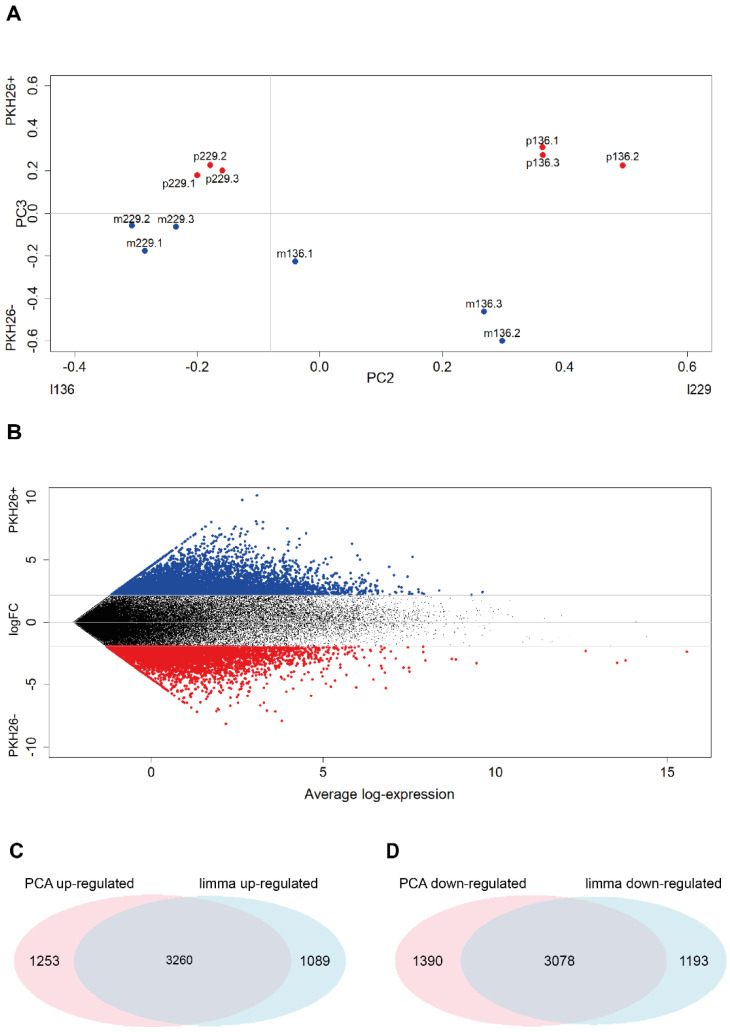
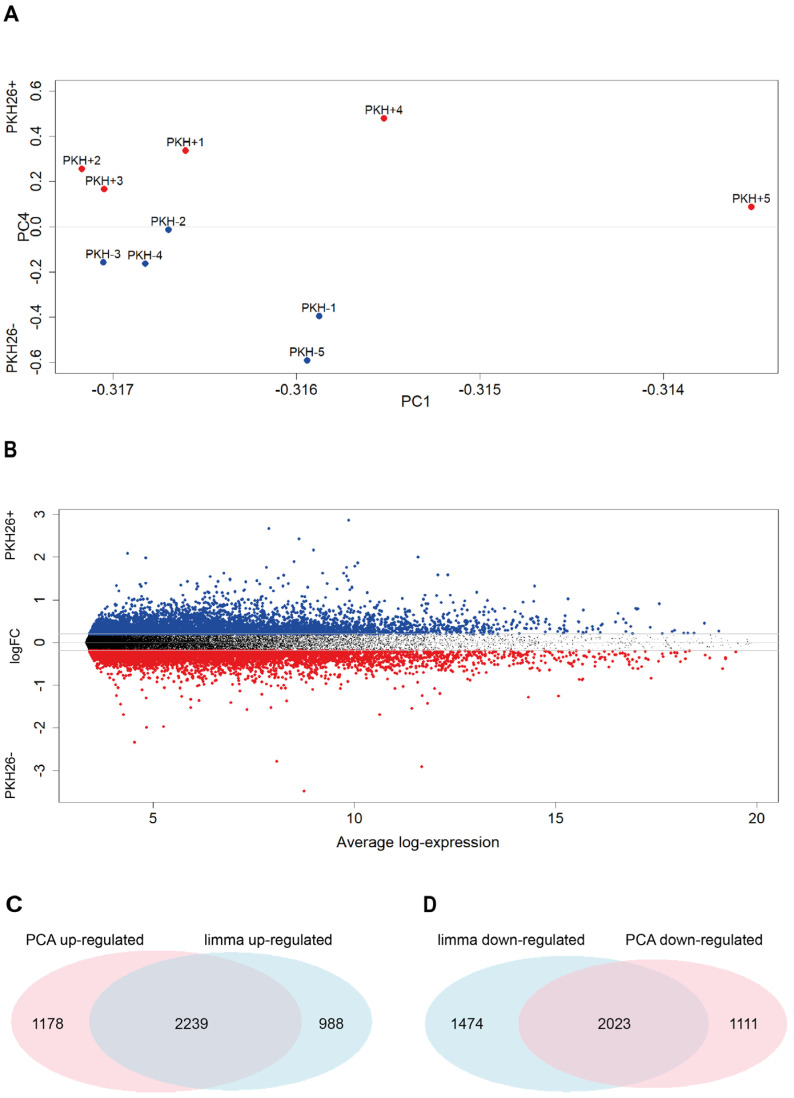
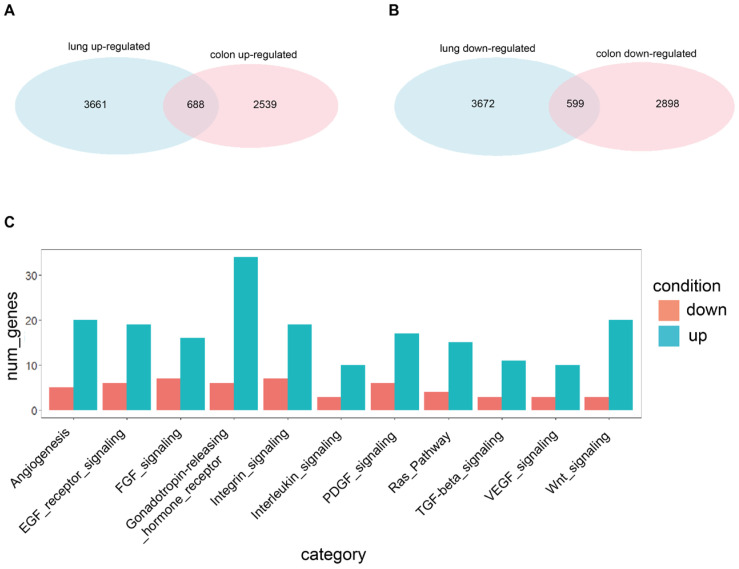
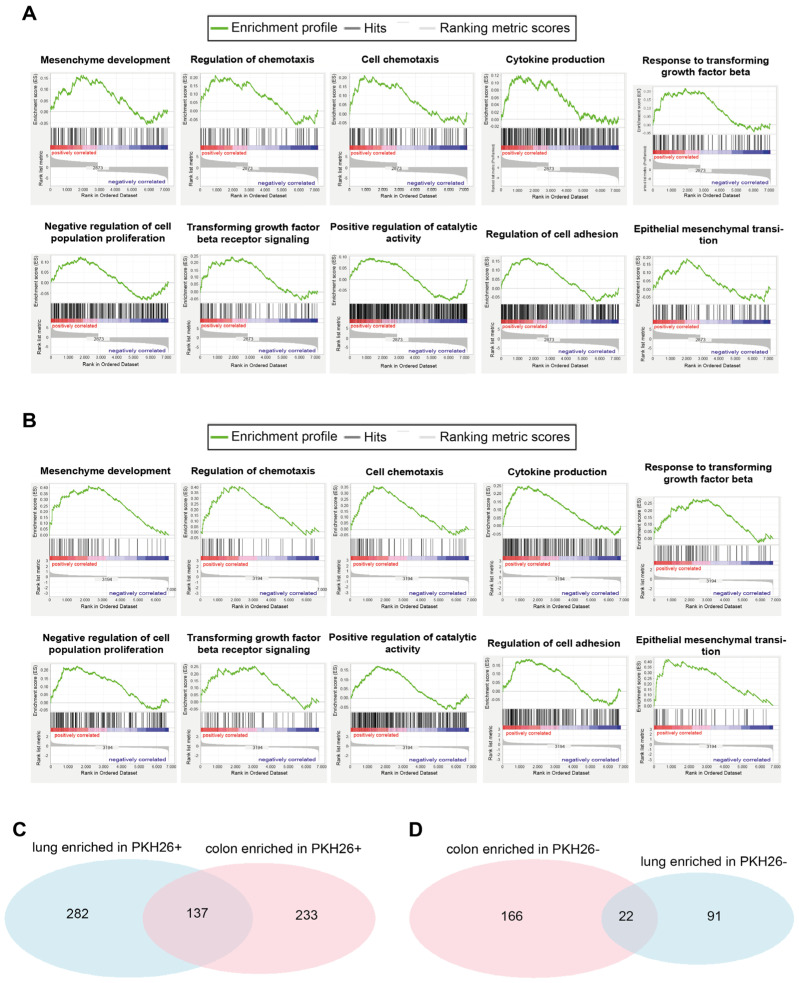
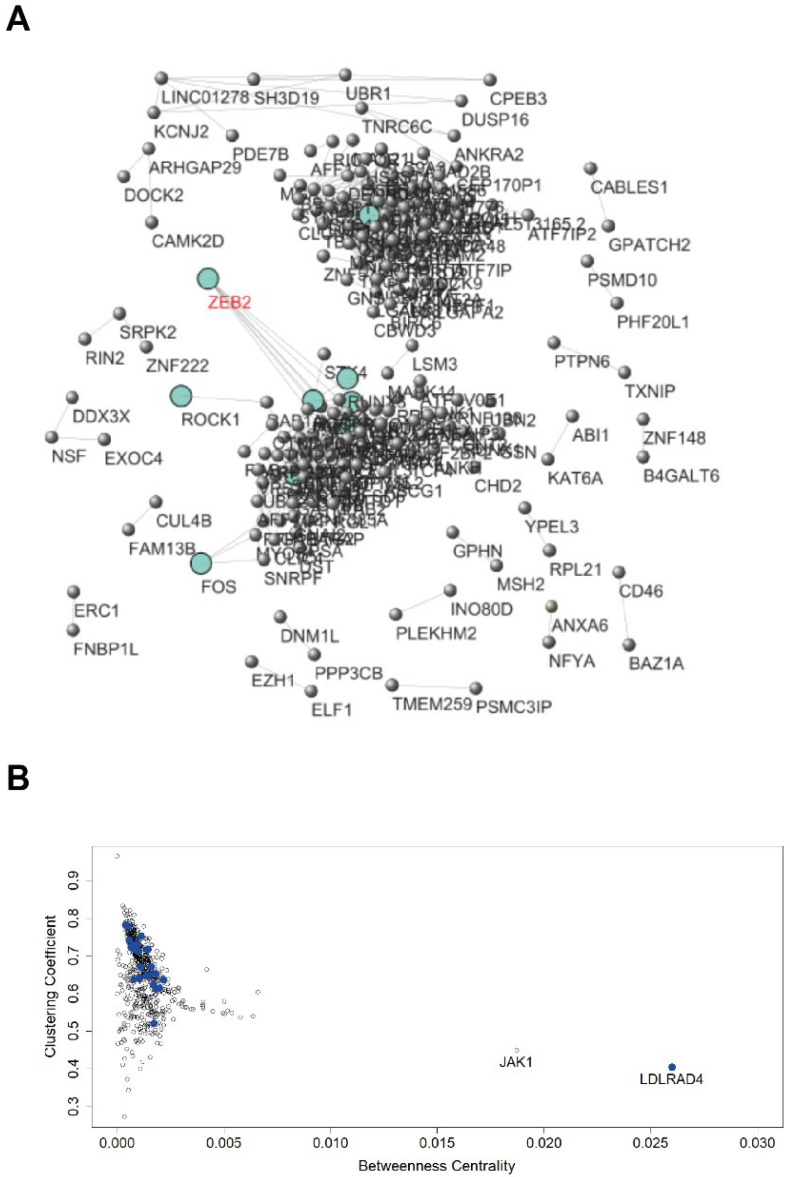
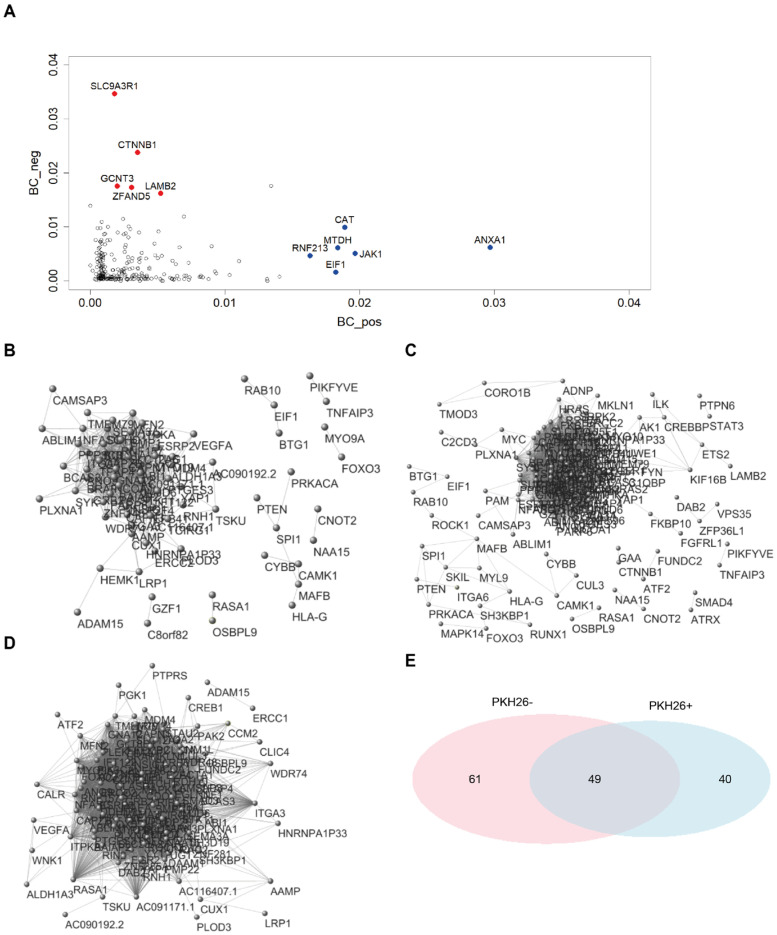
Quiescent cancer cells (QCCs) are a common feature of solid tumors, representing a major obstacle to the long-term success of cancer therapies. We isolated QCCs ex vivo from non-small cell lung cancer (NSCLC) and colorectal cancer (CRC) xenografts with a label-retaining strategy and compared QCCs gene expression profiles to identify a shared "quiescence signature". Principal Component Analysis (PCA) revealed a specific component neatly discriminating quiescent and replicative phenotypes in NSCLC and CRC. The discriminating component showed significant overlapping, with 688 genes in common including ZEB2, a master regulator of stem cell plasticity and epithelial-to-mesenchymal transition (EMT). Gene set enrichment analysis showed that QCCs of both NSCLC and CRC had an increased expression of factors related to stemness/self renewal, EMT, TGF-β, morphogenesis, cell adhesion and chemotaxis, whereas proliferating cells overexpressed Myc targets and factors involved in RNA metabolism. Eventually, we analyzed in depth by means of a complex network approach, both the 'morphogenesis module' and the subset of differentially expressed genes shared by NCSLC and CRC. This allowed us to recognize different gene regulation network wiring for quiescent and proliferating cells and to underpin few genes central for network integration that may represent new therapeutic vulnerabilities. Altogether, our results highlight common regulatory pathways in QCCs of lung and colorectal tumors that may be the target of future therapeutic interventions.

Keywords: colorectal cancer; dormancy; lung cancer; quiescence.


Conflict of interest statement

The authors declare no competing interests.

Figures

Figure 1
Figure 1
PCA and limma results. (A) Samples projection on the loading space of the second and third components. Each point corresponds to a sample of the log-transformed original expression data matrix, whose coordinates are given by the PC2 and PC3 loadings of that sample (see Table 1B). It is worth noting the cell line discrimination on PC2 and the quiescent/proliferative separation on PC3. (B) Mean difference plot reporting average log expression values versus log2 fold changes (logFC). LogFC are obtained performing differential expression analysis on the log-transformed original expression data matrix. Significantly differentially expressed genes are obtained by sorting in decreasing order the LogFC distribution and keeping the top 6000 values (highlighted in red—PKH26+ specific) and the bottom 6000 (highlighted in blue—PKH26 specific), which resulted to be associated to |LogFC| > 1.95. (C,D) Venn diagrams reporting the number of significantly up-regulated genes in the PKH26+ state identified by the limma and PCA approaches highlighting the relevant superposition between the two methods. Duplicated genes are removed. Statistical significance of the overlap: (C) p-value < 1 × 10⁻⁴; RR = 24.0; (D) p-value < 1 × 10⁻⁴; RR = 23.4.
Figure 2
Figure 2
Differential expression analysis performed with Principal Component Analysis is consistent with that performed with the standard limma. (A) Samples projection on the loading space of the first and fourth components. Each point corresponds to a sample of the log-transformed original expression data matrix, whose coordinates correspond to PC2 and PC3 loadings of that sample (see Table 2B). (B) Mean Difference plot reporting average log expression values versus log2 fold changes (logFC). LogFC are obtained performing differential expression analysis on the log-transformed original expression data matrix. Significantly differentially expressed genes are achieved sorting in decreasing order the LogFC distribution and keeping the top 6000 values (highlighted in red—PKH26+ specific) and the bottom 6000 (highlighted in blue—PKH26 specific), which resulted to be associated to |LogFC| > 0.2. (C,D) Venn diagrams reporting the number of significantly up-regulated genes in the PKH26+ state identified by the limma and PCA approaches highlighting the relevant superposition between the two methods. Duplicated genes were removed. Statistical significance of the overlap: (C) p-value < 1 × 10⁻⁴; RR = 12.9; (D) p-value < 1 × 10⁻⁴; RR = 11.8.
Figure 3
Figure 3
Shared genes resulting from differential expression analysis performed with the standard limma. (A) Venn diagram reporting the number of significantly up-regulated genes in the PKH26+ state identified by the limma approach in the lung (3661 genes) and colon (2539 genes) systems, and in both systems (688 genes). Statistical significance of the overlap: p-value < 1 × 10⁻⁴; RR = 7.2. Genes are considered significant if they appear in the first 6000 of the ranking built on the logFC, with a nominal p-value < 0.05. Duplicated genes are removed. (B) Venn diagram reporting the number of significantly down-regulated genes in the PKH26+ state identified by the limma approach in the lung (3672 genes) and colon (2898 genes) systems and in both systems (599 genes). Statistical significance of the overlap: p-value < 1 × 10⁻⁴; RR = 5.9. Genes are considered significant if they appear in the last 6000 of the ranking built on the logFC, with a nominal p-value < 0.05. Duplicated genes are removed. (C) Barplot reporting the number of significantly up- and down-regulated genes in the PKH26+ state, identified by the limma approach and shared by the lung and colon systems, belonging to some interesting KEGG categories (reported on the x-axis) found using Panther. Abbreviations: num_genes = number of genes; down = down-regulated; up = up-regulated.
Figure 4
Figure 4
Lung QCCs and colorectal QCCs share some interesting significantly enriched pathways. (A) RNA sequencing-generated gene set enrichment analysis for Mesenchyme Development (nominal p-value = 0.032, FDR q-value = 0.212), regulation of chemotaxis (nominal p-value = 0.012, FDR q-value = 0.127), cell chemotaxis (nominal p-value = 0.005, FDR q-value = 0.105), cytokine production (nominal p-value = 0.050, FDR q-value = 0.271), response to transforming growth factor beta (nominal p-value < 1 × 10⁻¹⁰, FDR q-value = 0.058), negative regulation of cell population proliferation (nominal p-value = 0.018, FDR q-value = 0.248), transforming growth factor beta receptor signaling (nominal p-value < 1 × 10⁻¹⁰, FDR q-value = 0.057), positive regulation of catalytic activity (nominal p-value = 0.019, FDR q-value = 0.256), regulation of cell adhesion (nominal p-value < 1 × 10⁻¹⁰, FDR q-value = 0.064) and epithelial mesenchymal transition (nominal p-value = 0.005, FDR q-value = 0.051) in PKH26+ lung cancer cells (compared with PKH26 cells). (B) RNA sequencing-generated gene set enrichment analysis for Mesenchyme Development (nominal p-value < 1 × 10⁻¹⁰, FDR q-value = 0.015), regulation of chemotaxis (nominal p-value < 1 × 10⁻¹⁰, FDR q-value = 0.026), cell chemotaxis (nominal p-value = 0.002, FDR q-value = 0.038), cytokine production (nominal pvalue = 0.002, FDR q-value = 0.069), response to transforming growth factor beta (nominal p-value = 0.011, FDR q-value = 0.108), negative regulation of cell population proliferation (nominal p-value = 0.002, FDR q-value = 0.105), transforming growth factor beta receptor signaling (nominal p-value = 0.046, FDR q-value = 0.178), positive regulation of catalytic activity (nominal p-value = 0.030, FDR q-value = 0.230), regulation of cell adhesion (nominal p-value = 0.047, FDR q-value = 0.250) and epithelial mesenchymal transition (nominal p-value < 1 × 10⁻¹⁰, FDR q-value = 0.002) in PKH26+ colon cancer cells (compared with PKH26 cells). (C) Venn diagram reporting the number of significantly enriched gene sets identified in lung PKH26+ cells (282 enriched pathways, p-value < 0.05), colon PKH26+ cells (233 enriched pathways, p-value < 0.05) and in both lung and colon PKH26+ cells (137 enriched pathways, p-value < 0.05). Statistical significance of the overlap: p-value < 1 × 10⁻⁴; RR = 3.4. (D) Venn diagram reporting the number of significantly enriched gene sets identified in lung PKH26 cells (91 enriched pathways, p-value < 0.05), colon PKH26 cells (166 enriched pathways, p-value < 0.05) and in both lung and colon PKH26 cells (22 enriched pathways, p-value < 0.05). Statistical significance of the overlap: p-value = 0.003; RR = 4.4.
Figure 5
Figure 5
Network built on the genes up-regulated in PKH26+ shared by the lung and colon systems. (A) Network visualization. It was built considering as connected only pairs of nodes with extremely elevated correlations (r > |0.98|). (B) Genes’ projection in the Clustering coefficient/betweenness space. It refers to the network built considering the usual threshold of Pearson r = |0.7|. Genes linked to the TGF-β pathway are highlighted in blue.
Figure 6
Figure 6
Network built on the PKH26+, PKH26 and all-samples datasets. (A) Betweenness centrality scores in both PKH26+ (x-axis) and PKH26 (y-axis) networks. “High traffic” genes behaving differently between PKH26+ and PKH26 are highlighted in red. (B) Network visualization from the PKH26+ dataset. Network was built considering as connected only pairs of nodes with extremely elevated correlations (r > |0.98|). See Table S14 for more details. (C) Network visualization from the PKH26 dataset. Network was built considering as connected only pairs of nodes with extremely elevated correlations (r > |0.98|). See Table S15 for more details. (D) Network visualization from the all-samples dataset. Network was built considering as connected only pairs of nodes with extremely elevated correlations (r > |0.98|). See Table S16 for more details. (E) Venn diagram reporting the number of genes identified in the PKH26+ (40 genes) and in the PKH26 network (61 genes), and in both PKH26+ and PKH26 networks (49 genes). Networks were built considering as connected only pairs of nodes with extremely elevated correlations (r > |0.98|). Statistical significance of the overlap: p-value < 1 × 10⁻⁴; RR = 3.6.

References

    1. van Velthoven C.T.J., Rando T.A. Stem Cell Quiescence: Dynamism, Restraint, and Cellular Idling. Cell Stem Cell. 2019;24:213–225. doi: 10.1016/j.stem.2019.01.001. - DOI - PMC - PubMed
    1. Aguirre-Ghiso J.A. Models, mechanisms and clinical evidence for cancer dormancy. Nat. Rev. Cancer. 2007;7:834–846. doi: 10.1038/nrc2256. - DOI - PMC - PubMed
    1. De Angelis M.L., Francescangeli F., La Torre F., Zeuner A. Stem Cell Plasticity and Dormancy in the Development of Cancer Therapy Resistance. Front. Oncol. 2019;9:626. doi: 10.3389/fonc.2019.00626. - DOI - PMC - PubMed
    1. Nik Nabil W.N., Xi Z., Song Z., Jin L., Zhang X.D., Zhou H., De Souza P., Dong Q., Xu H. Towards a Framework for Better Understanding of Quiescent Cancer Cells. Cells. 2021;10:562. doi: 10.3390/cells10030562. - DOI - PMC - PubMed
    1. Yao G. Modelling mammalian cellular quiescence. Interface Focus. 2014;4:20130074. doi: 10.1098/rsfs.2013.0074. - DOI - PMC - PubMed

MeSH terms