. 2022 Aug 31;23(17):9885.
doi: 10.3390/ijms23179885.

α2δ-4 and Cachd1 Proteins Are Regulators of Presynaptic Functions

Affiliations

α2δ-4 and Cachd1 Proteins Are Regulators of Presynaptic Functions

Cornelia Ablinger et al. Int J Mol Sci. .

Abstract

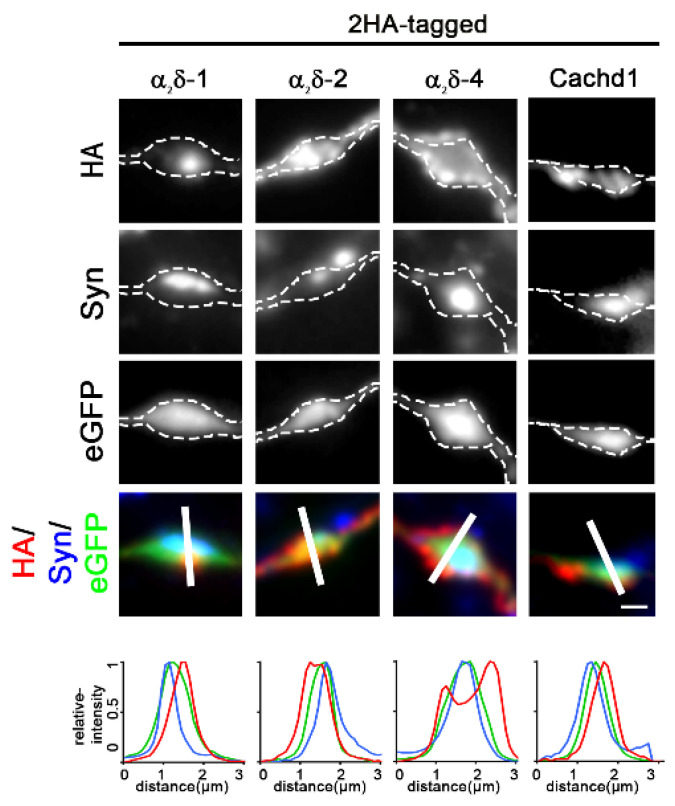
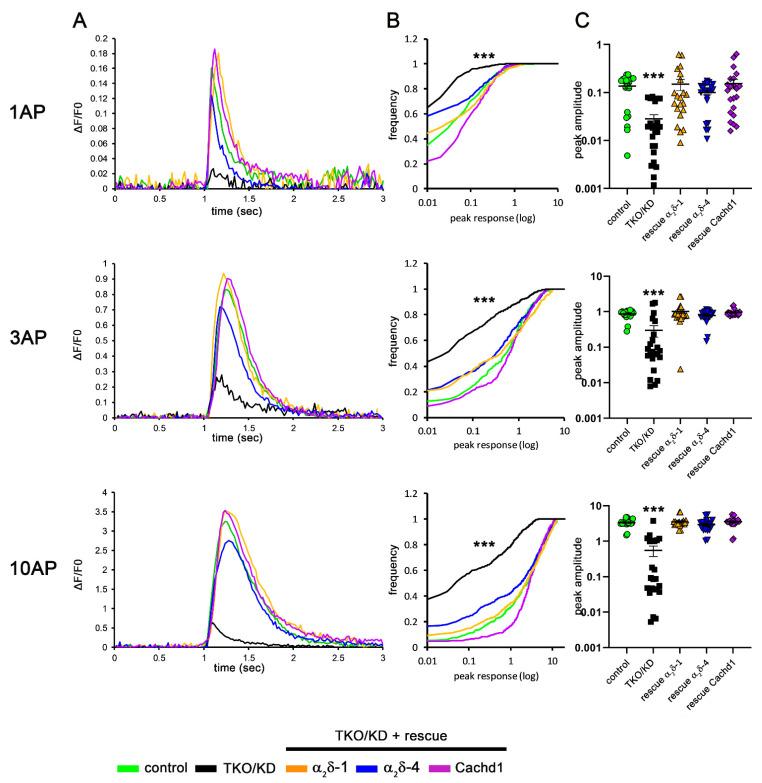
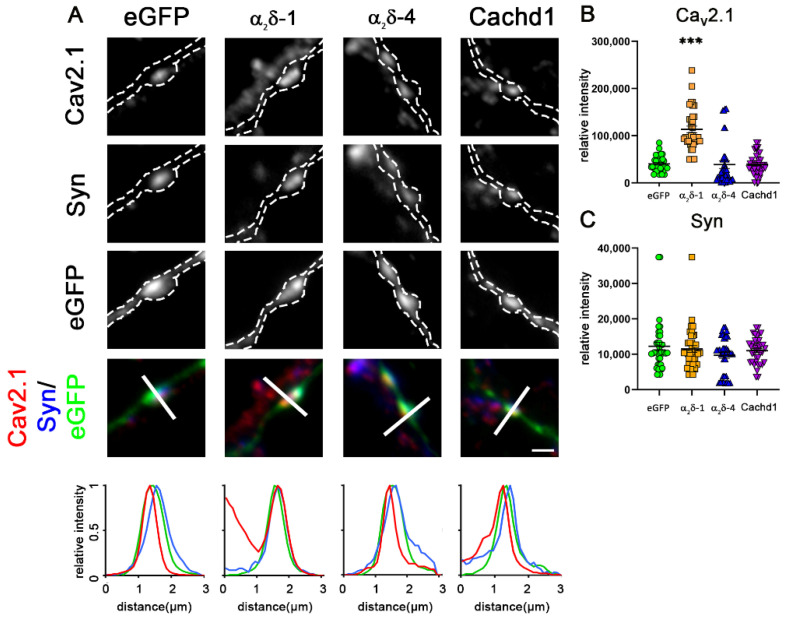
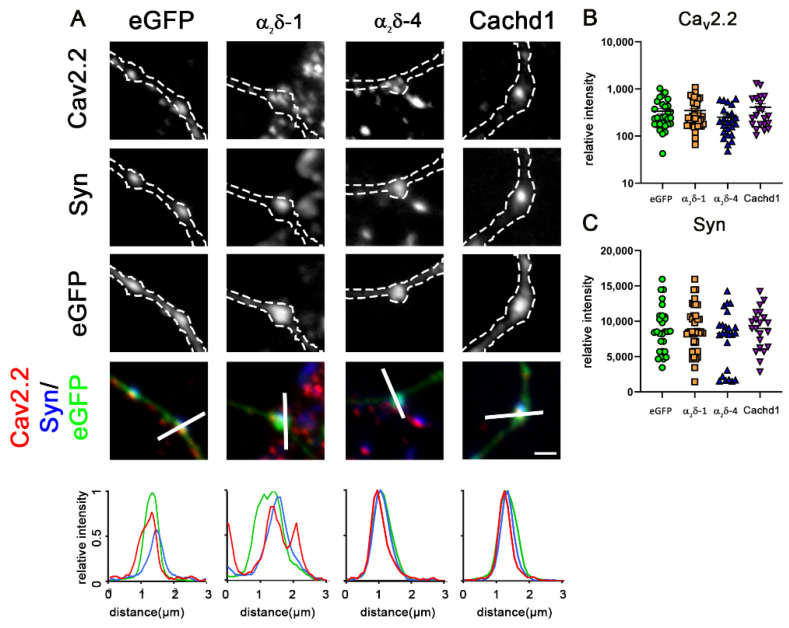
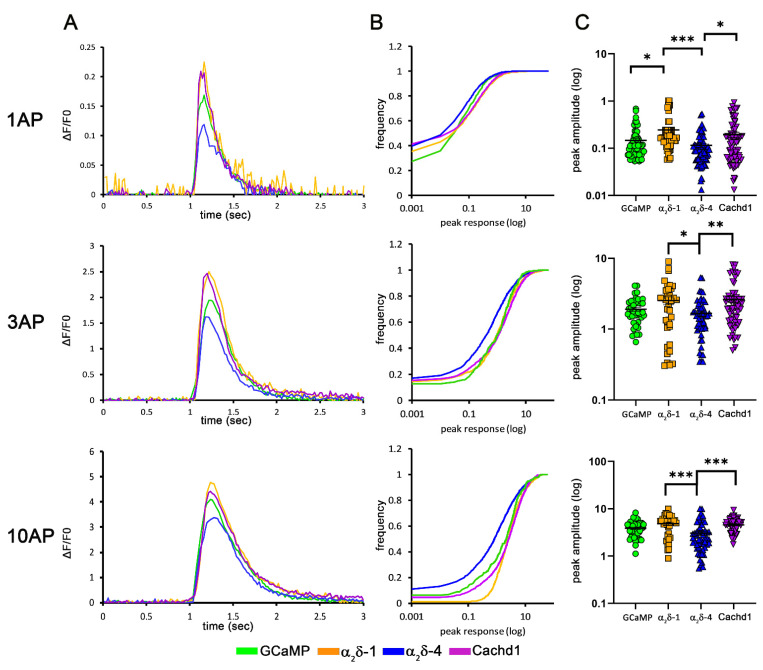
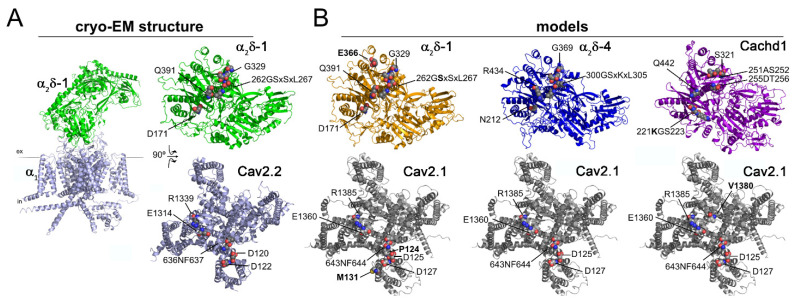
The α2δ auxiliary subunits of voltage-gated calcium channels (VGCC) were traditionally regarded as modulators of biophysical channel properties. In recent years, channel-independent functions of these subunits, such as involvement in synapse formation, have been identified. In the central nervous system, α2δ isoforms 1, 2, and 3 are strongly expressed, regulating glutamatergic synapse formation by a presynaptic mechanism. Although the α2δ-4 isoform is predominantly found in the retina with very little expression in the brain, it was recently linked to brain functions. In contrast, Cachd1, a novel α2δ-like protein, shows strong expression in brain, but its function in neurons is not yet known. Therefore, we aimed to investigate the presynaptic functions of α2δ-4 and Cachd1 by expressing individual proteins in cultured hippocampal neurons. Both α2δ-4 and Cachd1 are expressed in the presynaptic membrane and could rescue a severe synaptic defect present in triple knockout/knockdown neurons that lacked the α2δ-1-3 isoforms (α2δ TKO/KD). This observation suggests that presynaptic localization and the regulation of synapse formation in glutamatergic neurons is a general feature of α2δ proteins. In contrast to this redundant presynaptic function, α2δ-4 and Cachd1 differentially regulate the abundance of presynaptic calcium channels and the amplitude of presynaptic calcium transients. These functional differences may be caused by subtle isoform-specific differences in α12δ protein-protein interactions, as revealed by structural homology modelling. Taken together, our study identifies both α2δ-4 and Cachd1 as presynaptic regulators of synapse formation, differentiation, and calcium channel functions that can at least partially compensate for the loss of α2δ-1-3. Moreover, we show that regulating glutamatergic synapse formation and differentiation is a critical and surprisingly redundant function of α2δ and Cachd1.

Keywords: Cachd1; presynaptic calcium imaging; synapse formation; synaptic differentiation; voltage-gated calcium channels; α2δ subunits.


Conflict of interest statement

The authors declare no competing financial interest.

Figures

Figure 1
Figure 1
α2δ-4 and Cachd1 can be expressed on the somato-dendritic and axonal surface. (A) Live cell surface staining of wildtype primary hippocampal neurons overexpressing soluble eGFP together with HA-tagged constructs of α2δ subunits or Cachd1. (A) The somatic expression pattern of the anti-HA labelling revealed that all α2δ subunits and Cachd1 can be expressed on the neuronal surface. (B) Anti-HA and synapsin immunofluorescent labelling revealed that all α2δ subunits and Cachd1 show synaptic and dendritic membrane targeting (white arrowheads). Neurons overexpressing α2δ-1 displayed a weaker expression pattern on the somatic, dendritic, and axonal surface compared to α2δ-2, α2δ-4, and Cachd1. (C) Quantification of the average HA fluorescent intensities illustrated that the surface expression of α2δ-1 was reduced compared to those of the other subunits. α2δ-2 expression in soma, dendrites, and axons was higher compared to α2δ-1, α2δ-4, and Cachd1. Quantification data are shown as values for individual cells (dots) and means ± SEM. ANOVA with Tukey’s multiple comparison test (C) 16–22 cells per condition from three independent culture preparations. F(3, 60) = 53.6, p < 0.0001. Significances of post hoc test (*** p < 0.001, ** p < 0.01, * p < 0.05) in comparison to α2δ-1, unless otherwise indicated, are indicated with asterisks. Scale bars, 5 µm.
Figure 2
Figure 2
α2δ-4 and Cachd1 can target presynaptic membranes. An analysis of axonal varicosities illustrated a presynaptic localization pattern for all α2δ subunits and Cachd1. This can be inferred from the color overlay and the co-localization of the linescan peaks of HA-α2δ (red), synapsin (blue) and eGFP (green). Axonal varicosities were identified by their eGFP expression and are outlined by a dashed line. α2δ-4 specifically accumulated in the perisynaptic membrane around a central synapsin cluster. Overall, α2δ-2 and α2δ-4 displayed higher axonal expression compared to α2δ-1 and Cachd1 (for a quantitative analysis, see Figure 1C). Scale bar, 1 µm.
Figure 3
Figure 3
All α2δ subunits and Cachd1 rescue glutamatergic synapse formation. (A) Immunofluorescent labelling of synapsin and CaV2.1 in α2δ TKO/KD neurons (α2δ-2/3 double knockout neurons transfected with shRNA-α2δ-1/eGFP) illustrated a severe defect in glutamatergic synapse formation and differentiation, the absence of synapsin and CaV2.1 clusters in presynaptic varicosities. Boutons and axons were identified by their eGFP expression and are outlined by a dashed line. The reintroduction of α2δ-1, α2δ-4, or Cachd1 could rescue the accumulation of CaV2.1 and synapsin in the presynaptic boutons. This is supported in the color overlay, qualitative linescan analysis, and the quantification of the fluorescent intensities of CaV2.1 (B) and synapsin 1 (C). Quantification is represented as values for individual cells (dots) and means ± SEM. ANOVA with Tukey’s multiple comparison test with 39–46 cells per condition from three independent culture preparations. (B) F(3, 169) = 25.85, p < 0.0001, post hoc: *** p< 0.0001. (C) F(3, 169) = 19.25, p < 0.0001, post hoc: *** p < 0.0001. Significance of the TKO/KD in comparison to rescue conditions is indicated in the graphs with asterisks. Scale bar, 1 µm.
Figure 4
Figure 4
All α2δ subunits and Cachd1 can restore presynaptic calcium signaling in α2δ TKO/KD neurons. Mean sample traces (A), cumulative frequency distribution blots (B), and quantification (C) of presynaptic calcium imaging (SynGCaMP6f) in α2δ TKO/KD neurons. (A,C) Presynaptic calcium signals were significantly reduced in TKO/KD neurons (black) in response to 1 action potential (AP), 3 AP, and 10 AP stimulation compared to double heterozygous controls (green). The introduction of α2δ-1 (orange), α2δ-4 (blue), or Cachd1 (purple) restored presynaptic calcium transients in all stimulation patterns. (B) The fraction (see text) and mean of responding synapses in TKO/KD neurons was strongly reduced compared to control and rescue conditions. ANOVA with Tukey’s multiple comparison test: 1 AP: F(4, 2504) = 30.7, p < 0.0001; 3 AP: F(4, 2504) = 38.6, p < 0.0001; 10 AP: F(4, 2504) = 95.0, p < 0.0001. Significances of post hoc tests compared to the TKO/KD condition are indicated in the graphs by asterisks (*** p < 0.001). (C) Quantification shows values for individual cells (dots) and means ± SEM. 21–23 cells per condition were obtained from three independent culture preparations (number of synapses analyzed: control, 483; TKO/KD, 506; rescue α2δ-1, 462; rescue α2δ-4, 484; rescue Cachd1, 484). ANOVA with Tukey’s multiple comparison test: 1 AP: F(4, 105) = 4.5, p = 0.0021; 3 AP: F(4, 105) = 11.6, p < 0.0001; 10 AP: F(4, 105) = 35.9, p < 0.0001. Significances of post hoc tests of TKO/KD compared to the other conditions are indicated in the graphs by asterisks (*** p < 0.001).
Figure 5
Figure 5
Overexpression of α2δ-4 or Cachd1 does not increase presynaptic clustering of CaV2.1 channels. (A) Immunofluorescence analysis of axonal varicosities from wildtype neurons overexpressing eGFP and α2δ or Cachd1 constructs, labelled against synapsin and CaV2.1. Micrographs show immunofluorescent signals of CaV2.1 channels at presynaptic boutons, identified by eGFP expression (outlined with a dashed line) and presynaptic synapsin labelling along untransfected dendrites (see also qualitative linescan analysis). Contrary to neurons overexpressing α2δ-1, which display two times higher CaV2.1 intensity, neurons overexpressing α2δ-4 and Cachd1 exhibited CaV2.1 levels similar to those of the eGFP control. Quantification of CaV2.1 (B) and synapsin 1 (C) shows values for individual cells (dots) and means ± SEM. Cells were obtained from three independent culture preparations. ANOVA with Tukey’s multiple comparison test. (B) 38 cells per condition, F(3, 148) = 41, p < 0.0001. (C) 38 cells per condition, F(3, 148) = 1.4, p = 0.25. Significance of post hoc test in comparison to α2δ-1 is indicated by asterisks (*** p < 0.001). Scale bar, 1 µm.
Figure 6
Figure 6
Overexpression of α2δ-1, α2δ-4, or Cachd1 does not increase clustering of N-type channels. (A) Immunofluorescence analysis of axonal varicosities from wildtype neurons overexpressing eGFP and α2δ or Cachd1 constructs, labelled against synapsin and CaV2.2. Micrographs show immunofluorescent signals of CaV2.2 channels at presynaptic boutons, identified by eGFP expression (outlined with a dashed line) and presynaptic synapsin labelling along untransfected dendrites (see also qualitative linescan analysis). Neurons overexpressing α2δ-1, α2δ-4, or Cachd1 exhibited CaV2.2 levels similar to those of the eGFP control. Quantification of CaV2.2 (B) and synapsin 1 (C) shows values for individual cells (dots) and means ± SEM. Cells were obtained from three independent culture preparations. ANOVA with Tukey’s multiple comparison test. (B) 24–39 cells per condition, F(3, 110) = 1.58, p = 0.20. (C) 24–39 cells per condition, F(3, 110) = 0.99, p = 0.40. Scale bar, 1 µm.
Figure 7
Figure 7
Overexpression of α2δ-4 or Cachd1 does not alter the composition of glutamatergic synapses. (A) Co-transfection of soluble eGFP and α2δ subunits or Cachd1 in combination with immunofluorescent labelling of presynaptic vGlut1 and postsynaptic GABAA-receptors was used to detect the formation of mismatched synapses. Only the overexpression of α2δ-2 led to the formation of mismatched synapses, as detected by postsynaptic GABAA receptor clusters opposite vGlut1 positive glutamatergic terminals (A, α2δ-2). Overexpression of α2δ-4 or Cachd1 did not induce the formation of mismatched synapses and did not alter the molecular composition of glutamatergic synapses. Quantifications of immunofluorescence intensities of vGlut1 (B), GABAA receptor (C), gephyrin (D), GluR1 (E), vGAT (F) and the bouton size as identified by eGFP fluorescence area (G) show values for individual cells (dots) and means ± SEM. Cells were obtained from three independent culture preparations. ANOVA with Tukey’s multiple comparison test was performed on 29–45 cells per condition. (B) F(4, 203) = 0.58, p = 0.68. (C) F(4, 203) = 103.6, p < 0.0001. (D) F(3, 81) = 135.2, p < 0.0001. (E) F(3, 108) = 28.8, p < 0.0001. (F) F(3, 104) = 0.30, p = 0.88. (G) F(3, 306) = 1.0, p = 0.51. Significances of post hoc test in comparison to α2δ-2 are indicated by asterisks (*** p < 0.0001). Scale bar, 1 µm.
Figure 8
Figure 8
α2δ subunits and Cachd1 differentially affect presynaptic calcium transients. Mean sample traces (A), cumulative frequency distribution blots (B), and quantification (C) of presynaptic calcium signals (SynGCaMP6f) in wildtype neurons overexpressing either α2δ or Cachd1 constructs. Overexpression of α2δ-4 led to a reduction in presynaptic calcium signals in response to stimulation with 1 AP, 3 AP and 10 AP (blue) compared to control (green). In contrast, overexpression of α2δ-1 (orange) and Cachd1 (purple) increased calcium transients in all stimulation paradigms, as indicated in the mean sample traces and the maximal responses. Quantification shows values for individual cells (dots) and means ± SEM. 37–53 cells were obtained from four independent culture preparations (number of synapses analyzed: SynGCaMP6f, 1257; α2δ-1, 1122; α2δ-4, 1806; Cachd1, 1650). ANOVA with Tukey’s multiple comparison test: 1 AP: F(3, 244) = 6.4, p = 0.0004; 3 AP: F(3, 185) = 4.7, p = 0.0036; 10 AP: F(3, 183) = 8.7, p < 0.0001. Significances of post hoc tests between conditions are indicated in the graphs by asterisks (*** p < 0.001, ** p < 0.01, * p < 0.05).
Figure 9
Figure 9
Structural interface analysis revealed preferences in complex formation. (A) Cryo-EM structure of the human CaV2.2 calcium channel complex (PDB code: 7MIY), with the α1 subunit (light blue) and α2δ-1 (green.) Next to the membrane view, the complex is opened up to show the interaction interface between α2δ-1 (top) and α1 (bottom). Residues engaging in the subunit interactions are labelled and shown in sphere representation with the respective charges (blue, positive and red, negative). (B) Models of opened complexes (α2δ-1, top and α1, bottom) of the CaV2.1 α1 subunit with mouse α2δ-1, human α2δ-4, and mouse Cachd1. The predicted interacting residues are labelled and shown in sphere representation in the respective charges (blue, positive, and red, negative); additional interacting residues are labelled in bold. Refer to text for description.

References

    1. Dolphin A.C. Calcium Channel Auxiliary α2δ and β Subunits: Trafficking and One Step Beyond. Nat. Rev. Neurosci. 2012;13:542–555. doi: 10.1038/nrn3311. - DOI - PubMed
    1. Felix R., Gurnett C.A., de Waard M., Campbell K.P. Dissection of Functional Domains of the Voltage-Dependent Ca2+ Channel Alpha2delta Subunit. J. Neurosci. 1997;17:6884–6891. doi: 10.1523/JNEUROSCI.17-18-06884.1997. - DOI - PMC - PubMed
    1. Catterall W.A. Voltage-Gated Calcium Channels. Cold Spring Harb. Perspect. Biol. 2011;3:a003947. doi: 10.1101/cshperspect.a003947. - DOI - PMC - PubMed
    1. Calderón-Rivera A., Andrade A., Hernández-Hernández O., González-Ramírez R., Sandoval A., Rivera M., Gomora J.C., Felix R. Identification of a Disulfide Bridge Essential for Structure and Function of the Voltage-Gated Ca2+ Channel α2δ-1 Auxiliary Subunit. Cell Calcium. 2012;51:22–30. doi: 10.1016/j.ceca.2011.10.002. - DOI - PMC - PubMed
    1. Ablinger C., Geisler S.M., Stanika R.I., Klein C.T., Obermair G.J. Neuronal α2δ Proteins and Brain Disorders. Pflügers Arch.-Eur. J. Physiol. 2020;472:845–863. doi: 10.1007/s00424-020-02420-2. - DOI - PMC - PubMed

Substances

LinkOut - more resources