

All- trans Retinoic Acids Synergistically and Beneficially Affect In Vitro Glaucomatous Trabecular Meshwork (TM) Models Using 2D and 3D Cell Cultures of Human TM Cells
- PMID: 36077314
- PMCID: PMC9456377
- DOI: 10.3390/ijms23179912
All- trans Retinoic Acids Synergistically and Beneficially Affect In Vitro Glaucomatous Trabecular Meshwork (TM) Models Using 2D and 3D Cell Cultures of Human TM Cells
Abstract
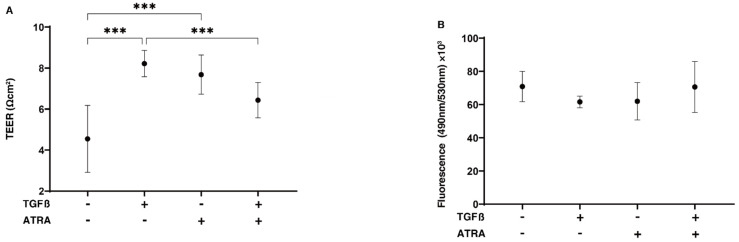
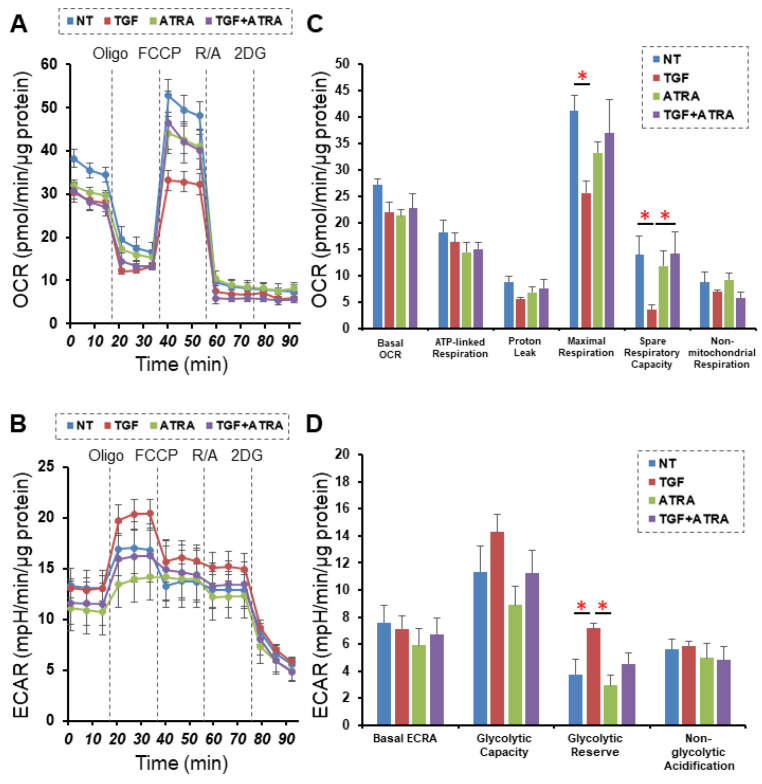
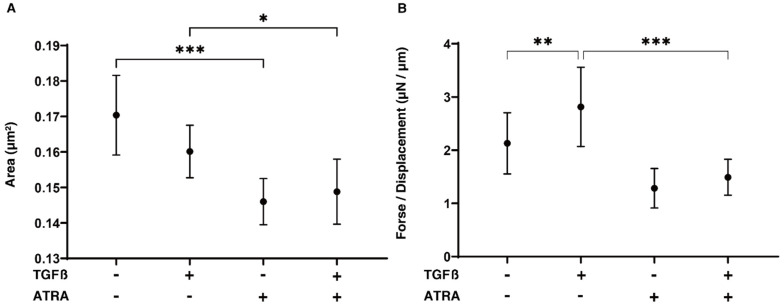
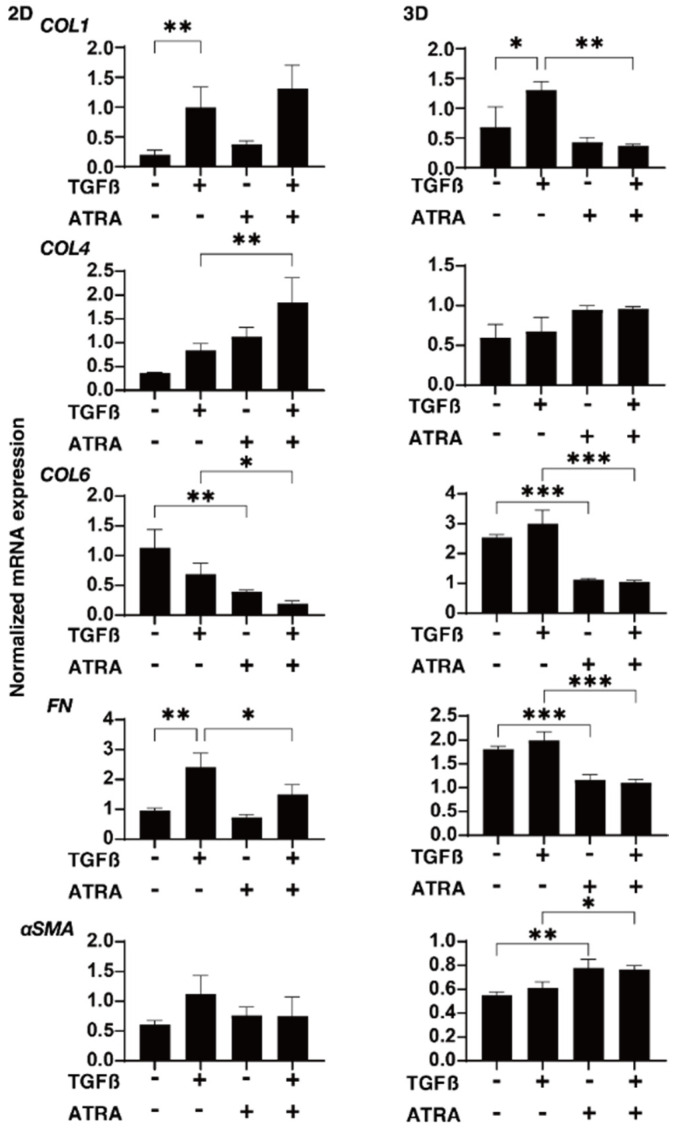
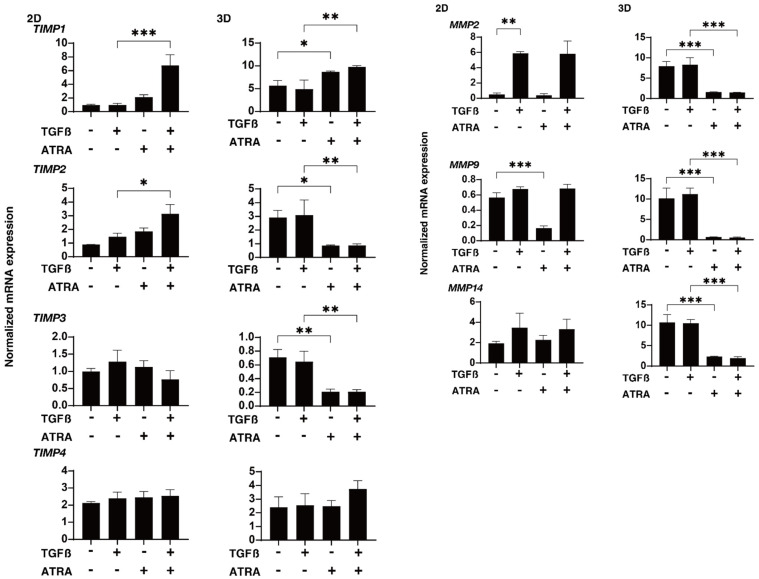
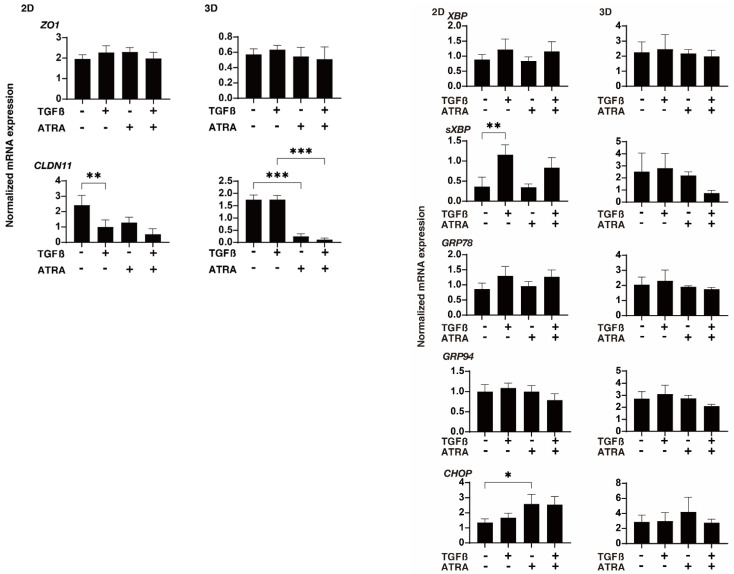
We report herein on the effects of all-trans retinoic acid (ATRA) on two-dimensional (2D) and three-dimensional (3D) cultures of human trabecular meshwork (HTM) cells that were treated with transforming growth factor β2 (TGF-β2). In the presence of 5 ng/mL TGF-β2, the effects of ATRA on the following were observed: (1) the barrier function of the 2D HTM monolayers, as determined by trans-endothelial electrical resistance (TEER) and fluorescein isothiocyanate (FITC) dextran permeability measurements; (2) a Seahorse cellular bio-metabolism analysis; (3) physical properties, including the size and stiffness, of 3D spheroids; (4) the gene expression of extracellular matrix (ECM) molecules, ECM modulators including tissue inhibitor of metalloproteinases (TIMPs), matrix metalloproteinases (MMPs), tight junction (TJ)-related molecules, and endoplasmic reticulum (ER)-stress-related factors. ATRA significantly inhibited the TGF-β2-induced increase in the TEER values and FITC dextran permeability of the 2D monolayers, while an ATRA monotreatment induced similar effects as TGF-β2. A real-time metabolic analysis revealed that ATRA significantly inhibited the TGF-β2-induced shift in metabolic reserve from mitochondrial oxidative phosphorylation to glycolysis in 2D HTM cells, whereas ATRA alone did not induce significant metabolic changes. In contrast, ATRA induced the formation of substantially downsized and softer 3D spheroids in the absence and presence of TGF-β2. The different effects induced by ATRA toward 2D and 3D HTM cells were also supported by the qPCR analysis of several proteins as above. The findings reported here indicate that ATRA may induce synergistic and beneficial effects on TGF-β2-treated 2D- and 3D-cultured HTM cells; those effects varied significantly between the 2D and 3D cultures.
Keywords: TGF-β2; brimonidine; human trabecular meshwork (HTM); three-dimensional spheroid cultures; α2-adrenergic agonist.
Conflict of interest statement
The authors declare no conflict of interest.
Figures
Similar articles
-
Comparison of the Drug-Induced Efficacies between Omidenepag Isopropyl, an EP2 Agonist and PGF2α toward TGF-β2-Modulated Human Trabecular Meshwork (HTM) Cells.J Clin Med. 2022 Mar 16;11(6):1652. doi: 10.3390/jcm11061652. J Clin Med. 2022. PMID: 35329980 Free PMC article.
-
An α2-Adrenergic Agonist, Brimonidine, Beneficially Affects the TGF-β2-Treated Cellular Properties in an In Vitro Culture Model.Bioengineering (Basel). 2022 Jul 12;9(7):310. doi: 10.3390/bioengineering9070310. Bioengineering (Basel). 2022. PMID: 35877361 Free PMC article.
-
TGF-β-3 Induces Different Effects from TGF-β-1 and -2 on Cellular Metabolism and the Spatial Properties of the Human Trabecular Meshwork Cells.Int J Mol Sci. 2023 Feb 20;24(4):4181. doi: 10.3390/ijms24044181. Int J Mol Sci. 2023. PMID: 36835591 Free PMC article.
-
The role of TGF-β2 and bone morphogenetic proteins in the trabecular meshwork and glaucoma.J Ocul Pharmacol Ther. 2014 Mar-Apr;30(2-3):154-62. doi: 10.1089/jop.2013.0220. Epub 2014 Feb 11. J Ocul Pharmacol Ther. 2014. PMID: 24517218 Free PMC article. Review.
-
Smad-independent TGF-β2 signaling pathways in human trabecular meshwork cells.Exp Eye Res. 2017 May;158:137-145. doi: 10.1016/j.exer.2016.07.012. Epub 2016 Jul 21. Exp Eye Res. 2017. PMID: 27453344 Review.
Cited by
-
Nuclear Receptors in Health and Diseases.Int J Mol Sci. 2023 May 23;24(11):9153. doi: 10.3390/ijms24119153. Int J Mol Sci. 2023. PMID: 37298107 Free PMC article.
-
Application of Single Cell Type-Derived Spheroids Generated by Using a Hanging Drop Culture Technique in Various In Vitro Disease Models: A Narrow Review.Cells. 2024 Sep 14;13(18):1549. doi: 10.3390/cells13181549. Cells. 2024. PMID: 39329734 Free PMC article. Review.
-
Potential benefits of vitamin A and its derivatives in glaucoma.Eur J Med Res. 2025 Jul 1;30(1):527. doi: 10.1186/s40001-025-02780-4. Eur J Med Res. 2025. PMID: 40597446 Free PMC article. Review.
References
-
- Brubaker R.F. Flow of aqueous humor in humans [The Friedenwald Lecture] Invest. Ophthalmol. Vis. Sci. 1991;32:3145–3166. - PubMed
MeSH terms
Substances
LinkOut - more resources
Full Text Sources
Medical
