Review
. 2022 Sep 1;23(17):9956.
doi: 10.3390/ijms23179956.

SP and KLF Transcription Factors in Cancer Metabolism

Affiliations
Review

SP and KLF Transcription Factors in Cancer Metabolism

Emilia J Orzechowska-Licari et al. Int J Mol Sci. .

Abstract

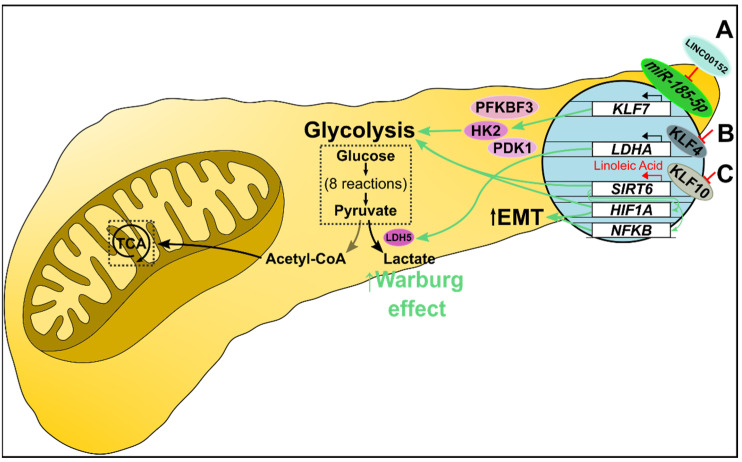
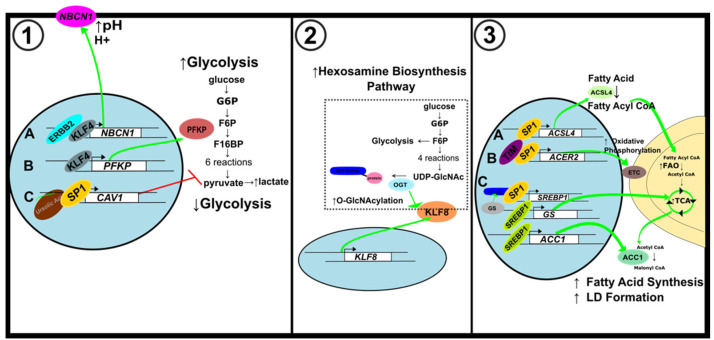
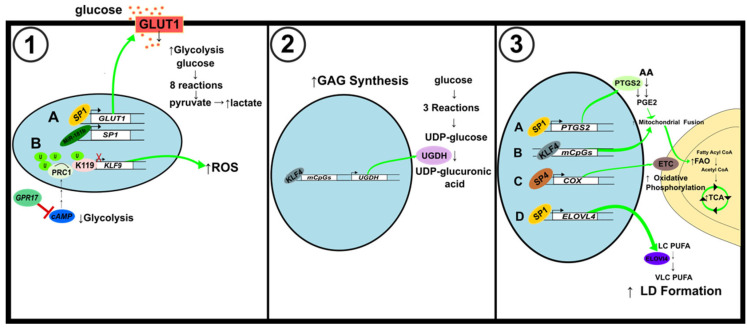
Tumor development and progression depend on reprogramming of signaling pathways that regulate cell metabolism. Alterations to various metabolic pathways such as glycolysis, oxidative phosphorylation, lipid metabolism, and hexosamine biosynthesis pathway are crucial to sustain increased redox, bioenergetic, and biosynthesis demands of a tumor cell. Transcription factors (oncogenes and tumor suppressors) play crucial roles in modulating these alterations, and their functions are tethered to major metabolic pathways under homeostatic conditions and disease initiation and advancement. Specificity proteins (SPs) and Krüppel-like factors (KLFs) are closely related transcription factors characterized by three highly conserved zinc fingers domains that interact with DNA. Studies have demonstrated that SP and KLF transcription factors are expressed in various tissues and regulate diverse processes such as proliferation, differentiation, apoptosis, inflammation, and tumorigenesis. This review highlights the role of SP and KLF transcription factors in the metabolism of various cancers and their impact on tumorigenesis. A better understanding of the role and underlying mechanisms governing the metabolic changes during tumorigenesis could provide new therapeutic opportunities for cancer treatment.

Keywords: Krüppel-like transcription factors; cancer; metabolism; specificity proteins.


Conflict of interest statement

The authors declare no conflict of interest.

Figures

Figure 2
Figure 2
Maximum likelihood phylogeny of the DNA binding domain [15] from all KLF-SP family members identified from human (Homo sapiens), chimpanzee (Pan troglodytes), orangutan (Pongo abelii), macaque (Macaca mulatta), lemur (Microcebus murinus), naked mole rat [nmr] (Heterocephalus glaber), rat (Rattus norvegicus), and mouse (Mus musculus) genome sequence databases. Respectively, those genome database builds were: GRCh38.p14, Clint_PTRv2, Susie_PABv2, Mmul_10, Mmur_3.0, HetGla_female_1.0, mRatBN7.2, and GRCm39. Lemur KLF2 and KLF15 are absent from the Mmur_3.0 database, while the sequence RPGA01000022.1 was used to repair a sequencing gap in the naked mole rat reference genome SP4 sequence, and RGSC6.0/rn6 was used to repair the rat KLF13 sequence. The DNA binding domain of Wilms’ Tumor 1 (WT1) is included as an outgroup. Consensus phylogeny was produced in Geneious 10.2.6 using RAxML 8.2.11 [42] after sampling 200 bootstrap replicate trees calculated using the “Gamma GTR” protein evolutionary model. The tree was rooted on the WT1 outgroup. For display, branches with no distance (100% amino acids identity) were collapsed. When >50% of the taxa for a given gene were collapsed, all species information is excluded from the annotation. Otherwise, the annotation includes all species represented by a given branch. The scale bar represents amino acid substitutions/site.
Figure 1
Figure 1
Sequence alignment of zinc-finger domains of SP and KLF proteins identified in humans (Homo sapiens). Amino acids in black are highly conserved, and similar residues are shown on a lighter background. The DNA binding domain of Wilms’ Tumor 1 (WT1) is included as an example of canonical zinc fingers. All sequences were obtained from the NCBI human genome database [20], assembled using MAAFT [36], and aligned in Geneious 10.2.6 software (https://www.geneious.com, accessed on 17 August 2022).
Figure 3
Figure 3
Metabolic alteration in GI track-associated cancer. (1) Alteration of lipid metabolism in esophageal cancer. (A) Increased level of LPCAT1 activates PI3K signaling pathways, which leads to SP1 and SREBP1 recruitment into the nucleus. Both transcription factors bind to the SQLE regulatory element and induce its expression resulting in increased de novo cholesterol synthesis. (B). Elevated during the tumorigenesis, KLF5 binds to the enhancer and promoter regions of PPARG, activating its expression. PPARγ then binds to the promoters of sphingolipids, phospholipids, and fatty acids synthesis-related genes resulting in increased de novo synthesis. Additionally, the level of PPARγ is stimulated environmentally by a high-fat diet (HFD). (2) Alteration of glucose metabolism in gastric cancer. (A) Upregulated KLF8 binds to the GLUT4 promoter stimulating its expression and, as a consequence, increasing glucose uptake. (B) Interaction between circular RNA RNF111 and its target, miR-876-3p, leads to decreased ability of miR-876-3p to downregulate KLF12 expression. Consequently, upregulated KLF12 stimulates HK-2 expression leading to increased lactate and ATP production. Additionally, KLF12 is believed to positively affect glucose uptake, leading to an increased Warburg effect. (C) SP1, SP3, and KLF4 collectively bind to the ATP2A3 proximal promoter downregulating its expression. Lowered level of sarco/endoplasmic reticulum Ca2+ ATPase SERCA3 results in a loss of intracellular Ca2+ homeostasis and tumorigenesis suppression. (3) Alteration of glucose and lipids metabolism in colorectal cancer. (A) KLF4 decreases the Warburg effect by acting as a tumor suppressor, affecting glucose metabolism on multiple levels. KLF4 binds to the promoter region and upregulates the expression of key glycolytic enzymes: HK-2 and PKM2. Additionally, KLF4 upregulates the expression of lactate transporter MCT4 and stimulates translocation of GLUT1 into the cell membrane. By doing so, KLF4 stimulates the overall glucose uptake and oxidative glucose metabolism and prevents lactic acid buildup. (B) Microbiota component, F. nucleatum, increases intracellular levels of SP1, leading to the induction of SP1-dependent lncRNA-ENO1-IT1 expression and histone acetyltransferase KAT7 recruitment. KAT7 changes the availability of the ENO1 gene, regulates its expression, and downregulates glycolysis. (C) KLF14 binds to the LDHB promoter downregulating its expression. (A–C) Taken together, KLFs and SPs, in the case of colorectal cancer, act as tumor suppressors by turning glucose metabolism into less Warburg effect-like. (D) KLF13 binds to the HMGCS1 promoter and downregulates its expression resulting in decreased de novo cholesterol synthesis. (E) Similarly, KLF2 reduces de novo cholesterol synthesis by mediating the simvastatin effect on HMGCR. A mutated variant of p53 protein present in 50% of colorectal cancer cases reduces KLF2 expression, which leads to the downregulation of p21 protein levels. However, upon simvastatin treatment, the KLF2 level increases and upregulates CDKN1A expression, and downregulates the expression of the mutated variant of TP53, collectively resulting in decreased de novo cholesterol synthesis. (F) KLF9, together with SP5, increases ME1 expression, gene encoding enzyme linking catabolic and anabolic metabolic pathways through NADPH+H+ and leads to an increased de novo synthesis of fatty acids and cholesterol. (G) SP1-dependent expression of β2AR results in an increased phosphorylation of HSL and consequently increased expression of β oxidation-related genes. As a result, the level of triglycerides is reduced, while the levels of free fatty acids and ATP increase.
Figure 4
Figure 4
Metabolic alteration in liver cancer. (A) Increased ODC1 inhibits KLF2 expression, which upregulates PPARγ and downstream pathways. The result is increased de novo adipogenesis, lipogenesis, fatty acid accumulation, and glucose transport in HCC. (B) Inhibition of KLF4 suppresses transcription of MGLL, leading to dysregulated lipolysis and increased cellular monoacylglyceride levels. (C) KLF13 is a transcriptional promoter of ACOT7. In HCC, increased KLF13 upregulates ACOT7 expression which drives the metabolism of long-chain acyl-CoAs to free monounsaturated fatty acids and CoAs. Additionally, C18:1 oleic acid (a monounsaturated fatty acid) production increases cell proliferation and migration. (D) KLF4 is a transcriptional promoter of SIRT4. SET8 inhibits KLF4, which, in turn, suppresses SIRT4 expression. Loss of SIRT4 reduces glutamate and pyruvate metabolism via decreased GLUD1 and PDH, respectively. Consequently, oncogenic cells obey the Warburg effect by shifting to aerobic glycolysis.
Figure 5
Figure 5
Metabolic alteration in pancreatic cancer. (A) miR-185-5p transcriptionally suppresses KLF7 expression. In pancreatic cancer, overexpressed LINC00152 competitively binds miR-185-5p, which promotes KLF7 transcription. KLF7 upregulates several glycolysis-related proteins, including HK2, PFKBF3, and PDK1, increasing glucose uptake, glycolysis, and lactate production. (B) KLF4 negatively regulates LDHA transcription. Decreased KLF4 promotes LDHA transcription and downstream expression of LDH M subunits. Consequently, LDH5 (a tetramer of M subunits) preferentially catalyzes pyruvate to lactate, essentially shunting cells to the Warburg effect. (C) KLF10 regulates glycolysis as a transcriptional promoter of SIRT6. Decreased KLF10 suppresses SIRT6 transcription resulting in NFκB and HIF1α-mediated increased glycolysis and epithelial-mesenchymal transition. Furthermore, linoleic acid treatment increased SIRT6 levels and restored normal glucose metabolism in vitro, and increased survival in vivo.
Figure 6
Figure 6
Metabolic alterations in breast cancer. (1) Alterations to glycolytic metabolism. (A) KLF4 activates NBCN1 expression to maintain pH imbalance caused by increased glycolysis. (B) KLF4 increases glycolytic metabolism by activating PFKP expression. (C) Ursolic acid induces CAV1 expression through SP1 to inhibit glycolysis. (2) Modifications to hexosamine biosynthesis pathway. KLF8 expression is upregulated by OGT, a key regulator of HBP. (3) Alterations to lipid metabolism. (A) SP1 activates ACSL4 expression to increase FAO. (B) SP1 binds to the ACER2 promoter to elevate mitochondrial oxidative phosphorylation. (C) The feedforward loop of O-GlcNAc-Sp1/SREBP1/ACC1 signaling enhances LD formation.
Figure 7
Figure 7
Schematic illustration of metabolic alterations in brain and nerve cancer. (1) Alterations to glycolytic pathway. (A) SP1 activation by miR-181b results in an increase in GLUT1 levels and ultimately glycolysis levels. (B) GPR17 inhibits cAMP to decrease PRC1-mediated histone H2A K119 monoubiquitination of the KLF9 promoter. Activation of KLF9 increases ROS but reduces cell proliferation. (2) Alterations of glycosaminoglycans synthesis. KLF4 binding to mCpGs increases the expression of UGDH, a key regulator of GAG synthesis. (3) Modifications to mitochondrial fusion and fission, and lipid metabolism. (A) SP1 activates PTGS2 to induce mitochondrial fusion and increase ATP production through FAO and the TCA cycle. (B) KLF4 binding to mCpGs also induces mitochondrial fusion. (C) SP4 activates the expression of COX, also known as Complex IV of the ETC, to increase mitochondrial oxidative phosphorylation. (D) SP1 binds to the ELOVL4 promoter to augment LD formation.

References

    1. Lee E.Y., Muller W.J. Oncogenes and tumor suppressor genes. Cold Spring Harb. Perspect. Biol. 2010;2:a003236. doi: 10.1101/cshperspect.a003236. - DOI - PMC - PubMed
    1. DeBerardinis R.J., Chandel N.S. Fundamentals of cancer metabolism. Sci. Adv. 2016;2:e1600200. doi: 10.1126/sciadv.1600200. - DOI - PMC - PubMed
    1. Lasche M., Emons G., Grundker C. Shedding New Light on Cancer Metabolism: A Metabolic Tightrope between Life and Death. Front. Oncol. 2020;10:409. doi: 10.3389/fonc.2020.00409. - DOI - PMC - PubMed
    1. Martinez-Reyes I., Chandel N.S. Cancer metabolism: Looking forward. Nat. Rev. Cancer. 2021;21:669–680. doi: 10.1038/s41568-021-00378-6. - DOI - PubMed
    1. Pavlova N.N., Thompson C.B. The Emerging Hallmarks of Cancer Metabolism. Cell Metab. 2016;23:27–47. doi: 10.1016/j.cmet.2015.12.006. - DOI - PMC - PubMed

MeSH terms

Substances