

Characterization of 22q12 Microdeletions Causing Position Effect in Rare NF2 Patients with Complex Phenotypes
- PMID: 36077416
- PMCID: PMC9456353
- DOI: 10.3390/ijms231710017
Characterization of 22q12 Microdeletions Causing Position Effect in Rare NF2 Patients with Complex Phenotypes
Abstract
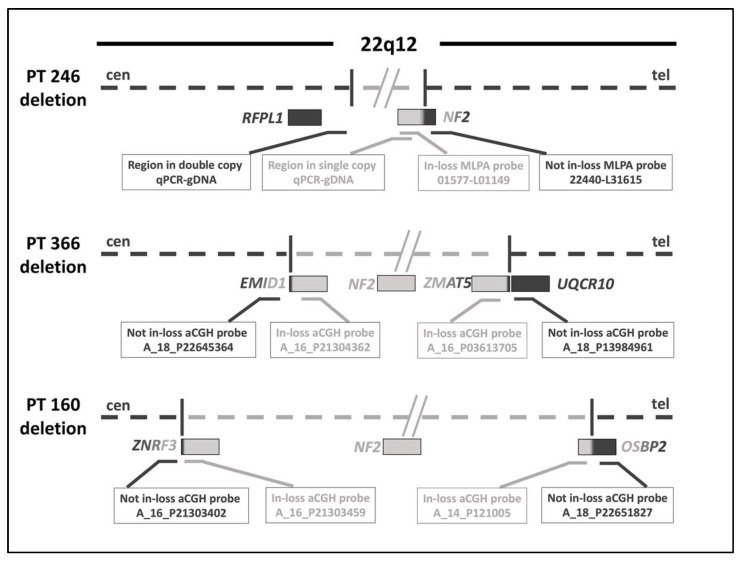
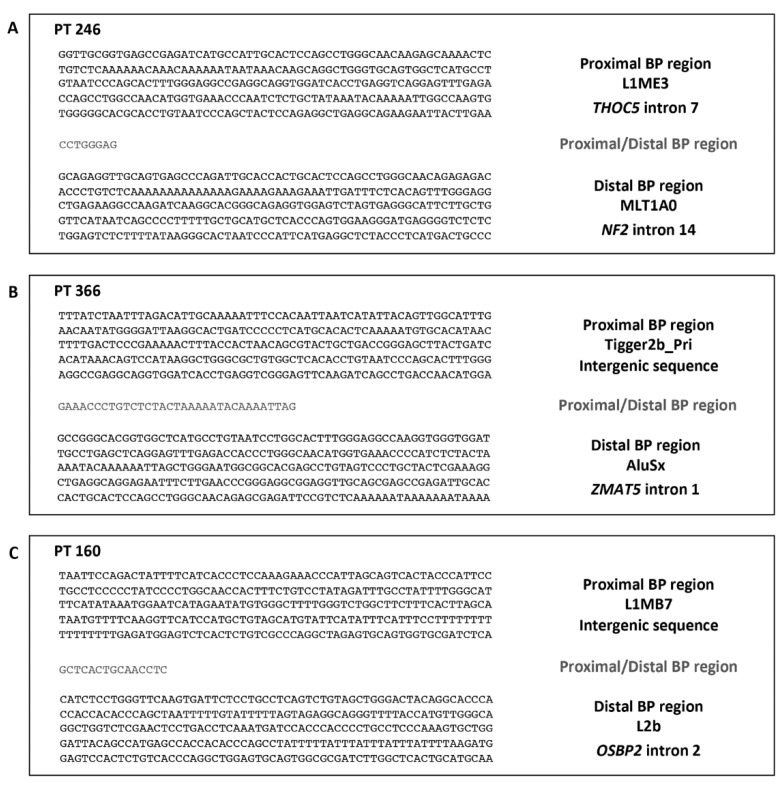
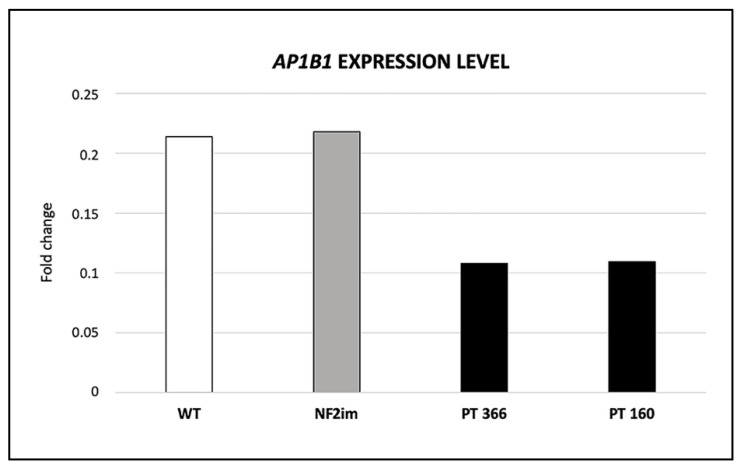
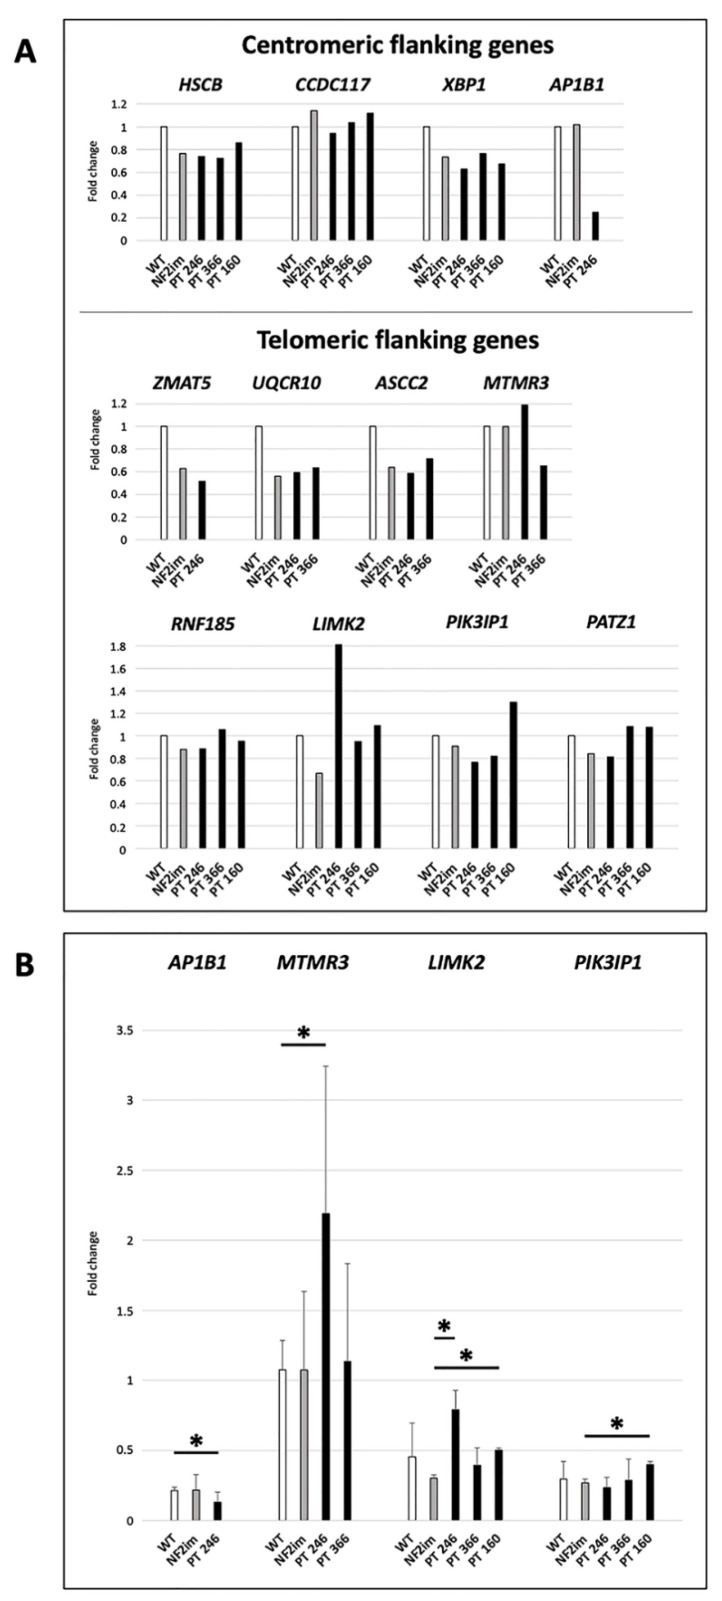
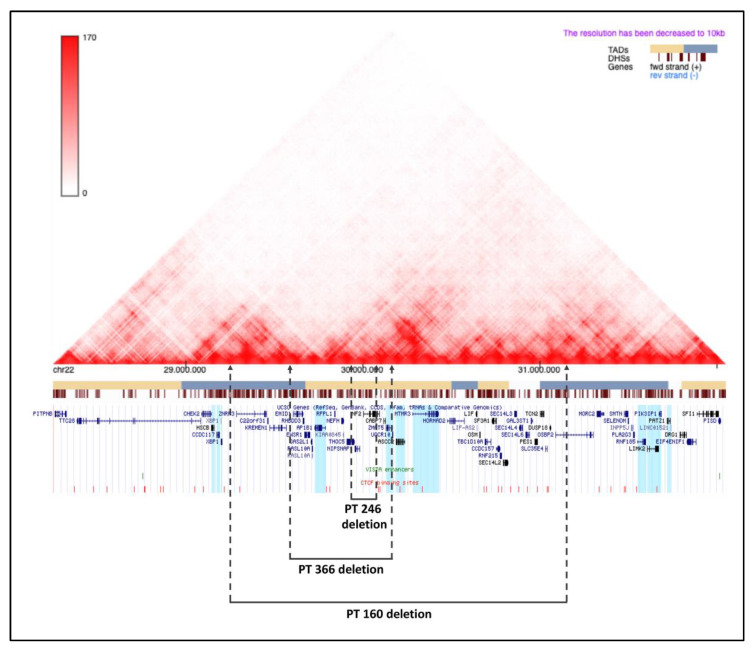
Neurofibromatosis type 2 is an autosomal dominant tumor-prone disorder mainly caused by NF2 point mutations or intragenic deletions. Few individuals with a complex phenotype and 22q12 microdeletions have been described. The 22q12 microdeletions' pathogenic effects at the genetic and epigenetic levels are currently unknown. We here report on 22q12 microdeletions' characterization in three NF2 patients with different phenotype complexities. A possible effect of the position was investigated by in silico analysis of 22q12 topologically associated domains (TADs) and regulatory elements, and by expression analysis of 12 genes flanking patients' deletions. A 147 Kb microdeletion was identified in the patient with the mildest phenotype, while two large deletions of 561 Kb and 1.8 Mb were found in the other two patients, showing a more severe symptomatology. The last two patients displayed intellectual disability, possibly related to AP1B1 gene deletion. The microdeletions change from one to five TADs, and the 22q12 chromatin regulatory landscape, according to the altered expression levels of four deletion-flanking genes, including PIK3IP1, are likely associated with an early ischemic event occurring in the patient with the largest deletion. Our results suggest that the identification of the deletion extent can provide prognostic markers, predictive of NF2 phenotypes, and potential therapeutic targets, thus overall improving patient management.
Keywords: 22q12 microdeletion; NF2; genotype-phenotype correlation; haploinsufficiency; non-allelic homologous recombination; position effect.
Conflict of interest statement
The authors declare no conflict of interest.
Figures
Similar articles
-
Neurofibromatosis type 2 with mild Pierre-Robin sequence showing a heterozygous chromosome 22q12 microdeletion encompassing NF2 and MN1.J Hum Genet. 2022 Nov;67(11):675-678. doi: 10.1038/s10038-022-01068-3. Epub 2022 Aug 15. J Hum Genet. 2022. PMID: 35970985
-
Craniofacial abnormalities and developmental delay in two families with overlapping 22q12.1 microdeletions involving the MN1 gene.Am J Med Genet A. 2015 May;167A(5):1047-53. doi: 10.1002/ajmg.a.36839. Epub 2015 Mar 21. Am J Med Genet A. 2015. PMID: 25810350
-
Severe phenotype of neurofibromatosis type 2 in a patient with a 7.4-MB constitutional deletion on chromosome 22: possible localization of a neurofibromatosis type 2 modifier gene?Genes Chromosomes Cancer. 1999 Jun;25(2):184-90. Genes Chromosomes Cancer. 1999. PMID: 10338003
-
Microdeletion del(22)(q12.2) encompassing the facial development-associated gene, MN1 (meningioma 1) in a child with Pierre-Robin sequence (including cleft palate) and neurofibromatosis 2 (NF2): a case report and review of the literature.BMC Med Genet. 2012 Mar 22;13:19. doi: 10.1186/1471-2350-13-19. BMC Med Genet. 2012. PMID: 22436304 Free PMC article. Review.
-
Emerging genotype-phenotype relationships in patients with large NF1 deletions.Hum Genet. 2017 Apr;136(4):349-376. doi: 10.1007/s00439-017-1766-y. Epub 2017 Feb 17. Hum Genet. 2017. PMID: 28213670 Free PMC article. Review.
Cited by
-
Genetic/epigenetic effects in NF1 microdeletion syndrome: beyond the haploinsufficiency, looking at the contribution of not deleted genes.Hum Genet. 2024 Jun;143(6):775-795. doi: 10.1007/s00439-024-02683-0. Epub 2024 Jun 14. Hum Genet. 2024. PMID: 38874808 Free PMC article.
References
MeSH terms
Substances
LinkOut - more resources
Full Text Sources
Research Materials
Miscellaneous
