. 2022 Sep 2;23(17):10028.
doi: 10.3390/ijms231710028.

Identification and Characterization of Malate Dehydrogenases in Tomato (Solanum lycopersicum L.)

Affiliations

Identification and Characterization of Malate Dehydrogenases in Tomato (Solanum lycopersicum L.)

Muhammad Imran et al. Int J Mol Sci. .

Abstract

Malate dehydrogenase, which facilitates the reversible conversion of malate to oxaloacetate, is essential for energy balance, plant growth, and cold and salt tolerance. However, the genome-wide study of the MDH family has not yet been carried out in tomato (Solanum lycopersicum L.). In this study, 12 MDH genes were identified from the S. lycopersicum genome and renamed according to their chromosomal location. The tomato MDH genes were split into five groups based on phylogenetic analysis and the genes that clustered together showed similar lengths, and structures, and conserved motifs in the encoded proteins. From the 12 tomato MDH genes on the chromosomes, three pairs of segmental duplication events involving four genes were found. Each pair of genes had a Ka/Ks ratio < 1, indicating that the MDH gene family of tomato was purified during evolution. Gene expression analysis exhibited that tomato MDHs were differentially expressed in different tissues, at various stages of fruit development, and differentially regulated in response to abiotic stresses. Molecular docking of four highly expressed MDHs revealed their substrate and co-factor specificity in the reversible conversion process of malate to oxaloacetate. Further, co-localization of tomato MDH genes with quantitative trait loci (QTL) of salt stress-related phenotypes revealed their broader functions in salt stress tolerance. This study lays the foundation for functional analysis of MDH genes and genetic improvement in tomato.

Keywords: QTL mapping; abiotic stress; gene expression; genome analysis; malate dehydrogenase; molecular docking; salt stress; tomato.


Conflict of interest statement

The authors declare no conflict of interest.

Figures
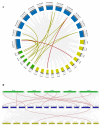
Figure 1
Figure 1
(A) Circos plot of MDH genes in the tomato, Arabidopsis, and rice genome. (B) Collinearity plot of SlMDH genes between Arabidopsis, and rice plant species. The chromosomes of the three species are represented in different colors: tomato, blue; Arabidopsis, green; and rice, dark yellow. All chromosomes are drawn to scale (in Mb). Gray lines in the background show collinear blocks within tomato and other plant genomes, while red lines indicate syntenic MDH gene pairs. The red lines between two chromosomal locations indicate a syntenic relationship between tomato (Sl-1 to 12) and Arabidopsis (1 to 5)/ Rice (1 to 12).
Figure 2
Figure 2
Phylogenetic relationships of MDHs from Solanum lycopersicum, Arabidopsis thaliana, Oryza sativa, Gossypium arboretum and Theobroma cacao. The un-rooted phylogenetic tree was generated with MEGA 6 using the neighbor-joining (NJ) method, and the bootstrap analysis was carried out with a total of 1000 replicates. The MDHs genes from Solanum lycopersicum, Arabidopsis thaliana, Oryza sativa, Gossypium arboretum, and Theobroma cacao were marked with a black circle, red rhombus, pink triangle, blue square, and cyan blue triangle, respectively.
Figure 3
Figure 3
Motif identification (left panel) and gene structure (right panel) analysis of tomato MDHs. Each motif is shown in a different color. The intron/exon structure of tomato MDH genes. Exons and introns are shown by green boxes and grey lines, respectively.
Figure 4
Figure 4
Cis-regulatory motifs found in the promoters of SlMDHs. Cis-elements are represented by various colored rectangles.
Figure 5
Figure 5
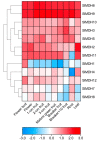
Expression analysis of tomato MDH genes in cultivated tomato cultivar Heinz 1706. Heatmap of RNA-seq data of Heinz. Flower bud, flower (fully opened flowers), 1-cm fruit, 2-cm fruit, 3-cm fruit, mature green fruit, breaker fruit, fruit at 10 days after breaker stage (Breaker+10 fruit), root, and leaf. The expression values were calculated by Log2 (FPKM) and presented according to the color code.
Figure 6
Figure 6
Gene expression analysis of tomato MDH genes under heat, drought, and salt stress using RNA-sequencing data. “D” and “Z” indicate drought and salt, respectively. The expression values were calculated by Log2 (FPKM) and presented according to the color code.
Figure 7
Figure 7
Gene expression analysis of tomato MDH genes in response to salt stress at different time points “0, 3, and 6 h” under 250 mM NaCl treatments. The relative expressions at different stress treatment times were compared with the control (0 h) and the control was set 1 to count fold change expression. Actin was used to normalize the data. Three biological replicates were used in the experiment. Error bars denote standard errors of the means of three independent technical replicates. The asterisks indicate significant differences, as determined by Student’s t-test (* p-value ≤ 0.05, ** and p-value ≤ 0.01).
Figure 8
Figure 8
Molecular docking of Oxaloacetate (Yellow), NAD+ (Green), Malate (Brown) and NADH (Red) with SIMDH2 (A), SIMDH6 (B), SIMDH9 (C), SIMDH11 (D). The enzyme is shown in a blue cartoon while ligands are presented in different colors of sticks.
Figure 9
Figure 9
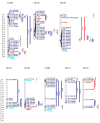
On the chromosomes of tomato, the MDH genes and the quantitative trait loci (QTLs) responsible for salt stress-related traits were found to be in close proximity to one another. This scale illustrates the relative physical locations of genes and QTL-linked markers in megabases (Mb). Genes located within the QTLs are illustrated with red color, while genes and QTLs not co-localized are represented with turquoise and blue colors.

Similar articles

Cited by

References

    1. Fernie A.R., Martinoia E. Malate. Jack of all trades or master of a few? Phytochemistry. 2009;70:828–832. doi: 10.1016/j.phytochem.2009.04.023. - DOI - PubMed
    1. Ocheretina O., Scheibe R. Cloning and sequence analysis of cDNAs encoding plant cytosolic malate dehydrogenase. Gene. 1997;199:145–148. doi: 10.1016/S0378-1119(97)00361-2. - DOI - PubMed
    1. Kromer S. Respiration during photosynthesis. Annu. Rev. Plant Biol. 1995;46:45–70. doi: 10.1146/annurev.pp.46.060195.000401. - DOI
    1. Hall M.D., Levitt D.G., Banaszak L.J. Crystal structure of Escherichia coli malate dehydrogenase: A complex of the apoenzyme and citrate at 1· 87 Å resolution. J. Mol. Biol. 1992;226:867–882. doi: 10.1016/0022-2836(92)90637-Y. - DOI - PubMed
    1. Minarik P., Tomaskova N., Kollarova M., Antalik M. Malate dehydrogenases-structure and function. Gen. Physiol. Biophys. 2002;21:257–266. - PubMed

MeSH terms

LinkOut - more resources