. 2022 Sep 4;23(17):10143.
doi: 10.3390/ijms231710143.

Liposomal Delivery of Newly Identified Prophage Lysins in a Pseudomonas aeruginosa Model

Affiliations

Liposomal Delivery of Newly Identified Prophage Lysins in a Pseudomonas aeruginosa Model

Diana Morais et al. Int J Mol Sci. .

Abstract

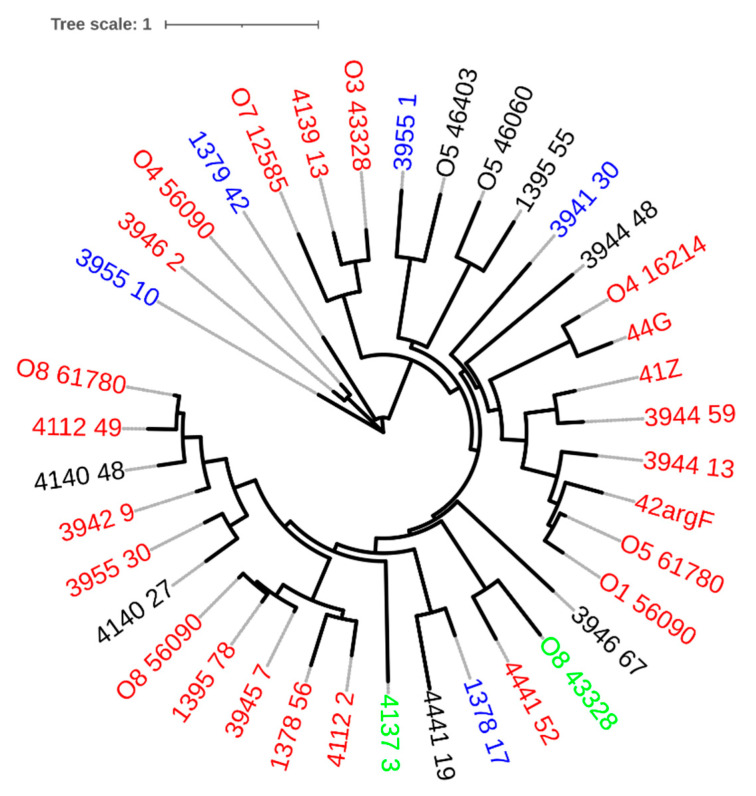
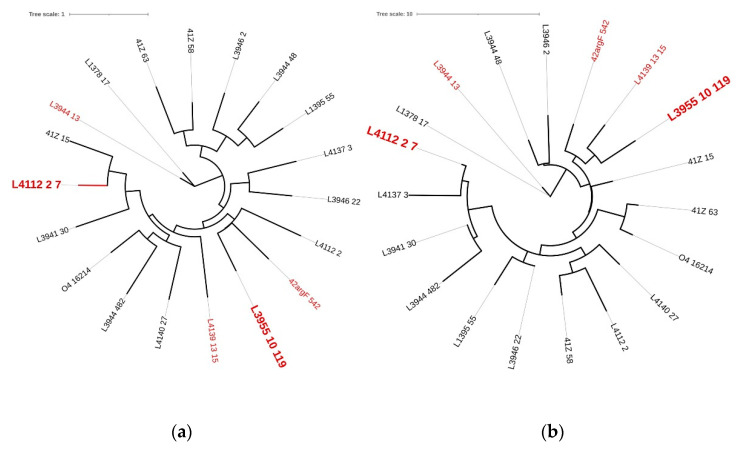
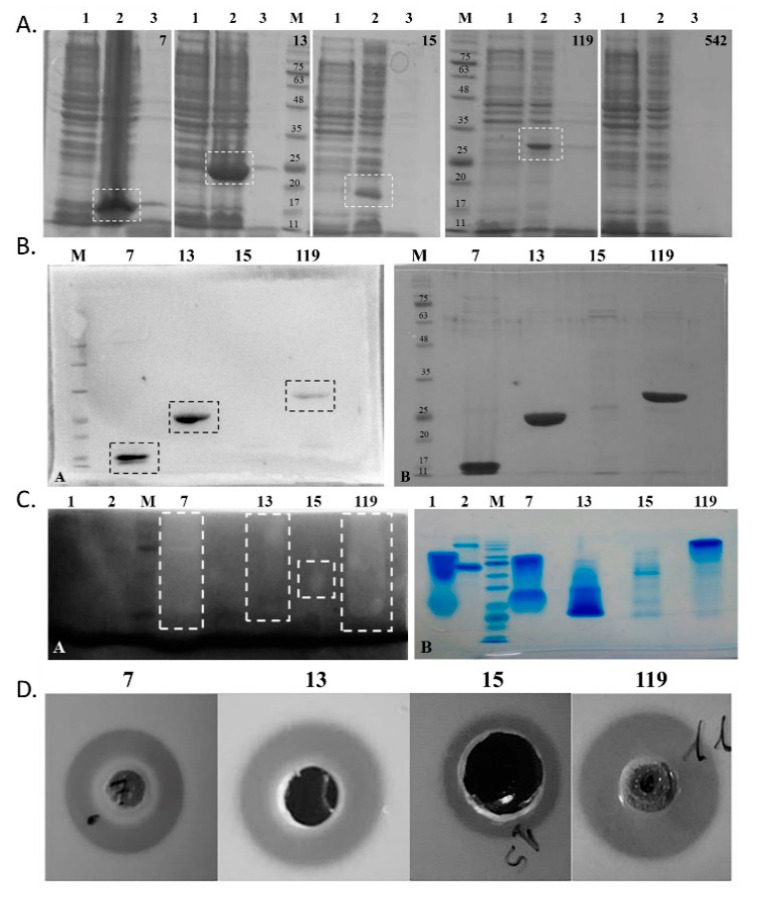
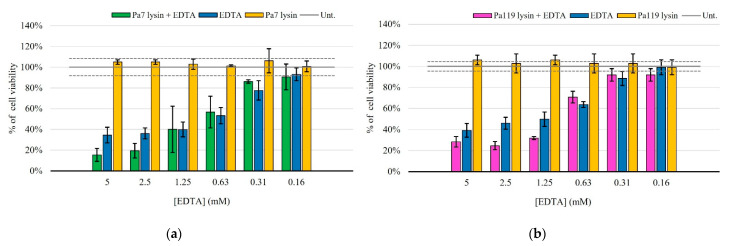
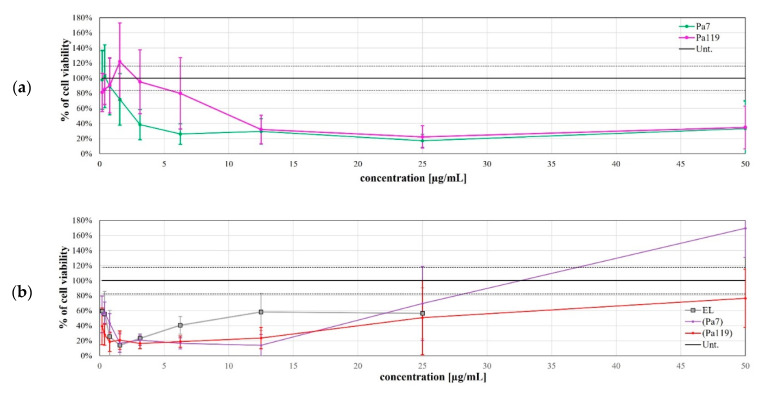
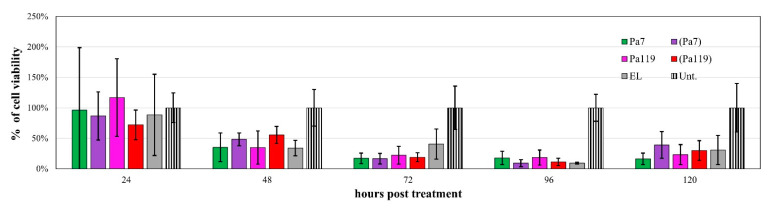
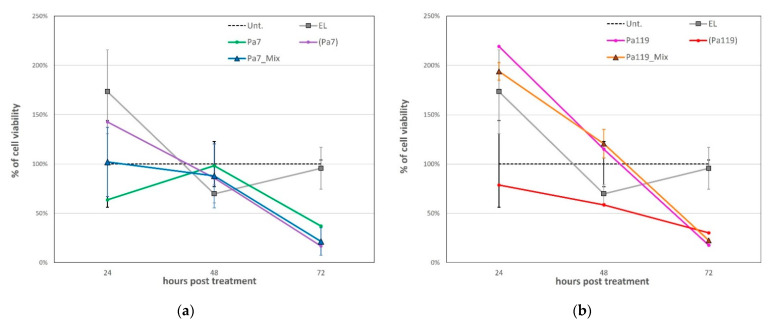
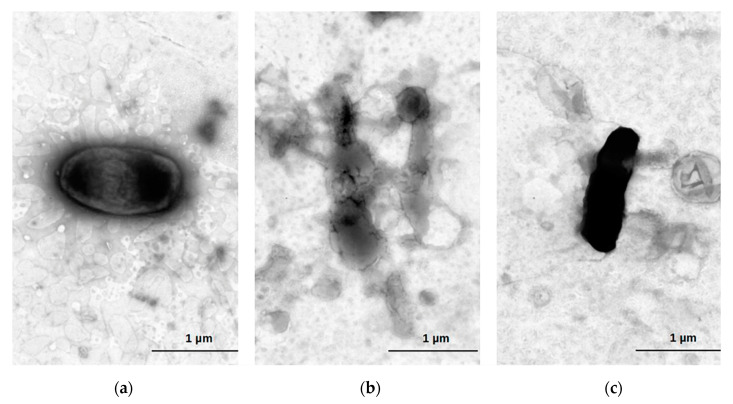
Pseudomonas aeruginosa is a Gram-negative opportunistic bacterium that presents resistance to several antibiotics, thus, representing a major threat to human and animal health. Phage-derived products, namely lysins, or peptidoglycan-hydrolyzing enzymes, can be an effective weapon against antibiotic-resistant bacteria. Whereas in Gram-positive bacteria, lysis from without is facilitated by the exposed peptidoglycan layer, this is not possible in the outer membrane-protected peptidoglycan of Gram-negative bacteria. Here, we suggest the encapsulation of lysins in liposomes as a delivery system against Gram-negative bacteria, using the model of P. aeruginosa. Bioinformatic analysis allowed for the identification of 38 distinct complete prophages within 66 P. aeruginosa genomes (16 of which newly sequenced) and led to the identification of 19 lysins of diverse sequence and function, 5 of which proceeded to wet lab analysis. The four purifiable lysins showed hydrolytic activity against Gram-positive bacterial lawns and, on zymogram assays, constituted of autoclaved P. aeruginosa cells. Additionally, lysins Pa7 and Pa119 combined with an outer membrane permeabilizer showed activity against P. aeruginosa cells. These two lysins were successfully encapsulated in DPPC:DOPE:CHEMS (molar ratio 4:4:2) liposomes with an average encapsulation efficiency of 33.33% and 32.30%, respectively. The application of the encapsulated lysins to the model P. aeruginosa led to a reduction in cell viability and resulted in cell lysis as observed in MTT cell viability assays and electron microscopy. In sum, we report here that prophages may be important sources of new enzybiotics, with prophage lysins showing high diversity and activity. In addition, these enzybiotics following their incorporation in liposomes were able to potentiate their antibacterial effect against the Gram-negative bacteria P. aeruginosa, used as the model.

Keywords: Pseudomonas aeruginosa; antibiotic resistance; bacteriophage; gram-negative bacteria; liposomes; lysins; phage therapy; prophage.


Conflict of interest statement

The authors declare no conflict of interest.

Figures

Figure 1
Figure 1
Phylogenetic tree of prophage genomic sequences, using the Jukes–Cantor substitution model and no bootstrapping/likelihood as branch support method in PHYML 3.3.20180621 (Geneious version 2021.1.1). The tree was visualized with iTOL v6 [30]. Prophages found in P. aeruginosa genomes retrieved from PATRIC start with capital letter O. Each tree leaf is color-coded according to the predicted phage family: red—Siphoviridae; blue—Myoviride; green—Podoviridae.
Figure 2
Figure 2
Phylogenetic trees of prophage lysins based on (a) nucleotides and (b) amino acids sequences. Genomic tree was constructed using the Jukes–Cantor substitution model and no bootstrapping/likelihood as branch support method and the proteomic tree was constructed using the Le Gascuel substitution model and no bootstrapping/likelihood as branch support method in PHYML 3.3.20180621 (Geneious version 2021.1.1). Trees were visualized using iTOL v6 [30]. Red—endolysins selected for cloning; larger leaf names—selected for liposome encapsulation.
Figure 3
Figure 3
Overall assessment of purification and activity over peptidoglycan layer of phage lysins. Top right number depict phage endolysins from the left to right: 7—lysin Pa7 (expected molecular weight: 16.2 kDa); 13—lysin Pa13 (22.9 kDa); 15—lysin Pa15 (23.5 kDa); 119—lysin Pa119 (29.3 kDa); and 542 –lysin Pa542 (16.0 kDa); M—NZYColour Protein marker II (NZYTech, Lisbon, Portugal) with 75, 63, 48, 35, 25, 20, 17, and 11 kDa bands pointed out in (A,B). (A) SDS-PAGE of induction assays of the cloned lysins for (1) non-induced cells, (2) 3 h induced cells and (3) induced culture supernatants. Induced bands are highlighted (dotted box). (B) Western blot (left panel) and parallel SDS-PAGE (right panel) of the purified lysins. Identity of the produced recombinant proteins was confirmed by western-blot targeting (His)6-tagged proteins. Protein bands are highlighted (dotted boxes). (C) Zymogram using P. aeruginosa ATCC 27853 biomass (left panel) and parallel SDS-PAGE under zymogram conditions (right panel) of the purified lysins. Hydrolytic activity was detected as clear bands in the dark background (dotted boxes). (D) Halo-formation assays on M. luteus. Bacteriolytic activity of the purified endolysins was qualitatively assessed against M. luteus in LB agar plates after small-scale kit purification. Positive bacteriolytic activity appears as a clear halo around the protein application as well. For each lysins, 30 µg were applied per well. A total volume of 75 µL was applied in the wells, except for Endolysin Pa15 for which a large well was needed and a 200 µL total volume was applied.
Figure 4
Figure 4
Antibacterial activity of lysins Pa7 (a) and Pa119 (b) in combination with the outer membrane permeabilizer EDTA in P. aeruginosa ATCC 27853. Results are shown as % of cell viability upon treatment and are based on three independent assays. Green—Pa7 lysin in combination with EDTA; pink—Pa119 lysin in combination with EDTA; blue—EDTA only; yellow—each lysin (Pa7 (a) or Pa119 (b)) applied solely. Untreated control is represented as a solid gray line, with the respective 95% confidence interval represented as dashed gray lines.
Figure 5
Figure 5
The bactericidal effect of the free (a) and encapsulated lysins (b) at 72 h post-treatment. The viability curve for the most effective time point (72 h p.t.) is shown. EL—empty liposomes; Pa7—free lysin Pa7 not encapsulated in liposomes; Pa119—free lysin Pa119 not encapsulated in liposomes; (Pa7)—encapsulated lysin Pa7 in liposomes; (Pa119)—encapsulated lysin Pa119 in liposomes; Unt.—untreated control. For both free lysins and encapsulated lysins, concentration refer to protein concentration applied; for empty formulation, concentration refers to the lipidic concentration tested to match the one used on encapsulated lysin application. The most effective concentration of the free lysins (a) is pointed with an orange arrow (25 µg/mL). The same is presented for encapsulated lysins (b) taking in consideration the effect of the empty formulations (6.25 µg/mL). The untreated control is shown as a black line, with the dashed lines representing the 95% confidence interval.
Figure 6
Figure 6
The bactericidal effect of the most effective concentrations of Pa7 and Pa119 up to 120 h post-treatment. EL—empty liposomes; Pa7—Pa7 lysin in the free form; Pa119—Pa119 lysin in the free form; (Pa7)—Pa7 lysin encapsulated in liposomes; (Pa119)—Pa119 lysin encapsulated in liposomes; Unt.—untreated control. The cell viability after treatment up to 120 h is shown for the most effective concentrations of lysins in the free form (25 µg/mL) and for lysins encapsulated in liposomes (6.25 µg/mL). The represented empty liposomes (EL) formulation bars correspond to the lipidic concentration used to match the same conditions of the encapsulated lysins. The untreated control is shown as a striped bar for comparison.
Figure 7
Figure 7
The bactericidal effect of the cocktail approach for lysins Pa7 (a) and Pa119 (b) and respective controls up to 72 h post-treatment. EL—empty liposomes; Pa7—Pa7 lysin in the free form; Pa119—Pa119 lysin in the free form; (Pa7)—Pa7 lysin encapsulated in liposomes; (Pa119)—Pa119 lysin encapsulated in liposomes; Pa7_Mix—lysin cocktail comprising free Pa7 lysin and Pa7 lysin encapsulated in liposomes; Pa119_Mix—lysin cocktail comprising free Pa119 lysin and Pa119 lysin encapsulated in liposomes; Unt.—untreated control. The untreated control is presented as a black dashed line for comparison. The combined application of free and encapsulated lysins did not increase their bactericidal effect.
Figure 8
Figure 8
Cell death after exposure to liposome encapsuled lysins. Electron microscopy of P. aeruginosa ATCC 27853 treated with lysins encapsulated in liposomes. Untreated P. aeruginosa (a); P. aeruginosa treated with 100 μg/mL lysin Pa7 (b) and lysin Pa119 (c) after 120 h. Cells were negatively stained using 1% aqueous uranyl acetate.

References

    1. Al-Wrafy F., Brzozowska E., Górska S., Gamian A. Pathogenic Factors of Pseudomonas Aeruginosa-the Role of Biofilm in Pathogenicity and as a Target for Phage Therapy. Postepy Hig. I Med. Dosw. 2017;71:78–91. doi: 10.5604/01.3001.0010.3792. - DOI - PubMed
    1. Krylov V.N. Advances in Virus Research. Volume 88. Elsevier; Amsterdam, The Netherlands: 2014. Chapter Five–Bacteriophages of Pseudomonas aeruginosa: Long-Term Prospects for Use in Phage Therapy; pp. 227–278. - PubMed
    1. Pang Z., Raudonis R., Glick B.R., Lin T.-J., Cheng Z. Antibiotic Resistance in Pseudomonas aeruginosa: Mechanisms and Alternative Therapeutic Strategies. Biotechnol. Adv. 2019;37:177–192. doi: 10.1016/j.biotechadv.2018.11.013. - DOI - PubMed
    1. Ruiz-garbajosa P., Cantón R. Epidemiology of Antibiotic Resistance in Pseudomonas aeruginosa. Implications for Empiric and Definitive Therapy. Rev. Esp. Quimioter. 2017;30:8–12. - PubMed
    1. Hancock R.E.W., Speert D.P. Antibiotic Resistance in Pseudomonas aeruginosa: Mechanisms and Impact on Treatment. Drug Resist. Updates Rev. Comment. Antimicrob. Anticancer. Chemother. 2000;3:247–255. doi: 10.1054/drup.2000.0152. - DOI - PubMed

LinkOut - more resources