. 2022 Aug 26;14(17):4137.
doi: 10.3390/cancers14174137.

TROP2 Represents a Negative Prognostic Factor in Colorectal Adenocarcinoma and Its Expression Is Associated with Features of Epithelial-Mesenchymal Transition and Invasiveness

Affiliations

TROP2 Represents a Negative Prognostic Factor in Colorectal Adenocarcinoma and Its Expression Is Associated with Features of Epithelial-Mesenchymal Transition and Invasiveness

Jiří Švec et al. Cancers (Basel). .

Abstract

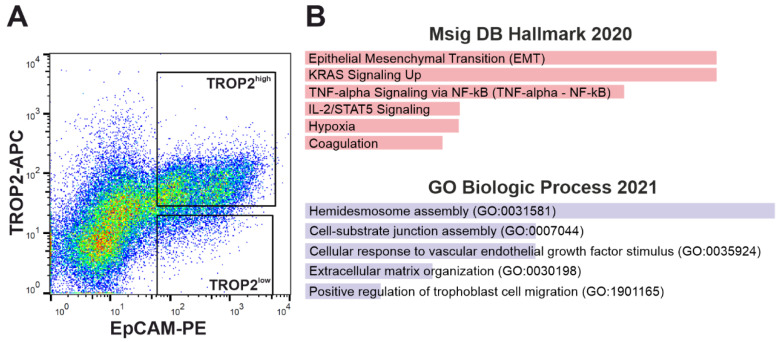
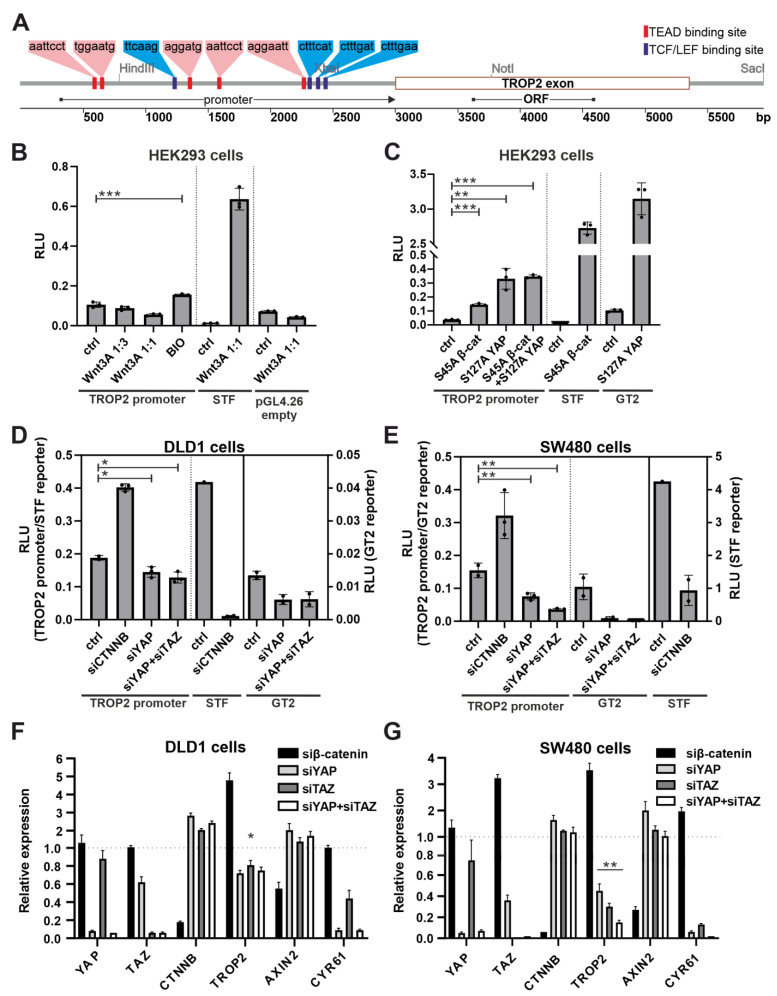
Trophoblastic cell surface antigen 2 (TROP2) is a membrane glycoprotein overexpressed in many solid tumors with a poor prognosis, including intestinal neoplasms. In our study, we show that TROP2 is expressed in preneoplastic lesions, and its expression is maintained in most colorectal cancers (CRC). High TROP2 positivity correlated with lymph node metastases and poor tumor differentiation and was a negative prognostic factor. To investigate the role of TROP2 in intestinal tumors, we analyzed two mouse models with conditional disruption of the adenomatous polyposis coli (Apc) tumor-suppressor gene, human adenocarcinoma samples, patient-derived organoids, and TROP2-deficient tumor cells. We found that Trop2 is produced early after Apc inactivation and its expression is associated with the transcription of genes involved in epithelial-mesenchymal transition, the regulation of migration, invasiveness, and extracellular matrix remodeling. A functionally similar group of genes was also enriched in TROP2-positive cells from human CRC samples. To decipher the driving mechanism of TROP2 expression, we analyzed its promoter. In human cells, this promoter was activated by β-catenin and additionally by the Yes1-associated transcriptional regulator (YAP). The regulation of TROP2 expression by active YAP was verified by YAP knockdown in CRC cells. Our results suggest a possible link between aberrantly activated Wnt/β-catenin signaling, YAP, and TROP2 expression.

Keywords: APC; EMT; TACSTD2; WNT/β-catenin signaling; colorectal cancer; expression profiling; organoids.


Conflict of interest statement

The authors declare no conflict of interest.

Figures

Figure 1
Figure 1
TROP2 gene expression and protein localization in human adenoma and adenocarcinoma samples. (A) Upregulated TROP2 gene expression at different stages of the neoplastic transformation sequence; TROP2 expression levels at the indicated tumor stage were compared with healthy colon biopsy samples. Data are presented as medians (black squares), 25th and 75th percentiles (boxed areas), and minimum and maximum values (“whiskers”); outlier values are also indicated (small rotated black squares). The association between the TROP2 expression profile and the histology grade of the neoplasia is significant, as shown by the Spearman and Kendall coefficient values. **, p < 0.01. (B) Representative microscopic images of immunohistochemical detection of TROP2 in normal colonic mucosa (colon) and in the indicated types of preneoplastic lesions. (C) Heterogeneous TROP2 expression in colorectal cancer; typical staining in adenocarcinomas with strong (CRC1), moderate (CRC2), and no TROP2 expression (CRC3) is shown. The corresponding lymphoid (CRC1-m and CRC2-m) or hepatic (CRC3-m) metastases have a TROP2 staining pattern similar to the primary tumor. Note the positive staining of intrahepatic cholangiocytes (empty arrowhead). All specimens were stained with substrate 3,3-diaminobenzidine (DAB; dark brown precipitate) and counterstained with hematoxylin (blue nuclear stain). Ctrl, healthy colon; HYP, hyperplastic polyps (n = 9); LGD, adenomas with low-grade dysplasia (n = 24); HGD, adenomas with high-grade dysplasia (n = 25); CRC, invasive carcinoma (n = 12); original magnification 100×.
Figure 2
Figure 2
Analysis of cancer-specific survival and prognostic significance of TROP2 in 292 patients with colorectal cancer. (A) Kaplan–Meier survival curves calculated for groups with high (score 9–12) and low/medium (score 0–8) TROP2 expression showed poorer survival in patients with TROP2 overexpression. (B) Restricted mean survival time (RMST) is significantly shorter in the high TROP2 expression group than in the low/medium score group (5.93 vs. 7.68 years, p = 0.0012). (C) Kaplan–Meier analysis based on the TROP2 proportion score showed poor prognosis in patients with ≥25% positively stained TROP2 cancer cells (p = 0.00016). (D) Forrest plot showing significant results of multivariate Cox regression identifying high TROP2 expression as an independent negative prognostic factor in patients with CRC (p = 0.006) along with lymph node involvement (p < 0.001) and age ≥ 75 years (p = 0.015); CK7—cytokeratin 7; * p < 0.05; ** p < 0.01; *** p < 0.001.
Figure 3
Figure 3
Analysis of human cells obtained from CRC specimens. (A) A representative diagram shows the fluorescence-activated cell-sorting gate used to obtain TROP2high and TROP2low human colon tumor cells; see Materials and Methods for further details. (B) Analysis of gene expression profiles of TROP2high human tumor cells. Differentially expressed genes (n = 72) enriched in TROP2high cells (significance criterion: adjusted p-value < 0.05) were analyzed using the Molecular Signatures Database (MSigDB) Hallmark 2020 and Gene Ontology (GO) Biological Processes 2021 gene set collections. The adjusted p-value (calculated from Fisher’s exact test) was assigned to each category; the top five categories with the adjusted p-value < 0.01 are shown. The lengths of the columns correspond to the significance of each column in the graph—the longer the column, the higher the significance. The genes are listed in Supplementary Table S4.
Figure 4
Figure 4
Analysis of Trop2 expression in two mouse models of intestinal tumorigenesis. (A) Immunohistochemical detection of Trop2 in the indicated mouse strains 7 (upper image) or 21 (bottom image) days after tamoxifen administration. Specimens were counterstained by hematoxylin; scale bar: 100 µm. (B) Schematic diagram of the experimental setup for tumor cell isolation. The middle part of the diagram shows a crypt with the dividing cells (these cells produce the Ki67-RFP fusion protein) and stem cells expressing EGFP and CreERT2 recombinase; cells containing active (nuclear) Cre recombinase (after tamoxifen administration) are labeled by yellow arrowheads. The left and right parts of the diagram depict neoplastic intestinal lesions (marked by red fluorescence) that developed after Apc inactivation with the indicated Cre driver. (C) Stereomicroscopic images of native RFP/tdTomato fluorescence (left) and immunodetection of PCNA- and Trop2-positive (white arrowheads; right) cells in the middle part of the small intestine 7 days (top image) and 6 weeks (bottom image) after Apc inactivation. The specimens were counterstained with 4′,6-diamidine-2′-phenylindole dihydrochloride (DAPI; nuclear blue florescent signal). (D) Sorting of cell populations used for expression profiling. Scale bars: 2 mm (left panel) and 100 µm (middle panel).
Figure 5
Figure 5
Analysis of gene expression profiles of Trop2+ tumor cells isolated from Apc-deficient neoplasia developed in two mouse models of Apc gene inactivation. (A) Venn diagram indicating the number of genes differentially expressed in Trop2-positive cells (compared to Trop2-negative cells) isolated from the hyperplastic epithelium of Ki67-RFP ApccKO/cKO VillinCreERT2 mice or microadenomas of Rosa26-tdTomato ApccKO/cKO Lgr5-EGFP-CreERT2 mice 7 days or 6 weeks after Apc inactivation, respectively. Significance criterion: |log2 FC| > 1; adjusted p-value < 0.01. The genes are listed in Supplementary Tables S5–S7. Differentially expressed genes were further analyzed using the MSigDB Hallmark 2020 (B) and GO Biological Processes 2021 (C) gene set collections. The adjusted p-value (calculated from Fisher’s exact test) was assigned to each category; five top categories with the adjusted p-value < 0.01 are shown. Note that the statistical significance was not reached for the overlap gene set using when the GO Biological Processes 2021 database was used. The coloring and length of the columns corresponds to the significance of each column in the graph—the longer column and lighter color indicate higher significance. (D) Immunodetection of Trop2 and vimentin in microadenomas that developed in ApccKO/cKO Lgr5-EGFP-CreERT2 mice 6 weeks after Apc inactivation; magnified image of the inset is on the right. Arrowheads point to Trop2-positive epithelial cells with accumulated vimentin. Specimens were counterstained with DAPI; scale bar: 50 μm.
Figure 6
Figure 6
Hyperactivation of the Wnt pathway stimulates TROP2 in healthy colon organoids. (A) Left, qRT-PCR analysis of expression levels of the indicated genes in human healthy colon organoids (Healthy) and organoids derived from human CRC. The organoids were cultured either in standard organoid medium (ENR), or in ENR medium supplemented with next-generation surrogate Wnt ligand (WntSur) at final concentrations of 0.05 nM, 0.1 nM, and 0.5 nM (WntSur 0.05, WntSur 0.1, and WntSur 0.5, respectively). RNA samples isolated from three healthy and three tumor organoid cultures were analyzed (each in technical triplicate; the average value of each triplicate is represented by a grey or red dot, respectively). The diagram shows ΔCt counts, i.e., the cycle threshold (Ct) value of the gene of interest minus the Ct-value of housekeeping gene β-ACTIN (the lower the ΔCt value, the higher the gene expression); black lines indicate the mean value for three biological replicates; * p < 0.05; ** p < 0.01; *** p < 0.001. Wnt/β-catenin target genes—axis inhibition protein 2 (AXIN2), achaete-scute complex homolog 2 (ASCL2), leucine-rich repeat containing G protein-coupled receptor 5 (LGR5); differentiation markers—alkaline phosphatase (ALPI), sucrase-isomaltase (SIM); and genes related to the EMT status—E-cadherin and vimentin. Right: fluorescent microscopy images of TROP2 (membranous green fluorescent signal) in tumor organoids derived from human CRC; organoids with intermediate levels of TROP2 mRNA (ΔCt value ± 13, see the very left diagram) were used for the staining. The organoids were cultured either in the ENR medium alone or in the ENR medium containing 0.5 nM WntSur (WENR). Note that the TROP2 protein expression is independent of the presence of WntSur in the culture medium. The specimen was counterstained with DAPI. Left images show three-dimensional (3D) projection of the whole organoid; right images show one image layer; representative pictures are shown. Scale bar: 10 µm. (B) Left: quantitative RT-PCR analysis of expression levels of the YAP/TAZ signaling target genes. The experimental setup is identical to panel (A); ANKRD1, ankyrin repeat domain 1; ANXA1, annexin A1; CTGF, connective tissue growth factor; CTSE, cathepsin E; CYR61, cysteine-rich angiogenic inducer 61; E2F1, E2F transcription factor 1; SCA1/LY6a, stem cell antigen-1/lymphocyte antigen 6; TEAD2, TEA domain transcription factor 2. Right: fluorescent microscopy images of TROP2 (membranous green fluorescent signal) and YAP (nuclear red florescent signal) protein localization in a healthy human colon organoid. The organoids were cultured in the WENR medium containing 0.5 nM WntSur. The specimen was counterstained with DAPI. Setting of the left image is described in panel (A); right image shows maximal intensity projection of six adjacent layers; the enlarged image is shown in the inset. Scale bar: 25 µm.
Figure 7
Figure 7
The human TROP2 promoter harbors multiple binding sites for transcription factors TEAD and TCF/LEF and is activated by YAP. (A) A graphical schema of the human TROP2 locus showing the regulatory/promoter region harboring the TEAD and TCF/LEF binding sites (red and blue bars indicate the relative positions of the above consensus binding sequences within the promoter region) detected by the CiiDER in silico analysis tool. A sequence labeled “promoter” was cloned into the firefly luciferase reporter for functional analysis; ORF represents the open reading frame region of the TROP2 single-exon gene. The positions of the selected restriction endonuclease sites are also indicated. (B) Luciferase assay in HEK293 cells transfected with the pGL4.26 reporter vector containing the TROP2 promoter region or the Wnt/β-catenin-responsive SuperTopFlash reporter (STF) or the empty pGL4.26 vector. To stimulate the Wnt pathway, transfected cells were treated with increasing concentrations of Wnt3A-conditioned medium (mixed with standard culture medium as indicated) or with GSK3 inhibitor BIO; “ctrl” indicates cells without Wnt3a or BIO treatment. (C) Luciferase assay in HEK293 cells co-transfected with the indicated reporters and constructs expressing mutant variants of β-catenin (S45A) or YAP (S127A); “ctrl” indicates cells transfected with the reporter and an empty expression vector. Luciferase reporter assays after knockdown of β-catenin, YAP, and/or TAZ in DLD1 (D) and SW480 (E) cells. Cells were transfected with the reporter plasmid along with siRNA(s) as indicated. All experiments were performed in triplicate; firefly luciferase levels were normalized to Renilla luciferase levels. Results are expressed as relative luciferase units (RLU). Quantitative RT-PCR analysis of DLD1 (F) and SW480 (G) cells after knockout of β-catenin, YAP, and/or TAZ. Cells were treated with siRNAs as indicated; results were normalized to TBP mRNA levels. The experiment was performed in triplicate, and results are shown as relative expression compared with a sample treated with a non-silencing siRNA. Error bars in all graphs indicate SDs; * p < 0.05; ** p < 0.01; *** p < 0.001.
Figure 8
Figure 8
Immunodetection of Trop2 and YAP in the small intestine of the indicated mouse strains 6 weeks (top images) and 7 days (bottom images) after Apc inactivation. Images in insets are magnified on the right; samples were counterstained with DAPI. Arrowheads in the magnified images (1) and (2) indicate nuclei in WT crypts that are sparsely positive for YAP, whereas healthy epithelium on the villus is predominantly YAP negative (3). White arrows mark areas of transformed epithelium at the villus edge of the crypt (4), in adenomas (5), or at the villus tip (6) with Trop2 expression and YAP nuclear localization; scale bar: 50 μm.
Figure 9
Figure 9
Immunohistochemical detection of TROP2 and YAP in CRCs shows considerable heterogeneity, with YAP showing stronger expression. Serial sections of primary CRC (A,B) and lymph node (C,D) and liver metastases (E,F) were stained for TROP2 and YAP. Positive staining of intrahepatic cholangiocytes (black arrows in E,F) was used as an internal control; original magnification 200×.

References

    1. Sung H., Ferlay J., Siegel R.L., Laversanne M., Soerjomataram I., Jemal A., Bray F. Global Cancer Statistics 2020: GLOBOCAN Estimates of Incidence and Mortality Worldwide for 36 Cancers in 185 Countries. CA Cancer J. Clin. 2021;71:209–249. doi: 10.3322/caac.21660. - DOI - PubMed
    1. Pehalova L., Krejci D., Snajdrova L., Dusek L. Cancer incidence trends in the Czech Republic. Cancer Epidemiol. 2021;74:101975. doi: 10.1016/j.canep.2021.101975. - DOI - PubMed
    1. Lipinski M., Parks D.R., Rouse R.V., Herzenberg L.A. Human trophoblast cell-surface antigens defined by monoclonal antibodies. Proc. Natl. Acad. Sci. USA. 1981;78:5147–5150. doi: 10.1073/pnas.78.8.5147. - DOI - PMC - PubMed
    1. Szala S., Froehlich M., Scollon M., Kasai Y., Steplewski Z., Koprowski H., Linnenbach A.J. Molecular cloning of cDNA for the carcinoma-associated antigen GA733-2. Proc. Natl. Acad. Sci. USA. 1990;87:3542–3546. doi: 10.1073/pnas.87.9.3542. - DOI - PMC - PubMed
    1. Linnenbach A.J., Wojcierowski J., Wu S.A., Pyrc J.J., Ross A.H., Dietzschold B., Speicher D., Koprowski H. Sequence investigation of the major gastrointestinal tumor-associated antigen gene family, GA733. Proc. Natl. Acad. Sci. USA. 1989;86:27–31. doi: 10.1073/pnas.86.1.27. - DOI - PMC - PubMed