. 2022 Aug 31;14(17):4265.
doi: 10.3390/cancers14174265.

Nucleolin Therapeutic Targeting Decreases Pancreatic Cancer Immunosuppression

Affiliations

Nucleolin Therapeutic Targeting Decreases Pancreatic Cancer Immunosuppression

Matteo Ponzo et al. Cancers (Basel). .

Erratum in

Abstract

Background: The pancreatic ductal adenocarcinoma (PDAC) microenvironment is highly fibrotic and hypoxic, with poor immune cell infiltration. Recently, we showed that nucleolin (NCL) inhibition normalizes tumour vessels and impairs PDAC growth. Methods: Immunocompetent mouse models of PDAC were treated by the pseudopeptide N6L, which selectively inhibits NCL. Tumour-infiltrating immune cells and changes in the tumour microenvironment were analysed. Results: N6L reduced the proportion of regulatory T cells (Tregs) and myeloid-derived suppressor cells (MDSCs) and increased tumour-infiltrated T lymphocytes (TILs) with an activated phenotype. Low-dose anti-VEGFR2 treatment normalized PDAC vessels but did not modulate the immune suppressive microenvironment. RNAseq analysis of N6L-treated PDAC tumours revealed a reduction of cancer-associated fibroblast (CAF) expansion in vivo and in vitro. Notably, N6L treatment decreased IL-6 levels both in tumour tissues and in serum. Treating mPDAC by an antibody blocking IL-6 reduced the proportion of Tregs and MDSCs and increased the amount of TILs, thus mimicking the effects of N6L. Conclusions: These results demonstrate that NCL inhibition blocks the amplification of lymphoid and myeloid immunosuppressive cells and promotes T cell activation in PDAC through a new mechanism of action dependent on the direct inhibition of the tumoral stroma.

Keywords: PDAC; immune cells; nucleolin; vessels.


Conflict of interest statement

The authors declare no conflict of interest.

Figures

Figure 1
Figure 1
N6L reduces the amount of regulatory T lymphocytes in mPDAC tumours. Immunocompetent syngenic FVB/n mice were injected with mPDAC cells into the pancreas. Mice were treated one week after cell inoculation with N6L (7 mg/kg) or saline solution by i.p. injections three times a week for three weeks. (A) Mice were sacrificed, and tumour volumes were measured. Graph shows a representative experiment (from three independent experiments). (B,C) CD4+, CD8+ T lymphocytes and regulatory T lymphocytes (Tregs) from tumour tissues were analysed by flow cytometry among the CD45+ cells, and the fold change of the % of CD45+CD4+, CD45+CD8+, or CD45+CD4+FoxP3+ cells of N6L-treated tumours relative to the control are plotted in the graphs. Graphs show the fold changes of three experiments. (D) The graphs show the % of CD45+CD4+FoxP3+ of control and N6L-treated mice in lymph nodes and in spleen of mice of the representative experiment in (A), and the CD8/Treg ratio in lymph nodes. In A (Control n = 8 mice, N6L n = 6 mice) and in B, C and D the sample number is indicated on the graphs and depends on the efficiency of cell isolation and flow cytometer analysis. p-values were calculated between indicated conditions by the two-tailed Mann-Whitney U-test (**, p < 0.01; *, p < 0.05; ns = not significant).
Figure 2
Figure 2
N6L impacts myeloid cell infiltration in mPDAC tumours. Myeloid cells infiltrated in control or N6L-treated tumours were analysed by flow cytometry. (A) Frequency of CD11b+ myeloid cells of control and N6L-treated tumours. (B) Tumour-associated macrophages were analysed by flow cytometry and the % of M1 (CD45+CD11b+F4/80+CD11c+MRC-) and of M2 (CD45+CD11b+F4/80+CD11cMRC+) macrophages of control and N6L-treated tumours were plotted as indicated. (C) Myeloid suppressor cells (MDSCs) were analysed by flow cytometry, and the % of Gr-MDSCs (CD11b+Ly6G+Ly6Clow) and of M-MDSCs (CD11b+Ly6GLy6Chi) were plotted as indicated. p-values were calculated between indicated conditions by two-tailed Mann-Whitney U-test (**, p < 0.01; *, p < 0.05; ns = not significant; n are indicated on graphs).
Figure 3
Figure 3
N6L increases lymphocyte infiltration and activation in mPDAC tumours. (A) Tumour sections of control and N6L-treated mice were immunostained by an anti-CD8 antibody to detect CD8+ cells (arrows); scale bar: 50 μm. (B) CD8+ cells in tumoral regions (at least 4) of tumour slices were counted by using QuPath software, and the results were plotted as a mean for each tumour (n = 6) as the number of cells/mm2. Two-tailed Mann-Whitney U-test (**, p < 0.01; n = 5 tumours) was applied. (C) Effector T cell activation was analysed by flow cytometry, and the % of CD3+IFNγ+ cells in control and N6L-treated mice is plotted (two-tailed Mann-Whitney U-test **, p < 0.01; n = 6 mice).
Figure 4
Figure 4
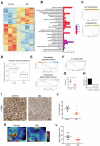
N6L regulates tumour stroma compartment. Tumours from mPDAC mice were harvested, and mRNAs were analysed by RNAseq. Data were normalized using the DESeq method. The heatmap of the differentially expressed genes is shown in (A); the Gene Ontology enrichment analysis is represented in (B), where the bars represent the number of genes and the colour, the p-value of the Fisher exact test; selected results of the GSEA analysis of regulated genes are shown in (C,E,F). (D) Boxplot of the RNA-based quantification of fibroblasts using MCP counter comparing N6L treatment with control. (G) IL-6 protein level in the tumours of control and N6L-treated mice quantified by ELISA are shown as the pg/mm2 of tumour (two-tailed Mann-Whitney U-test, *, p < 0.05, control n = 6, and N6L n = 7 tumours). (H) IL-6 semi-quantitative analysis of the plasma protein level from a pool of distinct cohorts of mice (healthy mice, tumour-bearing control mice, tumour-bearing mice treated by N6L), performed by protein array. Fold increase of healthy mice vs. tumour-bearing control mice and tumour-bearing N6L-treated mice vs. tumour-bearing control mice are represented. (I) Tumour sections of control and N6L-treated mice were immunostained by an anti-α-SMA antibody; the area covered by CAFs expressing anti-α-SMA was quantified and results are plotted in (J) (two-tailed Mann-Whitney U-test, *, p < 0.05; n = 5 tumours). Scale bar: 50 μm. (K,L) Tumour stiffness was measured using shear wave elastography (SWE), as described in Materials and Methods, in control and N6L-treated tumours at the endpoint of the experiment (two-tailed Mann-Whitney U-test, *, p < 0.05, n = 6 tumours).
Figure 5
Figure 5
N6L regulates CAF viability and IL-6 expression. (A) Immunoblot analysis of nucleolin in cell lysates from HEK293T (293T), human immortalized CAFs, MIA PaCa-2, and PANC-1 cells or (C) of nucleolin in CAFs treated or not with N6L (5, 10, or 30 µM) for 24 h. β-Actin was used as loading control. Nucleolin protein level of Western blots was analysed, and the ratio of nucleolin/β-actin intensity in different cell lines is shown in (B) or after N6L treatment as fold change to untreated cells 0 (D). (C,D) CAFs were treated by increasing concentrations of N6L (1, 2, 3, and 5 µM), and cell growth was assessed by Incucyte® live-cell imaging over 96 h. Representative pictures of 5 µM N6L and control are shown in C. Scale bar: 100 μm. (D) CAF confluence (%) was calculated with Incucyte® software and normalized to non-treated cells. (E,F) IL-6 relative expression analysis in CAFs non-treated or treated with N6L 5 µM for 72 h. mRNA levels were normalized to GAPDH. For (B,D,G) (two-tailed Mann-Whitney t-test, *, p < 0.05, n = 3 experiments).Uncropped WB images were shown in Figure S4.
Figure 6
Figure 6
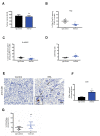
Anti-IL-6 antibody mimics N6L effects on PDAC immune microenvironment. mPDAC tumours were generated as in Figure 2 and treated with anti-IL-6 blocking antibody or IgG control antibody for three weeks, three times per week, by i.p. injection. Mice were sacrificed 21 days after the treatments. (A) Tumour volumes were measured as in Figure 2, and graphs show a representative experiment (from two independent experiments). (BD) Immune cell populations in tumour tissues were analysed by flow cytometry as in Figure 2. Tregs and PMN-MDSC were analysed, and the results are plotted as the fold change of the % of (B) CD45+CD4+FoxP3+ cells and (C) CD11b+Ly6G+Ly6Clow cells in N6L-treated tumours relative to control tumours. (D) Fold change of the CD8/Treg ratio between control and N6L-treated tumours. (E) Tumour sections of control and anti-IL-6-treated mice were immunostained by an anti-CD8 antibody, CD8+ cells were counted (arrows), and results were plotted as (F) the number of cells/mm2. Scale bar: 50 μm. p-values were calculated between indicated conditions by two-tailed Mann-Whitney t-test (**, p < 0.01; *, p < 0.05; n = 5 mice). (G) Effector T cell activation was analysed by flow cytometry as in Figure 3C, and the % of CD3+IFNγ+ cells in control and N6L-treated mice is plotted (two-tailed Mann-Whitney U-test **, p < 0.01; control, n = 5 mice; anti-IL-6, n = 4 mice).

References

    1. Bray F., Ferlay J., Soerjomataram I., Siegel R.L., Torre L.A., Jemal A. Global Cancer Statistics 2018: GLOBOCAN Estimates of Incidence and Mortality Worldwide for 36 Cancers in 185 Countries. CA Cancer J. Clin. 2018;68:394–424. doi: 10.3322/caac.21492. - DOI - PubMed
    1. Ferlay J., Colombet M., Soerjomataram I., Dyba T., Randi G., Bettio M., Gavin A., Visser O., Bray F. Cancer Incidence and Mortality Patterns in Europe: Estimates for 40 Countries and 25 Major Cancers in 2018. Eur. J. Cancer. 2018;103:356–387. doi: 10.1016/j.ejca.2018.07.005. - DOI - PubMed
    1. Christenson E.S., Jaffee E., Azad N.S. Current and Emerging Therapies for Patients with Advanced Pancreatic Ductal Adenocarcinoma: A Bright Future. Lancet Oncol. 2020;21:e135–e145. doi: 10.1016/S1470-2045(19)30795-8. - DOI - PMC - PubMed
    1. Nevala-Plagemann C., Hidalgo M., Garrido-Laguna I. From State-of-the-Art Treatments to Novel Therapies for Advanced-Stage Pancreatic Cancer. Nat. Rev. Clin. Oncol. 2020;17:108–123. doi: 10.1038/s41571-019-0281-6. - DOI - PubMed
    1. Ho W.J., Jaffee E.M., Zheng L. The Tumour Microenvironment in Pancreatic Cancer—Clinical Challenges and Opportunities. Nat. Rev. Clin. Oncol. 2020;17:527–540. doi: 10.1038/s41571-020-0363-5. - DOI - PMC - PubMed