. 2022 Sep 1;14(17):4288.
doi: 10.3390/cancers14174288.

Determining the Potential of DNA Damage Response (DDR) Inhibitors in Cervical Cancer Therapy

Affiliations

Determining the Potential of DNA Damage Response (DDR) Inhibitors in Cervical Cancer Therapy

Santu Saha et al. Cancers (Basel). .

Abstract

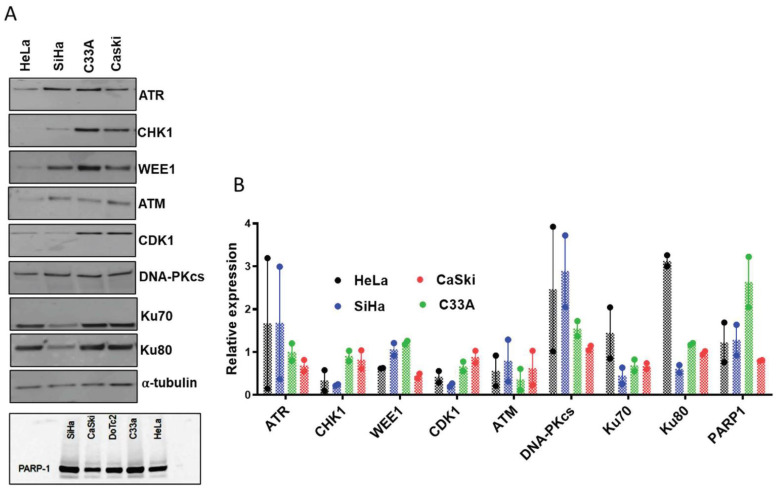
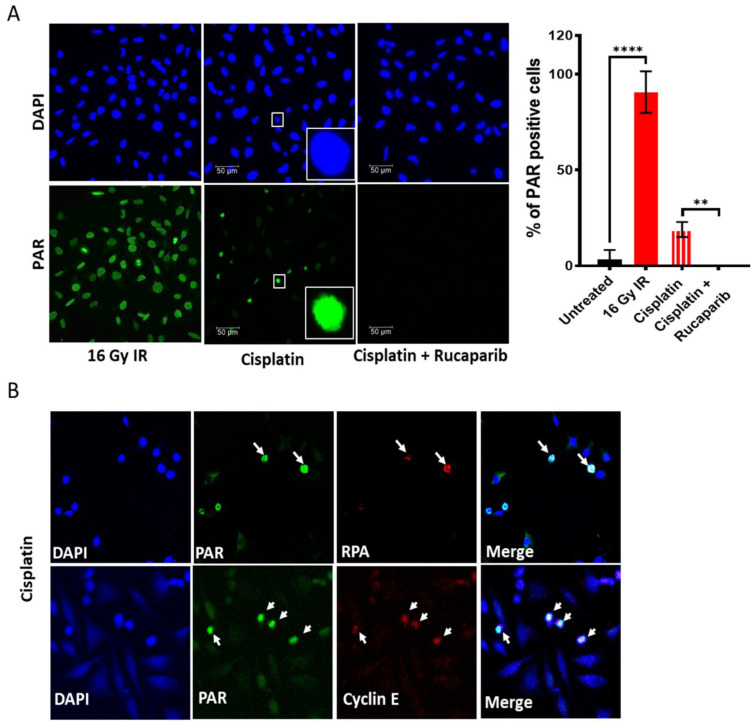
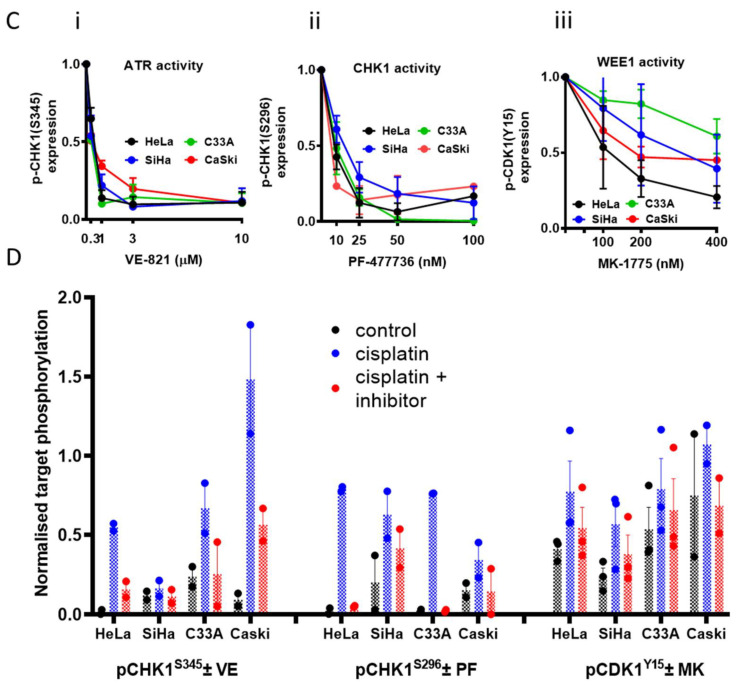
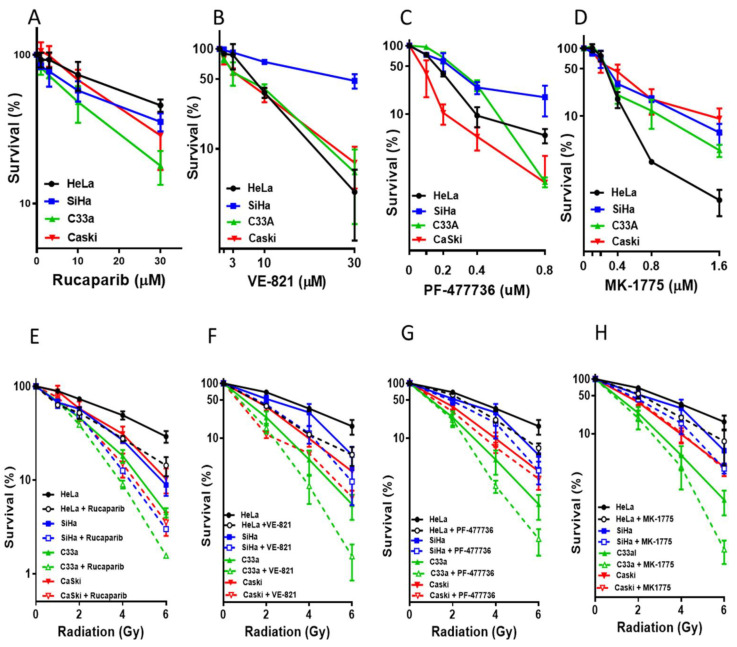
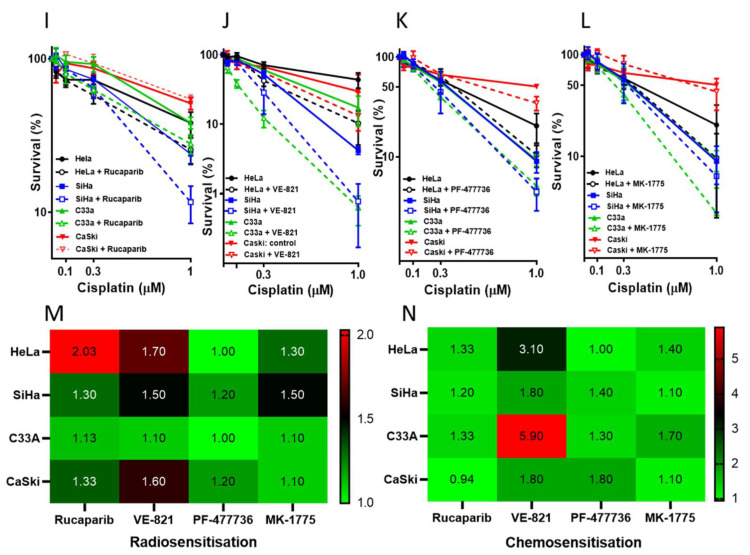
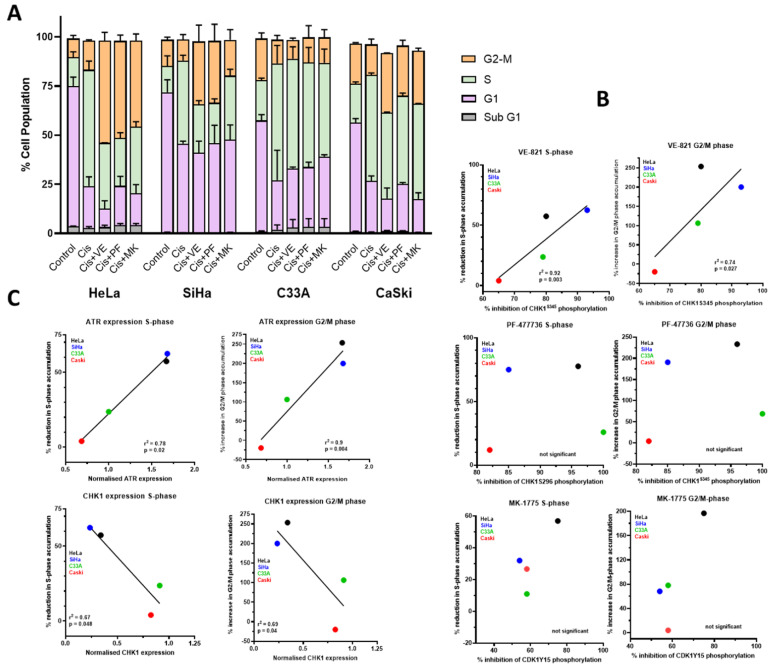
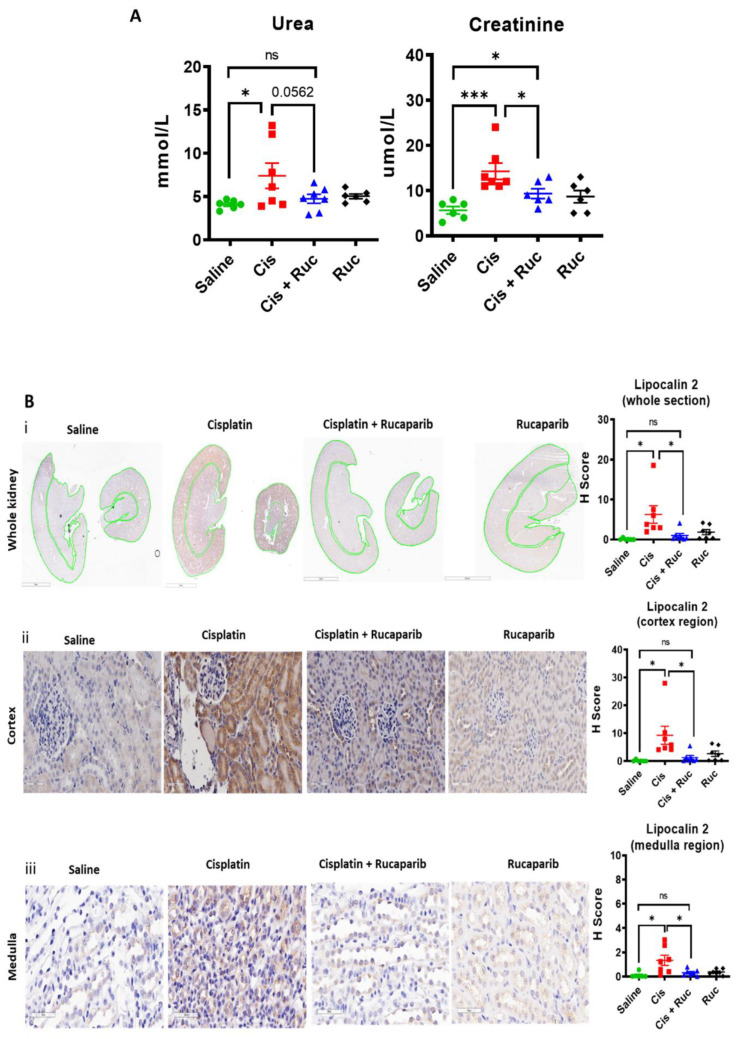
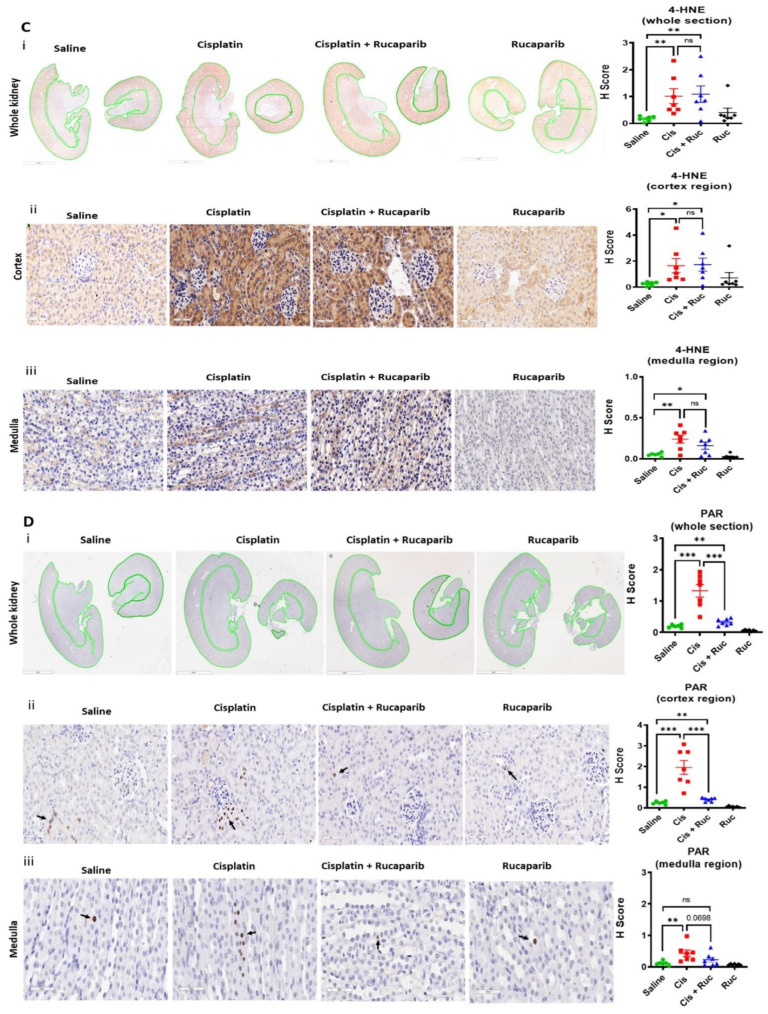
Cisplatin-based chemo-radiotherapy (CRT) is the standard treatment for advanced cervical cancer (CC) but the response rate is poor (46-72%) and cisplatin is nephrotoxic. Therefore, better treatment of CC is urgently needed. We have directly compared, for the first time, the cytotoxicity of four DDR inhibitors (rucaparib/PARPi, VE-821/ATRi, PF-477736/CHK1i and MK-1775/WEE1i) as single agents, and in combination with cisplatin and radiotherapy (RT) in a panel of CC cells. All inhibitors alone caused concentration-dependent cytotoxicity. Low ATM and DNA-PKcs levels were associated with greater VE-821 cytotoxicity. Cisplatin induced ATR, CHK1 and WEE1 activity in all of the cell lines. Cisplatin only activated PARP in S-phase cells, but RT activated PARP in the entire population. Rucaparib was the most potent radiosensitiser and VE-821 was the most potent chemosensitiser. VE-821, PF-47736 and MK-1775 attenuated cisplatin-induced S-phase arrest but tended to increase G2 phase accumulation. In mice, cisplatin-induced acute kidney injury was associated with oxidative stress and PARP activation and was prevented by rucaparib. Therefore, while all inhibitors investigated may increase the efficacy of CRT, the greatest clinical potential of rucaparib may be in limiting kidney damage, which is dose-limiting.

Keywords: DDR inhibitors; cervical cancer; cisplatin; kidney toxicity; radiotherapy.


Conflict of interest statement

N.C. was involved in the development of rucaparib and has received research funding for this work in the past and from Vertex and Merck for studies on VE-821. K.J.M. has received consultancy income from Bath ASU, Freeline Therapeutics & MPM Capital as well as grant income from Gemini Therapeutics & Catalyst Biosciences. A.M. received Royalty from Newcastle University for contributing to the development of rucaparib.

Figures

Figure 1
Figure 1
DDR protein expression in cervical cancer cell lines: (A) representative Western blots of key DDR proteins in cell lysates prepared from exponentially growing cells. (B) Densitometric analysis of replicate Western blots as shown in (A). Data are mean of two independent experiments. Protein expression was normalised to the loading control, α-tubulin or Ponceau S staining (for PARP-1) of the entire blot as given in supplementary Figure S2. Although, the PARP-1 expression in the DoTc2 was checked together with four other cell lines in the Western blot but, due to the very low clonogenic efficiency this cell line was excluded from all the studies hereafter and also excluded from the densitometric analysis in (B).
Figure 2
Figure 2
DDR activation by ionising radiation (IR) and cisplatin and inhibition by drugs targeting these pathways: PARP activity was measured by immunofluorescence detection of the product, PAR, in exponentially growing HeLa cells. Cells were fixed immediately after exposure to 16 Gy IR or 6 h incubation with 500 uM cisplatin at 37 °C. (A) Representative images are shown alongside a bar chart of the percentage of PAR positive nuclei, data are mean ± SD from four independent experiments. The difference of PAR positive cells between untreated, IR and cisplatin ± rucaparib treated groups were compared using unpaired t-test. ** and **** are p < 0.01 and 0.0001 respectively. (B) Co-localisation of PAR positive HeLa cells with replication stress marker RPA and cell proliferation marker Cyclin E indicates PARP activation in replicating cells only in response to cisplatin. Images at 40× magnification. (C) pCHK1S345, pCHK1S296, and pCDK1Y15 levels in cells treated with increasing concentrations of (i) VE-821, (ii) PF-477736 and (iii) MK-1775, respectively (Supplementary Figure S4). Data represents mean ± SEM (N = 3). (D) Analysis of ATR, CHK1 and WEE1 activity from densitometric analysis of pCHK1S345, pCHK1S296, and pCDK1Y15, respectively, in Western blots of exponentially growing cell exposed to 0.5% DMSO alone, 3 μM cisplatin and 3 μM cisplatin + 1 μM VE-821 (VE), 50 nM PF-477736 (PF) or 100 nM MK-1775 (MK) for 24 h prior to harvest cells and lysate preparation (Supplementary Figure S4). Data represents mean of two independent experiments.
Figure 2
Figure 2
DDR activation by ionising radiation (IR) and cisplatin and inhibition by drugs targeting these pathways: PARP activity was measured by immunofluorescence detection of the product, PAR, in exponentially growing HeLa cells. Cells were fixed immediately after exposure to 16 Gy IR or 6 h incubation with 500 uM cisplatin at 37 °C. (A) Representative images are shown alongside a bar chart of the percentage of PAR positive nuclei, data are mean ± SD from four independent experiments. The difference of PAR positive cells between untreated, IR and cisplatin ± rucaparib treated groups were compared using unpaired t-test. ** and **** are p < 0.01 and 0.0001 respectively. (B) Co-localisation of PAR positive HeLa cells with replication stress marker RPA and cell proliferation marker Cyclin E indicates PARP activation in replicating cells only in response to cisplatin. Images at 40× magnification. (C) pCHK1S345, pCHK1S296, and pCDK1Y15 levels in cells treated with increasing concentrations of (i) VE-821, (ii) PF-477736 and (iii) MK-1775, respectively (Supplementary Figure S4). Data represents mean ± SEM (N = 3). (D) Analysis of ATR, CHK1 and WEE1 activity from densitometric analysis of pCHK1S345, pCHK1S296, and pCDK1Y15, respectively, in Western blots of exponentially growing cell exposed to 0.5% DMSO alone, 3 μM cisplatin and 3 μM cisplatin + 1 μM VE-821 (VE), 50 nM PF-477736 (PF) or 100 nM MK-1775 (MK) for 24 h prior to harvest cells and lysate preparation (Supplementary Figure S4). Data represents mean of two independent experiments.
Figure 3
Figure 3
Single-agent cytotoxicity, radiosensitisation and chemosensitisation by the DDR inhibitors: Survival of cervical cancer cells following exposure to single agent (A) rucaparib, (B) VE-821, (C) PF-477736) and (D) MK-1775. Cells were exposed to increasing concentrations of the DDR inhibitors for 24 h and survival was determined by clonogenic assay. Survival is given as a percentage relative to the survival in 0.5% DMSO only as the control. Data are mean ± SEM from three independent experiments. Survival of cervical cancer cell lines exposed to increasing doses of ionising radiation (IR) ± (E) 1 μM rucaparib, (F) 1 μM VE-821, (G) 50 nM PF-477736, or (H) 100 nM MK-1775. Cells were exposed for 24 h and survival was determined by clonogenic assay. Survival is normalised to vehicle (DMSO 0.5%) or inhibitor alone. Data represent means ± SEM from three independent experiments. Survival of cervical cancer cell lines exposed to increasing doses of cisplatin ± (I) 1 μM rucaparib, (J) 1 μM VE-821, (K) 50 nM PF-477736, or (L)100 nM MK-1775. Cells were exposed for 24 h and survival was determined by clonogenic assay. Survival is normalised to vehicle (DMSO 0.5%) or inhibitor alone. Data represents means ± SEM from three independent experiments. (M) The heatmap represents the radiosensitsation potency of the inhibitors, which is based on the PF50 (Supplementary Table S5) with the PF50 values given within each cells of the heatmap. (N) The heatmap represents the chemosensitsation potency of the inhibitors, which is based on the PF50 (Supplementary Table S6) with the PF50 values given within each cells of the heatmap.
Figure 3
Figure 3
Single-agent cytotoxicity, radiosensitisation and chemosensitisation by the DDR inhibitors: Survival of cervical cancer cells following exposure to single agent (A) rucaparib, (B) VE-821, (C) PF-477736) and (D) MK-1775. Cells were exposed to increasing concentrations of the DDR inhibitors for 24 h and survival was determined by clonogenic assay. Survival is given as a percentage relative to the survival in 0.5% DMSO only as the control. Data are mean ± SEM from three independent experiments. Survival of cervical cancer cell lines exposed to increasing doses of ionising radiation (IR) ± (E) 1 μM rucaparib, (F) 1 μM VE-821, (G) 50 nM PF-477736, or (H) 100 nM MK-1775. Cells were exposed for 24 h and survival was determined by clonogenic assay. Survival is normalised to vehicle (DMSO 0.5%) or inhibitor alone. Data represent means ± SEM from three independent experiments. Survival of cervical cancer cell lines exposed to increasing doses of cisplatin ± (I) 1 μM rucaparib, (J) 1 μM VE-821, (K) 50 nM PF-477736, or (L)100 nM MK-1775. Cells were exposed for 24 h and survival was determined by clonogenic assay. Survival is normalised to vehicle (DMSO 0.5%) or inhibitor alone. Data represents means ± SEM from three independent experiments. (M) The heatmap represents the radiosensitsation potency of the inhibitors, which is based on the PF50 (Supplementary Table S5) with the PF50 values given within each cells of the heatmap. (N) The heatmap represents the chemosensitsation potency of the inhibitors, which is based on the PF50 (Supplementary Table S6) with the PF50 values given within each cells of the heatmap.
Figure 4
Figure 4
Effect of VE-821, PF-477736 and MK-1775 on the cell cycle control and its relation to target expression and inhibition: (A) Cell cycle profiles of exponentially growing cells were treated with vehicle control (0.5% DMSO), or 3 μM cisplatin (Cis) ±1 μM VE-821 (VE), 50 nM PF-477736 (PF) or 100 nM MK-1775 (MK) for 24 h before DNA content was analysed. At least 2000 events per sample were recorded. Data are the mean and range of values from two independent experiments. (B) Changes in cisplatin-induced S and G2/M accumulation vs. extent of inhibition cisplatin-induced activation of ATR by 1 μM VE-821, of CHK1 by 50 nM PF-477736 or of WEE1 by 100 nM MK-1775. Data are taken from Figure 2C and Figure 4A. (C) Changes in cisplatin-induced S and G2/M accumulation vs baseline ATR or CHK1 expression in the cell lines. Data are taken from Figure 1B and Figure 4A.
Figure 5
Figure 5
Cisplatin-induced-acute kidney injury is associated with PARP activation and is prevented by rucaparib: Mice were treated with a single dose of 10 mg/kg cisplatin (Cis) on day 1 with or without 5 daily doses of 1 mg/kg rucaparib (Ruc). At the end point (day 5), mice were humanly killed, and blood and kidney tissues were harvested for analysis. (A) Blood urea and creatinine levels. Each data point is from a single mouse (N =≥ 6 mice per group). The difference of urea and creatinine levels between saline and cisplatin ± rucaparib treated groups were compared using unpaired t-test, ns = nonsignificant, * and *** are p < 0.05 and 0.001 respectively. (B) Representative images of kidney toxicity biomarker lipocalin- 2 expression. IHC images were scanned under the Aperio image scanner and staining intensities (H-score) were quantified for the sections as a whole, cortex and medulla regions separately. (i) Whole kidney sections (0.9× magnification, 3 mm scale bar and the green lines are drawn to separate cortex and medulla regions for quantification), (ii) cortex and (iii) medulla regions (40× magnification, 50 µM scale bar). Each data point is from a single mouse (N =≥ 6 mice per group). The difference of lipocalin-2 expression between saline and cisplatin ± rucaparib treated groups were compared using unpaired t-test, ns = nonsignificant and * is p < 0.05. (C) Representative images of oxidative stress biomarker 4-HNE expression. IHC images were scanned under the Aperio image scanner and staining intensities (H-score) were quantified for the sections as a whole, cortex and medulla regions separately. (i) Whole kidney sections (0.9× magnification, 3 mm scale bar and the green lines are drawn to separate cortex and medulla regions for quantification), (ii) cortex and (iii) medulla regions (40× magnification, 50 µM scale bar). Each data point is from a single mouse (N =≥ 6 mice per group). The difference of 4-HNE expression between saline and cisplatin ± rucaparib treated groups were compared using unpaired t-test, ns = nonsignificant, * and ** are p < 0.05 and 0.01. (D) Representative images of PARP activation, measured by PAR expression (PAR positive cells are indicated with arrows). IHC images were scanned under the Aperio image scanner and staining intensities (H-score) were quantified for the sections as a whole, cortex and medulla regions separately. (i) whole kidney sections (0.9× magnification, 3 mm scale bar and the green lines are drawn to separate cortex and medulla regions for quantification), (ii) cortex and (iii) medulla regions (40× magnification, 50 µM scale bar). Each data point is from a single mouse (N =≥ 6 mice per group). The difference of PAR expression between saline and cisplatin ± rucaparib treated groups were compared using unpaired t-test, ns = nonsignificant, ** and *** are p < 0.01and 0.001.
Figure 5
Figure 5
Cisplatin-induced-acute kidney injury is associated with PARP activation and is prevented by rucaparib: Mice were treated with a single dose of 10 mg/kg cisplatin (Cis) on day 1 with or without 5 daily doses of 1 mg/kg rucaparib (Ruc). At the end point (day 5), mice were humanly killed, and blood and kidney tissues were harvested for analysis. (A) Blood urea and creatinine levels. Each data point is from a single mouse (N =≥ 6 mice per group). The difference of urea and creatinine levels between saline and cisplatin ± rucaparib treated groups were compared using unpaired t-test, ns = nonsignificant, * and *** are p < 0.05 and 0.001 respectively. (B) Representative images of kidney toxicity biomarker lipocalin- 2 expression. IHC images were scanned under the Aperio image scanner and staining intensities (H-score) were quantified for the sections as a whole, cortex and medulla regions separately. (i) Whole kidney sections (0.9× magnification, 3 mm scale bar and the green lines are drawn to separate cortex and medulla regions for quantification), (ii) cortex and (iii) medulla regions (40× magnification, 50 µM scale bar). Each data point is from a single mouse (N =≥ 6 mice per group). The difference of lipocalin-2 expression between saline and cisplatin ± rucaparib treated groups were compared using unpaired t-test, ns = nonsignificant and * is p < 0.05. (C) Representative images of oxidative stress biomarker 4-HNE expression. IHC images were scanned under the Aperio image scanner and staining intensities (H-score) were quantified for the sections as a whole, cortex and medulla regions separately. (i) Whole kidney sections (0.9× magnification, 3 mm scale bar and the green lines are drawn to separate cortex and medulla regions for quantification), (ii) cortex and (iii) medulla regions (40× magnification, 50 µM scale bar). Each data point is from a single mouse (N =≥ 6 mice per group). The difference of 4-HNE expression between saline and cisplatin ± rucaparib treated groups were compared using unpaired t-test, ns = nonsignificant, * and ** are p < 0.05 and 0.01. (D) Representative images of PARP activation, measured by PAR expression (PAR positive cells are indicated with arrows). IHC images were scanned under the Aperio image scanner and staining intensities (H-score) were quantified for the sections as a whole, cortex and medulla regions separately. (i) whole kidney sections (0.9× magnification, 3 mm scale bar and the green lines are drawn to separate cortex and medulla regions for quantification), (ii) cortex and (iii) medulla regions (40× magnification, 50 µM scale bar). Each data point is from a single mouse (N =≥ 6 mice per group). The difference of PAR expression between saline and cisplatin ± rucaparib treated groups were compared using unpaired t-test, ns = nonsignificant, ** and *** are p < 0.01and 0.001.

References

    1. Sung H., Ferlay J., Siegel R.L., Laversanne M., Soerjomataram I., Jemal A., Bray F. Global Cancer Statistics 2020: GLOBOCAN Estimates of Incidence and Mortality Worldwide for 36 Cancers in 185 Countries. CA Cancer J. Clin. 2021;71:209–249. doi: 10.3322/caac.21660. - DOI - PubMed
    1. Cervical Cancer Statistics. [(accessed on 25 July 2022)]. Available online: https://www.cancerresearchuk.org/health-professional/cancer-statistics/s....
    1. Marth C., Landoni F., Mahner S., McCormack M., Gonzalez-Martin A., Colombo N., ESMO Guidelines Committee Cervical cancer: ESMO Clinical Practice Guidelines for diagnosis, treatment and follow-up. Ann. Oncol. 2017;28:iv72–iv83. doi: 10.1093/annonc/mdx220. - DOI - PubMed
    1. Boussios S., Seraj E., Zarkavelis G., Petrakis D., Kollas A., Kafantari A., Assi A., Tatsi K., Pavlidis N., Pentheroudakis G. Management of patients with recurrent/advanced cervical cancer beyond first line platinum regimens: Where do we stand? A literature review. Crit. Rev. Oncol. 2016;108:164–174. doi: 10.1016/j.critrevonc.2016.11.006. - DOI - PubMed
    1. Basu A., Krishnamurthy S. Cellular Responses to Cisplatin-Induced DNA Damage. J. Nucleic Acids. 2010;2010:201367. doi: 10.4061/2010/201367. - DOI - PMC - PubMed