. 2022 Sep 1;12(17):2268.
doi: 10.3390/ani12172268.

Effects of Fatty-Type and Lean-Type on Growth Performance and Lipid Droplet Metabolism in Pekin Ducks

Affiliations

Effects of Fatty-Type and Lean-Type on Growth Performance and Lipid Droplet Metabolism in Pekin Ducks

Zhong Zhuang et al. Animals (Basel). .

Abstract

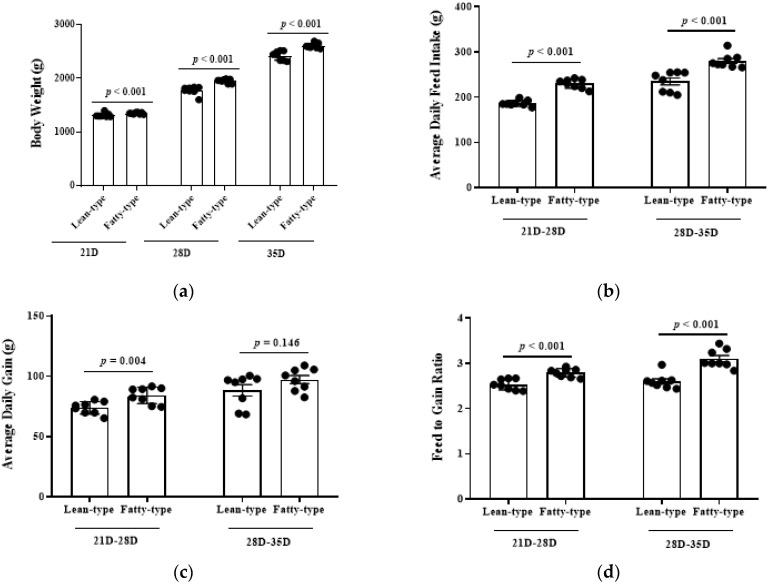
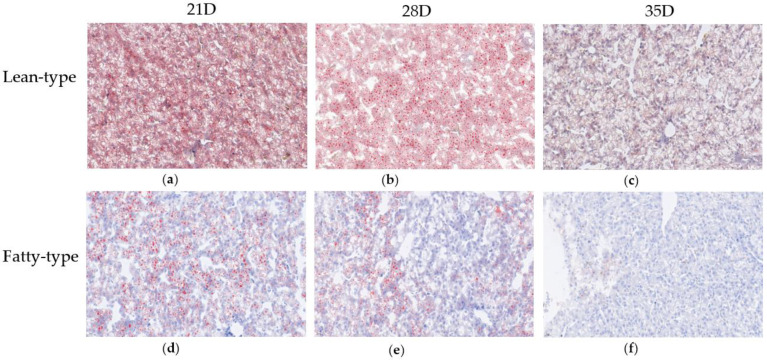
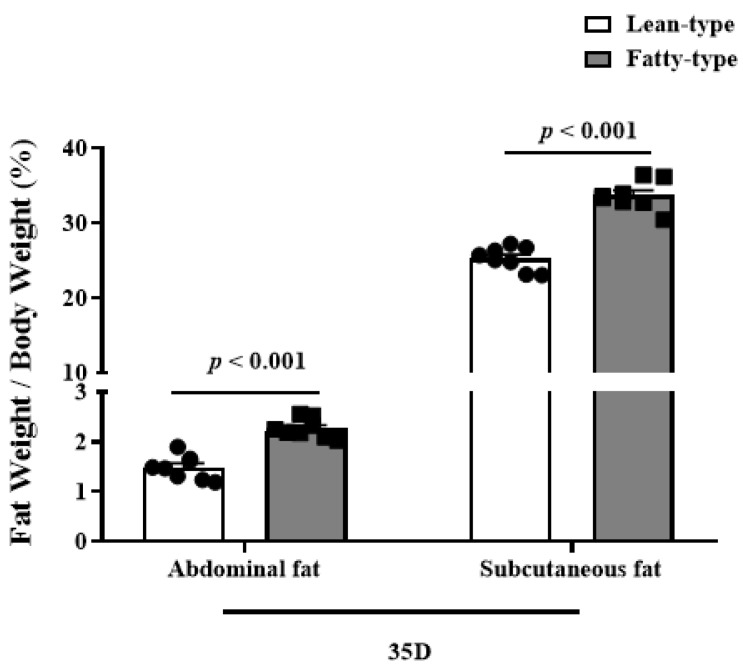
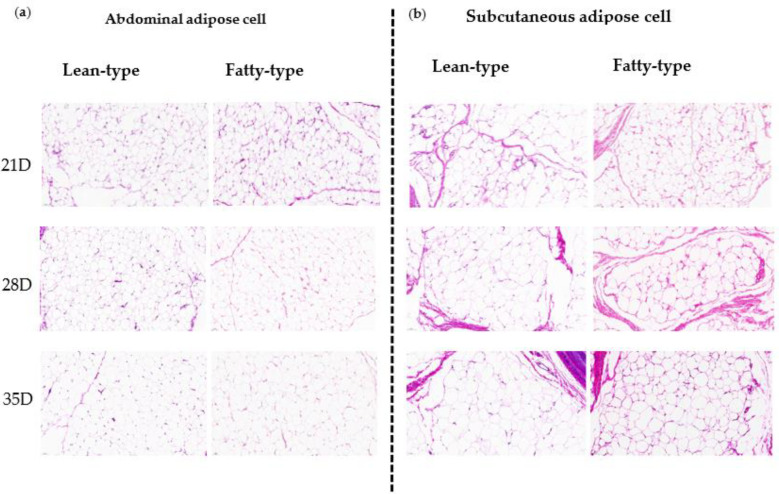
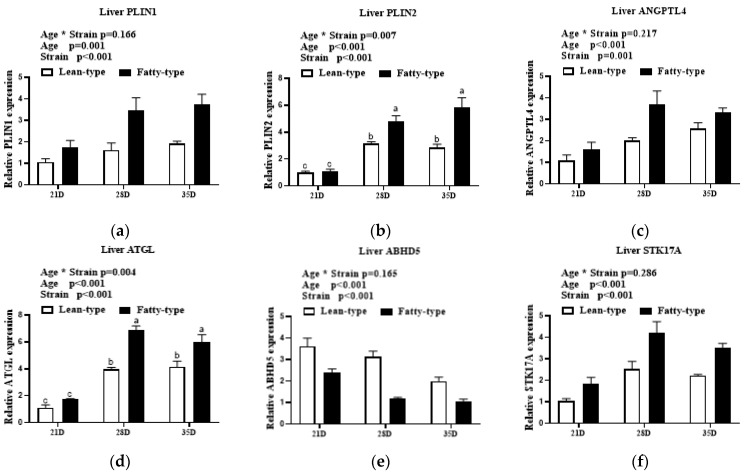
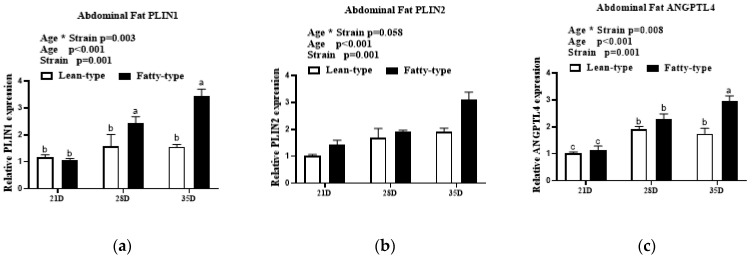
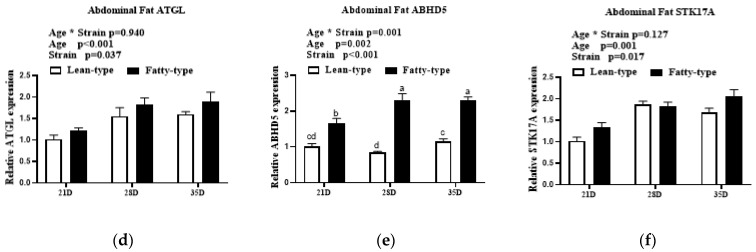
The reasons for differences in lipid depositions between fatty-type (F-T) and lean-type (L-T) ducks remain unknown. The present study aimed to compare the growth performance, lipid deposition, and gene expression related to lipid droplet formation in F-T and L-T Pekin ducks. One-day-old, 140 each L-T and F-T male ducks were selected and distributed separately into 20 replicate cages. All ducks were fed commercial diets up to 35 d of age. F-T ducks had a higher average daily gain from 21 to 28 d of age. On 35-day-old, F-T ducks had higher serum levels of high- and low-density lipoprotein cholesterol, cholesterol, albumin, and hydroxybutyrate dehydrogenase activity than L-T ducks. F-T ducks had higher abdominal fat and subcutaneous fat percentages than those in L-T ducks. Liver histological examination showed that L-T ducks contained more lipid droplets in the liver, which gradually decreased with increasing age. The average adipocyte area and diameter of abdominal fat and subcutaneous fat in the F-T and L-T ducks increased with age and were higher in F-T ducks than those in L-T ducks. Furthermore, the gene expression of perilipin 1, perilipin 2, angiopoietin-like protein 4, adipose triglyceride lipase, alpha/beta-hydrolase domain-containing protein 5 (ABHD5), and serine/threonine kinase 17a in the liver, abdominal fat, and subcutaneous fat of F-T ducks was higher than that in L-T ducks, and it increased with age. Compared to L-T ducks, F-T ducks had higher expression of ABHD5 in the abdominal fat and subcutaneous fat and lower expression in the liver. Thus, F-T ducks displayed lower hepatic lipid deposition and a higher percentage of abdominal fat and subcutaneous fat, suggesting that F-T ducks had higher lipid storage capacity due to increased gene expression related to lipid droplets.

Keywords: Pekin duck; fatty-type; lean-type; lipid deposition; lipid droplet.


Conflict of interest statement

The authors declare no conflict of interest.

Figures

Figure 1
Figure 1
Comparison of body weight (a) average daily feed intake (b), average daily gain (c), and feed-to-gain ratio (d) between two strains of meat duck. Values were compared for statistical analysis on three measuring days (21 D, 28 D, and 35 D). Data are given as means and standard error of the mean (n = 8). p-values are shown after comparison of two strains.
Figure 2
Figure 2
Oil red O staining of liver sections showing the effects of different strains on the hepatic lipid accumulation in the liver of meat duck. Lean-type Pekin ducks after 21 Days of growth (a); Fatty-type Pekin ducks after 21 Days of growth (b); Lean-type Pekin ducks after 28 Days of growth (c); Fatty-type Pekin ducks after 28 Days of growth (d); Lean-type Pekin ducks after 35 Days of growth (e); Fatty-type Pekin ducks after 35 Days of growth (f). The red spots in the pictures are stained lipid droplets. Scale bar: 20 μm.
Figure 3
Figure 3
Comparison of abdominal fat and subcutaneous fat contents at 35 D between two strains of meat duck. Data are given as means and standard error of the mean (n = 8). p-values are shown after comparison of two strains.
Figure 4
Figure 4
Representative H&E staining pictures of the abdominal adipose cell (a) and subcutaneous adipose cell (b) of 21 D, 28 D, and 35 D old ducks. The scale bar is 50 μm. Abbreviations: H&E, hematoxylin, and eosin.
Figure 5
Figure 5
Comparison of expression levels of lipid droplet anabolism genes in liver (af) at 21 D, 28 D, and 35 D between two strains of meat ducks. Data are given as means and standard error of the mean (n = 6). Bars with different letters are significantly different (p < 0.05). * In the figure represents the interaction between the two factors. Abbreviations: PLIN1, perilipin 1; PLIN2, perilipin 2; ANGPTL4, angiopoietin-like protein 4; ATGL, adipose triglyceride lipase; ABHD5, abhydrolase domain containing 5; STK17A; serine/threonine kinase 17a.
Figure 6
Figure 6
Comparison of expression levels of lipid droplet anabolism genes in abdominal fat (af) at 21 D, 28 D, and 35 D between two strains of meat ducks. Data are given as means and standard error of the mean (n = 6). Bars with different letters are significantly different (p < 0.05). * In the figure represents the interaction between the two factors. Abbreviations: PLIN1, perilipin 1; PLIN2, perilipin 2; ANGPTL4, angiopoietin-like protein 4; ATGL, adipose triglyceride lipase; ABHD5, abhydrolase domain containing 5; STK17A; serine/threonine kinase 17a.
Figure 6
Figure 6
Comparison of expression levels of lipid droplet anabolism genes in abdominal fat (af) at 21 D, 28 D, and 35 D between two strains of meat ducks. Data are given as means and standard error of the mean (n = 6). Bars with different letters are significantly different (p < 0.05). * In the figure represents the interaction between the two factors. Abbreviations: PLIN1, perilipin 1; PLIN2, perilipin 2; ANGPTL4, angiopoietin-like protein 4; ATGL, adipose triglyceride lipase; ABHD5, abhydrolase domain containing 5; STK17A; serine/threonine kinase 17a.
Figure 7
Figure 7
Comparison of expression levels of lipid droplet anabolism genes in subcutaneous fat (af) at 21 D, 28 D, and 35 D between two strains of meat ducks. Data are given as means and standard error of the mean (n = 6). Bars with different letters are significantly different (p < 0.05). * In the figure represents the interaction between the two factors. Abbreviations: PLIN1, perilipin 1; PLIN2, perilipin 2; ANGPTL4, angiopoietin-like protein 4; ATGL, adipose triglyceride lipase; ABHD5, abhydrolase domain containing 5; STK17A; serine/threonine kinase 17a.

Similar articles

Cited by

References

    1. Vostrizansky A., Barce A., Gum Z., Shafer D.J., Jeffrey D., Fraley G.S., Rivera P.D. Effect of pre-hatch incubator lights on the ontogeny of CNS opsins and photoreceptors in the Pekin duck. Poult. Sci. 2022;101:101699. doi: 10.1016/j.psj.2022.101699. - DOI - PMC - PubMed
    1. Jiang Y., Xie M., Tang J., Zhou Z., Zhang Y., Chen G., Hou S. Effects of genetic selection and threonine on meat quality in Pekin ducks. Poult. Sci. 2020;99:2508–2518. doi: 10.1016/j.psj.2019.10.059. - DOI - PMC - PubMed
    1. Zheng A., Chang W., Hou S., Zhang S., Cai H., Chen G., Lou R., Liu G. Unraveling molecular mechanistic differences in liver metabolism between lean and fat lines of Pekin duck (Anas platyrhynchos domestica): A proteomic study. J. Proteom. 2014;98:271–288. doi: 10.1016/j.jprot.2013.12.021. - DOI - PubMed
    1. Farhat A., Chavez E.R. Metabolic studies on lean and fat Pekin ducks selected for breast muscle thickness measured by ultrasound scanning. Poult. Sci. 2001;80:585–591. doi: 10.1093/ps/80.5.585. - DOI - PubMed
    1. Ding S.R., Li G.S., Chen S.R., Zhu F., Hao J.P., Yang F.X., Hou Z.C. Comparison of carcass and meat quality traits between lean and fat Pekin ducks. Anim. Biosci. 2021;34:1193–1201. doi: 10.5713/ajas.19.0612. - DOI - PMC - PubMed