. 2022 Aug 30;11(17):2697.
doi: 10.3390/cells11172697.

Monoamine Oxidase-Dependent Pro-Survival Signaling in Diabetic Hearts Is Mediated by miRNAs

Affiliations

Monoamine Oxidase-Dependent Pro-Survival Signaling in Diabetic Hearts Is Mediated by miRNAs

Stefano Cagnin et al. Cells. .

Abstract

Diabetes leads to cardiomyopathy and heart failure, the leading cause of death for diabetic patients. Monoamine oxidase (MAO) inhibition in diabetic cardiomyopathy prevents oxidative stress, mitochondrial and endoplasmic reticulum stress and the development of diastolic dysfunction. However, it is unclear whether, in addition to the direct effects exerted on the mitochondria, MAO activity is able to post-transcriptionally regulate cardiomyocyte function and survival in diabetes. To this aim, we performed gene and miRNA expression profiling in cardiac tissue from streptozotocin-treated mice (model of type 1 diabetes (T1D)), administered with either vehicle or MAOs inhibitor pargyline for 12 weeks. We found that inhibition of MAO activity in T1D hearts leads to profound transcriptomic changes, affecting autophagy and pro-survival pathways activation. MAO activity in T1D hearts increased miR-133a-3p, -193a-3p and -27a-3p expression. These miRNAs target insulin-like growth factor receptor 1 (Igf1r), growth factor receptor bound protein 10 and inositol polyphosphate 4 phosphatase type 1A, respectively, all components of the IGF1R/PI3K/AKT signaling pathway. Indeed, AKT activation was significantly downregulated in T1D hearts, whereas MAO inhibition restored the activation of this pro-survival pathway. The present study provides an important link between MAO activity, transcriptomic changes and activation of pro-survival signaling and autophagy in diabetic cardiomyopathy.

Keywords: autophagy; diabetic cardiomyopathy; miRNAs; monoamine oxidase; pro-survival pathways.


Conflict of interest statement

The authors declare no conflict of interest.

Figures
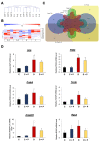
Figure 1
Figure 1
mRNA gene expression. (A) Dendrogram describing relationship of samples obtained according to mRNA gene expression. (B) Clusters of differentially expressed genes. Gene expression was calculated in relation to the average expression of the gene in all samples. (C) Venn diagram describing the number of differentially expressed mRNA for each comparison. (D) Validation of the mRNA microarray through qRT-PCR. mRNA levels were normalized to the housekeeping gene Tbp. * p ≤ 0.05 vs. C. C: control; C + P: control + pargyline; D: diabetes; D + P: diabetes + pargyline; Anp: atrial natriuretic peptide; Pdk4: pyruvate dehydrogenase kinase 4; Prdx4: peroxiredoxin 4; Txnip: thioredoxin interacting protein; Angptl4: angiopoietin-like 4; Rgs2: regulator of G-protein signaling 2.
Figure 2
Figure 2
Effects of MAO inhibition on autophagy flux in T1D hearts and NRVMs cultured with high glucose. (A) Representative Western blot (upper panel) and densitometry analyses (lower panel) of the autophagy marker LC3B-II in control (C), diabetic (D) and diabetic mice treated with the MAO inhibitor pargyline (D + P). Values were normalized to actin or Red Ponceau staining. * p ≤ 0.05 vs. C; # p ≤ 0.05 vs. D, by Dunn’s non-parametric test. (B) Representative Western blots (upper panel) and densitometry analyses (lower panel) of LC3B-II in NRVMs cultured with the osmotic control mannitol (HM) or high glucose (HG) at baseline or after treatment with the inhibitor of lysosomal degradation chloroquine (chloro). Parallel experiments were performed in the presence of MAO inhibitor pargyline. Values were normalized to actin. LC3B-II abundance in HM groups was arbitrarily considered as a unit. * p ≤ 0.05 vs. HG chloro, with two-tailed equal variance t-test.
Figure 3
Figure 3
MiRNA gene expression. Heatmap of differentially expressed miRNAs. Both samples and miRNAs were clustered according to average dot products and complete linkage. Cluster 1 represents miRNAs upregulated in heart samples of diabetic mice that returned to control levels after pargyline treatment. Cluster 2 represents miRNAs downregulated in heart samples of diabetic mice that were normalized after pargyline treatment. C: control; C + P: control + pargyline; D: diabetes; D + P: diabetes + pargyline.
Figure 4
Figure 4
Transcriptomic miRNA expression validation. MiRNA expression was calculated through qRT-PCR relative to U6. Error bars indicate standard deviation calculated on at least three samples and three technical replicates per sample. Significance was calculated using a t-test between samples considering unequal variance between samples. * p ≤ 0.05; ** p ≤ 0.002. C: control; C + P: control + pargyline; D: diabetes; D + P: diabetes + pargyline.
Figure 5
Figure 5
MiRNAs expression after MAO-A downregulation. MiRNAs expression was calculated through qRT-PCR relative to U6. Error bars indicate standard deviation calculated on at least three samples and three technical replicates per sample. Significance was calculated using t-test between samples considering unequal variance between samples. * p ≤ 0.05 vs. HM scramble; # p ≤ 0.05 vs. HG scramble.
Figure 6
Figure 6
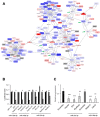
Interaction of miRNAs with their targets. (A) Network representing the interaction between miRNA (triangles) and targets (rectangles). Interactions among rectangles represent interactions retrieved from the BioGrid database. Colors inside nodes represent gene expression calculated as D/D + P, while border colors represent gene expression calculated as D/C. Green arrows indicate target miRNAs for which we validated miRNA–gene interactions. (B) Luciferase assay was performed to demonstrate the direct interaction between miR-133a-3p and Igf1r; miR-27a-3p and Inpp4a, Elk1 and Rps6ka2; miR-193a-3p and Mapk10 and Grb10. Part of Igf1r, Inpp4a, Elk1, Rps6ka2, Mapk10 and Grb10 sequences containing putative miRNA interaction sites (or not containing; Igf1r-, Inpp4a-, Elk1-, Rps6ka2-, Mapk10-, Grb10-Ctrl) were cloned into pmirGLO vector. Firefly luciferase (reporter gene) and Renilla luciferase (control reporter for normalization) activities were measured after transfection of cardiomyocytes together with miRNA mimics or a scramble sequence (Ctrl). (C) Gene expression of miR-27a-3p and -193a-3p targets after specific miRNA or scramble overexpression in cardiomyocytes. For both panels, data are expressed as the mean of at least four independent transfections. Significance was calculated using t-test between samples considering unequal variance between samples. * p ≤ 0.05; ** p ≤ 0.002; *** p ≤ 0.0002.
Figure 7
Figure 7
Effect of MAO inhibition on AKT activation in diabetic hearts. (A) Representative Western blot (upper panel) and densitometry analyses (lower panel) of the AKT phosphorylated on Thr308 and total AKT are shown in control (C), diabetic (D) and diabetic mice treated with the MAO inhibitor pargyline (D + P). Values were normalized to total AKT levels. * p ≤ 0.05 vs. C, # p ≤ 0.05 vs. D, with one-tailed equal variance t-test. (B) Representative Western blot (upper panel) and densitometry analyses (lower panel) of the AKT phosphorylated on Ser473 and total AKT are shown in control (C), diabetic (D) and diabetic mice treated with the MAO inhibitor pargyline (D + P). Values were normalized to total AKT levels. * p ≤ 0.05 vs. C, with one-tailed equal variance t-test.
Figure 8
Figure 8
Graphical abstract of the main findings of this study indicating MAO-dependent post-transcriptional regulation of Igf1r, Grb10 and Inpp4a via miR-133a-3p, -27a-3p and -193a-3p, which in turn regulate pro-survival signaling through AKT activation in diabetic hearts.

References

    1. Kaludercic N., Di Lisa F. Mitochondrial ROS Formation in the Pathogenesis of Diabetic Cardiomyopathy. Front. Cardiovasc. Med. 2020;7:12. doi: 10.3389/fcvm.2020.00012. - DOI - PMC - PubMed
    1. Rota M., Le Capitaine N., Hosoda T., Boni A., De Angelis A., Padin-Iruegas M.E., Esposito G., Vitale S., Urbanek K., Casarsa C., et al. Diabetes promotes cardiac stem cell aging and heart failure, which are prevented by deletion of the p66shc gene. Circ. Res. 2006;99:42–52. doi: 10.1161/01.RES.0000231289.63468.08. - DOI - PubMed
    1. Giorgio M., Migliaccio E., Orsini F., Paolucci D., Moroni M., Contursi C., Pelliccia G., Luzi L., Minucci S., Marcaccio M., et al. Electron transfer between cytochrome c and p66Shc generates reactive oxygen species that trigger mitochondrial apoptosis. Cell. 2005;122:221–233. doi: 10.1016/j.cell.2005.05.011. - DOI - PubMed
    1. Carpi A., Menabo R., Kaludercic N., Pelicci P., Di Lisa F., Giorgio M. The cardioprotective effects elicited by p66(Shc) ablation demonstrate the crucial role of mitochondrial ROS formation in ischemia/reperfusion injury. Biochim. Biophys. Acta. 2009;1787:774–780. doi: 10.1016/j.bbabio.2009.04.001. - DOI - PubMed
    1. Maalouf R.M., Eid A.A., Gorin Y.C., Block K., Escobar G.P., Bailey S., Abboud H.E. Nox4-derived reactive oxygen species mediate cardiomyocyte injury in early type 1 diabetes. Am. J. Physiol. Cell Physiol. 2012;302:C597–C604. doi: 10.1152/ajpcell.00331.2011. - DOI - PMC - PubMed

Publication types

MeSH terms