. 2022 Sep 2;11(17):2743.
doi: 10.3390/cells11172743.

Immune Determinants of Viral Clearance in Hospitalised COVID-19 Patients: Reduced Circulating Naïve CD4+ T Cell Counts Correspond with Delayed Viral Clearance

Affiliations

Immune Determinants of Viral Clearance in Hospitalised COVID-19 Patients: Reduced Circulating Naïve CD4+ T Cell Counts Correspond with Delayed Viral Clearance

Mihaela Zlei et al. Cells. .

Abstract

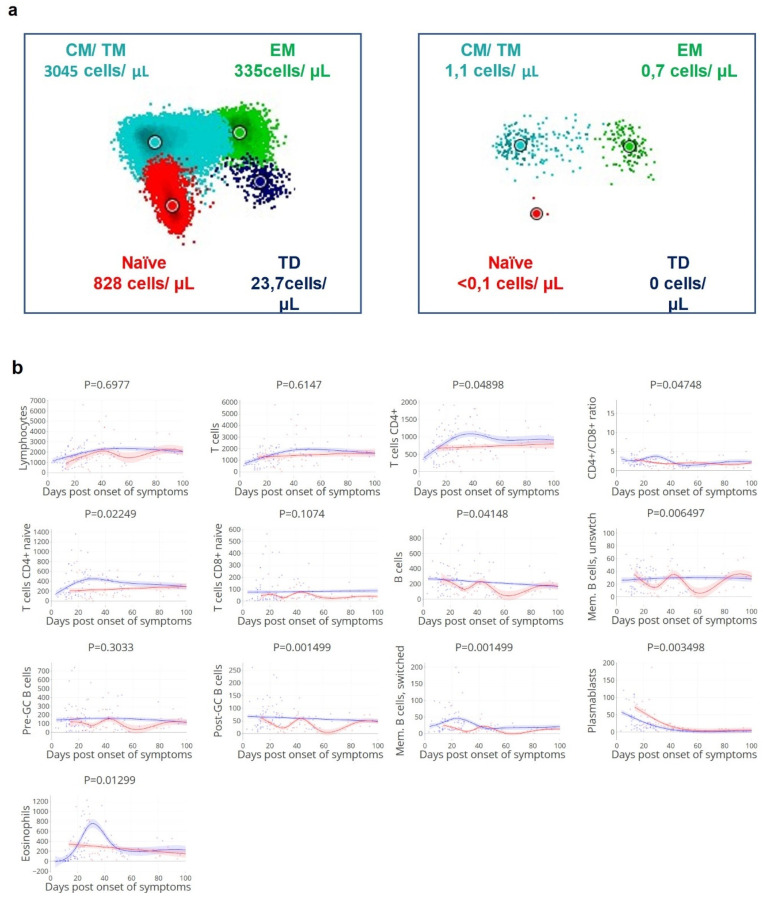
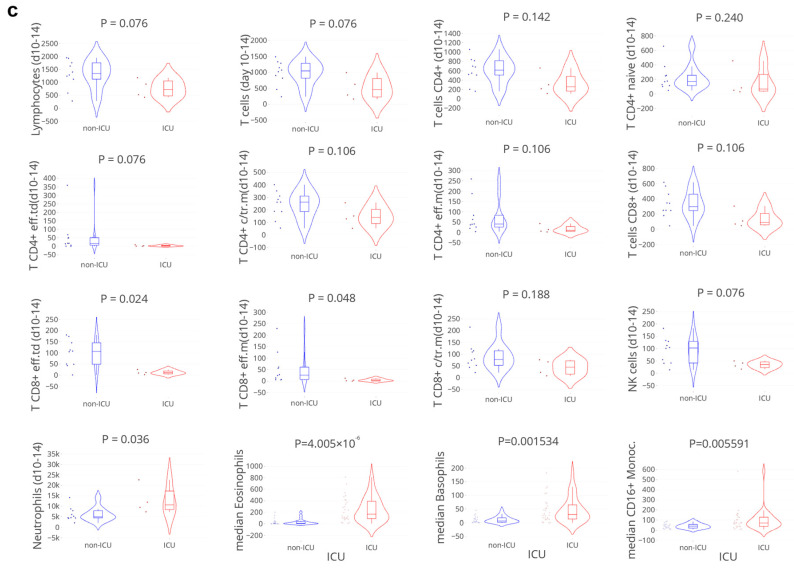
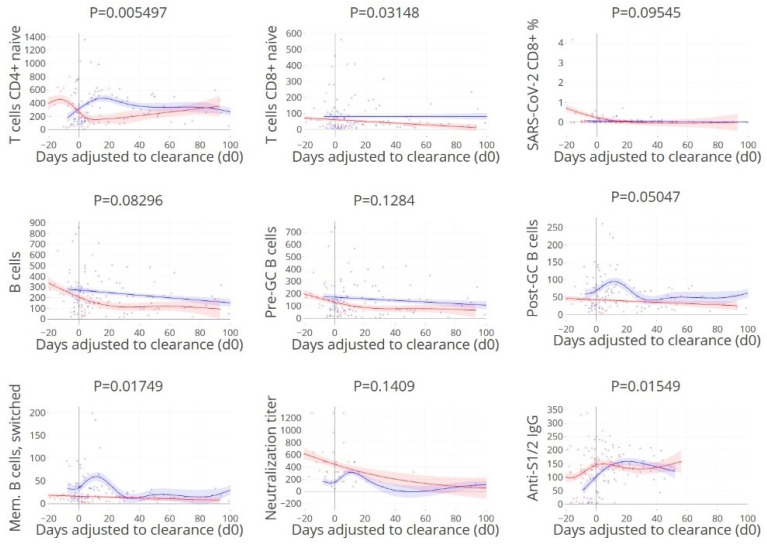
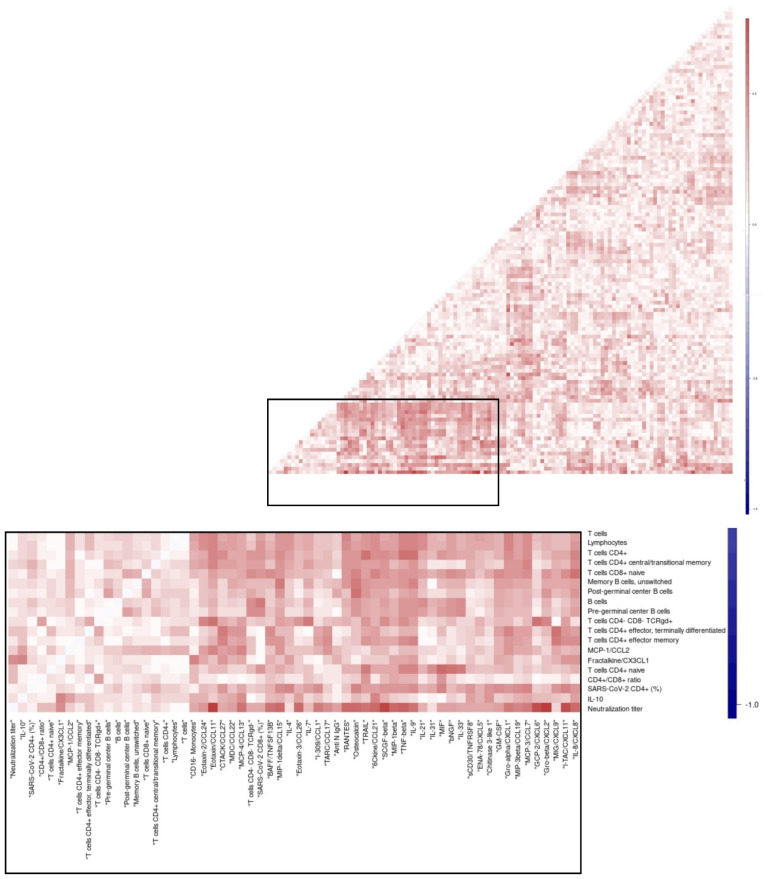
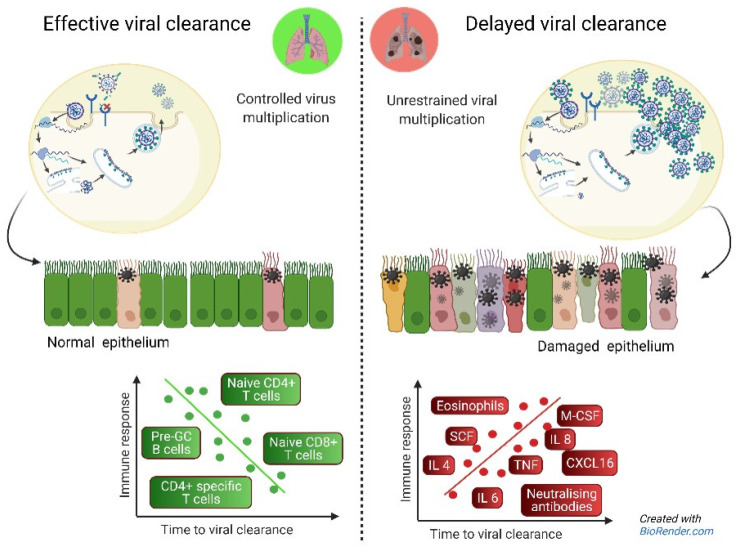
Virus-specific cellular and humoral responses are major determinants for protection from critical illness after SARS-CoV-2 infection. However, the magnitude of the contribution of each of the components to viral clearance remains unclear. Here, we studied the timing of viral clearance in relation to 122 immune parameters in 102 hospitalised patients with moderate and severe COVID-19 in a longitudinal design. Delayed viral clearance was associated with more severe disease and was associated with higher levels of SARS-CoV-2-specific (neutralising) antibodies over time, increased numbers of neutrophils, monocytes, basophils, and a range of pro-inflammatory cyto-/chemokines illustrating ongoing, partially Th2 dominating, immune activation. In contrast, early viral clearance and less critical illness correlated with the peak of neutralising antibodies, higher levels of CD4 T cells, and in particular naïve CD4+ T cells, suggesting their role in early control of SARS-CoV-2 possibly by proving appropriate B cell help. Higher counts of naïve CD4+ T cells also correlated with lower levels of MIF, IL-9, and TNF-beta, suggesting an indirect role in averting prolonged virus-induced tissue damage. Collectively, our data show that naïve CD4+ T cell play a critical role in rapid viral T cell control, obviating aberrant antibody and cytokine profiles and disease deterioration. These data may help in guiding risk stratification for severe COVID-19.

Keywords: COVID-19; naïve CD4+ T cell; viral clearance.


Conflict of interest statement

The authors have declared that no conflict of interest exists.

Significance Statement: This report builds upon data from others on the significance of T cell responses for protection from critical COVID-19. We here report that the number of CD4+ naïve T cells associate with rapid viral clearance and reduced cytokine levels and may thus forfend the inflammatory cascade involved in local tissue damage.

Figures

Figure 1
Figure 1
Time to viral clearance correlates with disease severity. (a). Kinetics of daily clinical severity scores and PO2/FiO2 (P/F) ratios: kinetics in relation to the time post onset of symptoms in days, per patient per groups with rapid: ≤ 21 days (blue lines/dots) and delayed: > 21 days viral clearance (red lines/dots). Lines indicate non-linear group trends. Spline regression with bootstrap confidence intervals, 39.9 kPa stands for the minimum disease severity. (b). The maximum (max.) daily clinical severity score and P/F ratio per patient in relation to time to viral clearance (days), defined as the last positive PCR. Spearman’s rank correlation (rho), and Mann–Whitney U test (violin plots). (c). Viral clearance precedes critical illness. Number of days between viral clearance (vertical line, day 0) in relation to the maximum severity scores and to P/F ratio, respectively. Viral clearance ≤ 21 days (blue lines/dots)/> 21 days (red lines/dot). Spearman’s rank correlation (rho), n = 91 patients.
Figure 2
Figure 2
Higher SARS-CoV-2 loads, over time are associated with ICU admission and fatality. (a). kinetics in relation to the time post onset of symptoms (days), per patient per groups with rapid: ≤ 21 days (blue lines/dots) and delayed: > 21 days viral clearance (red lines/dots), ICU admission, and fatality. Lines indicate non-linear group trends. Spline regression with bootstrap confidence intervals. (b). Mean datapoints at day 10–14 data per patient, grouped according to the time to viral clearance ≤ 21 days (blue)/> 21 days (red), ICU admittance, and fatality, respectively. n = 91 patients. Mann–Whitney U test.
Figure 3
Figure 3
Apparent paradoxical higher (neutralising) antibody titers in cases with delayed clearance, ICU admittance, and fatality. Anti-HCOV-229E IgG was included as negative control (see Supplementary Figure S1). (a). Median values per patient grouped by the time to viral clearance: ≤ 21 (blue)/> 21 (red) days, ICU admittance, and fatality. Mann–Whitney U test. (b,c). Maximum values, grouped by the time to viral clearance: ≤21 (blue)/>21 (red) days, and ICU admittance. C-term./C-t.; C-terminal, N-term/N-t.; N-terminal. Neutralisation titer; 20 patients, 50 samples. Anti-S1/2 IgG; 58 patients, 158 samples. Anti-N IgG 82 patients, 196 samples. Anti-N(N/C terminus IgG and anti-N229 IgG; 84 patients, 187 samples. Mann–Whitney U test.
Figure 4
Figure 4
(a). Low density of circulating CD4+ T cell compartment in a patient with delayed viral clearance (right). Representative illustration of CD4+ T cell compartment in the peripheral blood samples of a patient with rapid (left: duration of positive PCR—1 day) or delayed viral clearance (right: duration of positive PCR—29 days). CM = central memory; TM = transitional memory; EM = effector memory; TD = effector, terminally differentiated; data analysis performed with Infinicyt software (Cytognos, Salamanca, Spain), each diagram is a representation of automated population separator (APS). One sample for each of the two patients. (b). Reduced circulating (naïve) CD4+ T cells, post-GC B cells, and memory B cell count over time corresponds with delayed viral clearance. Kinetics of absolute counts of circulating leukocyte subsets (measured as cells/µL) in relation to the time to viral clearance, a selection of subsets based on p-values (see Supplementary Figure S2). Groups with rapid: ≤ 21 days (blue lines/dots) and delayed: > 21 days viral clearance (red lines/dots). Lines indicate non-linear group trends. Spline regression with bootstrap confidence intervals. (c). Reduced CD8+ effector T cell count at day 10–14 corresponds with ICU admission. Mean values at day 10–14 grouped by non-ICU (blue)/ICU (red) patients, and median values per patient. T CD4+ c/tr.m; T cells CD4+ central/transitional memory, T CD4+ eff.m; T cells CD4+ effector memory, td; terminally differentiated, pre-GC; pre germinal center B cells; circulating naïve B cells [32]. n = 41 patients, 128 samples. Mann–Whitney U test.
Figure 4
Figure 4
(a). Low density of circulating CD4+ T cell compartment in a patient with delayed viral clearance (right). Representative illustration of CD4+ T cell compartment in the peripheral blood samples of a patient with rapid (left: duration of positive PCR—1 day) or delayed viral clearance (right: duration of positive PCR—29 days). CM = central memory; TM = transitional memory; EM = effector memory; TD = effector, terminally differentiated; data analysis performed with Infinicyt software (Cytognos, Salamanca, Spain), each diagram is a representation of automated population separator (APS). One sample for each of the two patients. (b). Reduced circulating (naïve) CD4+ T cells, post-GC B cells, and memory B cell count over time corresponds with delayed viral clearance. Kinetics of absolute counts of circulating leukocyte subsets (measured as cells/µL) in relation to the time to viral clearance, a selection of subsets based on p-values (see Supplementary Figure S2). Groups with rapid: ≤ 21 days (blue lines/dots) and delayed: > 21 days viral clearance (red lines/dots). Lines indicate non-linear group trends. Spline regression with bootstrap confidence intervals. (c). Reduced CD8+ effector T cell count at day 10–14 corresponds with ICU admission. Mean values at day 10–14 grouped by non-ICU (blue)/ICU (red) patients, and median values per patient. T CD4+ c/tr.m; T cells CD4+ central/transitional memory, T CD4+ eff.m; T cells CD4+ effector memory, td; terminally differentiated, pre-GC; pre germinal center B cells; circulating naïve B cells [32]. n = 41 patients, 128 samples. Mann–Whitney U test.
Figure 5
Figure 5
Lower SARS-CoV-2-specific CD4+ T cell counts correspond with higher disease severity. (a). Kinetics of circulating CD4+ and CD8+ T-cells specific to SARS-CoV-2 spike, nucleocapsid, and membrane peptides, in relation to the day of viral clearance. (b). Maximum values grouped by the time to viral clearance: ≤ 21 (blue)/> 21 (red) days. Lines indicate non-linear group trends. Spline regression with bootstrap confidence intervals. (c). Maximum values and average daily severity scores per patient, grouped by the time to viral clearance: ≤ 21 (blue)/> 21 (red) days. (d). Maximum values grouped by non-ICU (blue)/ICU (red) patients. SARS-CoV-2 CD4+ (%) = percentage of CD154+CD137+ out of total CD4+ T cells, SARS-CoV-2 CD8+ (%) = percentage of CD137+IFNg+ out of total CD8+ T cells. S.CoV-2; SARS-CoV-2. n = 34 patients, 130 samples. Mann–Whitney U test.
Figure 6
Figure 6
Higher levels of pro-inflammatory cyto/chemokines correspond with delayed viral clearance. Volcano plot: cytokines and chemokines (maximum levels) correlated with the time to viral clearance, a selection based on p-value ≤ 0.05, with R ≥ 0.4 in bold. An overview of all cytokines and chemokines assessed is listed in Supplementary Table S2. n = 51 patients, 321 samples. Spearman’s rank correlation (rho).
Figure 7
Figure 7
Peak levels of naïve CD4+ T cells, naïve CD8+ T cells, post GC and memory B cells, and anti-spike IgG coincide with rapid viral clearance. Kinetics of humoral and cellular immune parameters adjusted to the timing of viral clearance (day 0). A selection of humoral and cellular parameters was made based on findings described above. Blue: viral clearance ≤ 21 days, red: > 21 days. Lines indicate non-linear group trends. Spline regression with bootstrap confidence intervals.
Figure 8
Figure 8
CD4+ T cell subset counts inversely correlate with proinflammatory cytokines: naïve CD4 T cells with MIF, and CD4+ T cells with IL-9/TNFbeta, in patients with rapid viral clearance. Correlation heatmaps of the maximum level of immune parameters in individual patients, for the differences between the patient groups with viral clearance > 21 days and clearance ≤ 21 days. MIF; macrophage migration inhibitory factor. Pearson’s correlation coefficient.
Figure 9
Figure 9
Hypothesis-generated drawing including all immune parameters in this study found to be associated with (delayed) viral clearance. Pre-GC; pre germinal center B cells; circulating naïve B cells [32]. Adapted from “Coronavirus Replication Cycle”, by BioRender.com, accessed 1 January 2022.

References

    1. Fajnzylber J., Regan J., Coxen K., Corry H., Wong C., Rosenthal A., Worrall D., Giguel F., Piechocka-Trocha A., Atyeo C., et al. SARS-CoV-2 viral load is associated with increased disease severity and mortality. Nat. Commun. 2020;11:5493. doi: 10.1038/s41467-020-19057-5. - DOI - PMC - PubMed
    1. Westblade L.F., Brar G., Pinheiro L.C., Paidoussis D., Rajan M., Martin P., Goyal P., Sepulveda J.L., Zhang L., George G., et al. SARS-CoV-2 Viral Load Predicts Mortality in Patients with and without Cancer Who Are Hospitalized with COVID-19. Cancer Cell. 2020;38:661–671.e662. doi: 10.1016/j.ccell.2020.09.007. - DOI - PMC - PubMed
    1. Zheng S., Fan J., Yu F., Feng B., Lou B., Zou Q., Xie G., Lin S., Wang R., Yang X., et al. Viral load dynamics and disease severity in patients infected with SARS-CoV-2 in Zhejiang province, China, January-March 2020: Retrospective cohort study. BMJ. 2020;369:m1443. doi: 10.1136/bmj.m1443. - DOI - PMC - PubMed
    1. He X., Lau E.H.Y., Wu P., Deng X., Wang J., Hao X., Lau Y.C., Wong J.Y., Guan Y., Tan X., et al. Temporal dynamics in viral shedding and transmissibility of COVID-19. Nat. Med. 2020;26:672–675. doi: 10.1038/s41591-020-0869-5. - DOI - PubMed
    1. Neant N., Lingas G., Le Hingrat Q., Ghosn J., Engelmann I., Lepiller Q., Gaymard A., Ferre V., Hartard C., Plantier J.C., et al. Modeling SARS-CoV-2 viral kinetics and association with mortality in hospitalized patients from the French COVID cohort. Proc. Natl. Acad. Sci. USA. 2021;118:e2017962118. doi: 10.1073/pnas.2017962118. - DOI - PMC - PubMed

Publication types

Substances